In the fast-evolving semiconductor industry, Arm Holdings plc and CEVA, Inc. stand out as key players shaping the future of technology. Both companies specialize in licensing advanced processor architectures and digital signal processing technologies, targeting markets such as IoT, automotive, and mobile devices. This comparison explores their innovation strategies and market positions to help you decide which company offers the most compelling investment opportunity in 2026. Let’s dive into their strengths and potential.
Table of contents
Companies Overview
I will begin the comparison between Arm Holdings plc and CEVA, Inc. by providing an overview of these two companies and their main differences.
Arm Holdings plc Overview
Arm Holdings plc designs and licenses central processing unit products and related technologies for semiconductor companies and original equipment manufacturers. Its portfolio includes microprocessors, graphics processing units, and system IPs used across automotive, computing infrastructure, consumer technologies, and IoT markets. Headquartered in Cambridge, UK, Arm operates globally and is a subsidiary of Kronos II LLC, with a market cap of approximately 111B USD.
CEVA, Inc. Overview
CEVA, Inc. licenses wireless connectivity and smart sensing technologies, including digital signal processors, AI processors, and wireless platforms to semiconductor and OEM companies worldwide. Its technologies support applications in 5G, imaging, audio, sensor fusion, and IoT. Based in Rockville, Maryland, CEVA has a market cap near 536M USD and serves diverse sectors such as mobile, automotive, robotics, and aerospace with a workforce of about 406 employees.
Key similarities and differences
Both Arm and CEVA operate in the semiconductor industry, focusing on licensing intellectual property and technology solutions to OEMs and chip manufacturers. Arm primarily offers CPU architectures and system IPs, whereas CEVA specializes in DSPs, AI processors, and wireless connectivity platforms. Arm is significantly larger in market capitalization and employee count, reflecting its broader global reach and product portfolio compared to CEVA’s more niche technological focus.
Income Statement Comparison
The table below presents a side-by-side comparison of key income statement metrics for Arm Holdings plc American Depositary Shares and CEVA, Inc. for their most recent fiscal years.
| Metric | Arm Holdings plc American Depositary Shares | CEVA, Inc. |
|---|---|---|
| Market Cap | 111B | 536M |
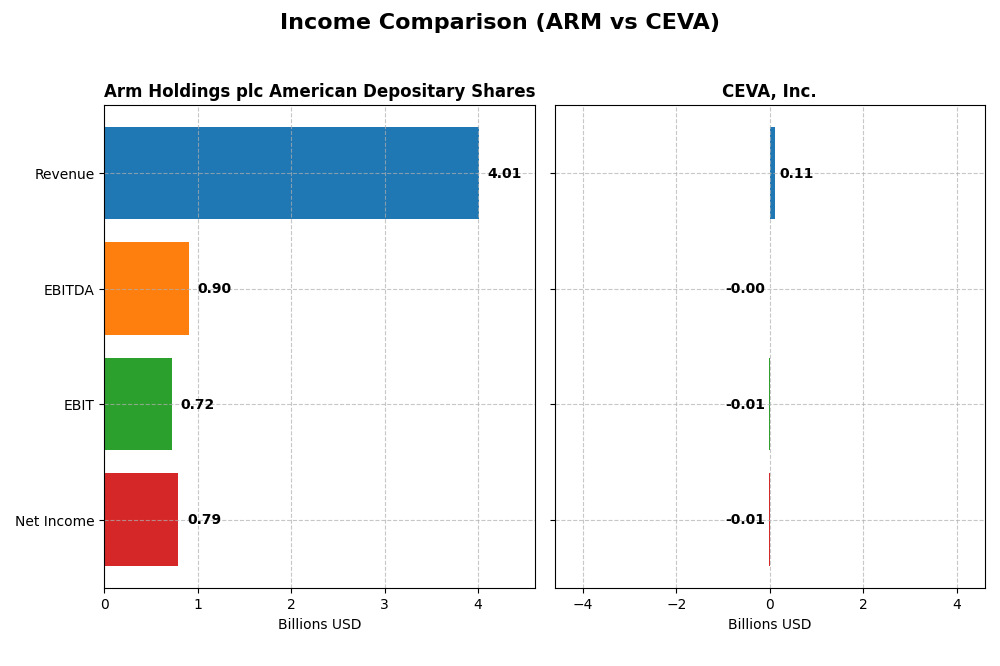
| Revenue | 4.01B | 107M |
| EBITDA | 903M | -3.41M |
| EBIT | 720M | -7.55M |
| Net Income | 792M | -8.79M |
| EPS | 0.75 | -0.37 |
| Fiscal Year | 2025 | 2024 |
Income Statement Interpretations
Arm Holdings plc American Depositary Shares
Arm Holdings plc exhibited strong revenue growth from $2.03B in 2021 to $4.01B in 2025, nearly doubling over five years. Net income similarly rose from $388M to $792M, with gross margins consistently high around 95%. The latest fiscal year showed a 24% revenue increase and a significant 109% net margin improvement, reflecting robust operational efficiency and profitable scaling.
CEVA, Inc.
CEVA’s revenue increased moderately from $100M in 2020 to $107M in 2024. However, net income remained negative in recent years, with a slight improvement to a loss of $8.8M in 2024 compared to deeper losses earlier. Gross margins stayed favorable near 88%, but EBIT and net margins were negative, indicating persistent profitability challenges despite recent operational progress and a 10% revenue growth last year.
Which one has the stronger fundamentals?
Arm Holdings demonstrates stronger fundamentals with sustained revenue and net income growth, favorable margins, and improving profitability metrics. CEVA shows some revenue growth but struggles with consistent losses and unfavorable EBIT and net margins. Arm’s scale, margin stability, and significant earnings growth contrast with CEVA’s smaller size and ongoing net losses, indicating a more solid income statement foundation for Arm.
Financial Ratios Comparison
Below is a comparison of key financial ratios for Arm Holdings plc American Depositary Shares (ARM) and CEVA, Inc. based on their most recent fiscal year data.
| Ratios | ARM (2025 FY) | CEVA (2024 FY) |
|---|---|---|
| ROE | 11.6% | -3.3% |
| ROIC | 10.3% | -2.7% |
| P/E | 142 | -85 |
| P/B | 16.4 | 2.79 |
| Current Ratio | 5.20 | 7.09 |
| Quick Ratio | 5.20 | 7.09 |
| D/E (Debt-to-Equity) | 0.052 | 0.021 |
| Debt-to-Assets | 4.0% | 1.8% |
| Interest Coverage | 0 | 0 |
| Asset Turnover | 0.45 | 0.35 |
| Fixed Asset Turnover | 5.61 | 8.43 |
| Payout ratio | 0 | 0 |
| Dividend yield | 0% | 0% |
Interpretation of the Ratios
Arm Holdings plc American Depositary Shares
Arm Holdings shows a mixed ratio profile with strong net margin at 19.77% but faces challenges with high valuation multiples such as a PE of 141.58 and PB of 16.4, which are unfavorable. The company’s current ratio is high at 5.2 but marked as unfavorable, suggesting possible inefficiency in asset usage. Arm does not pay dividends, consistent with its focus on growth and reinvestment, avoiding shareholder payouts.
CEVA, Inc.
CEVA displays predominantly unfavorable ratios, including a negative net margin of -8.22% and negative returns on equity and invested capital. While its PE is considered favorable due to its negative value, other metrics like interest coverage at zero highlight financial stress. CEVA does not pay dividends, likely due to negative earnings and a strategy emphasizing R&D and growth investments rather than shareholder distributions.
Which one has the best ratios?
Arm Holdings has a slightly unfavorable overall ratio assessment but maintains better profitability and financial stability compared to CEVA, whose ratios are more consistently unfavorable, reflecting ongoing operational and financial challenges. Arm’s stronger returns and lower leverage contrast with CEVA’s negative profitability and weaker coverage ratios.
Strategic Positioning
This section compares the strategic positioning of Arm Holdings and CEVA, including market position, key segments, and exposure to technological disruption:
Arm Holdings plc American Depositary Shares
- Large market cap of 111B USD facing high beta, indicating significant competitive pressure in semiconductors.
- Key segments include licensing and royalties from microprocessors, GPUs, and system IP across automotive, computing, consumer tech, and IoT markets.
- Exposure to technological disruption through continuous innovation in semiconductor IP licensing for diverse industries globally.
CEVA, Inc.
- Smaller market cap of 536M USD with moderate beta, operating under less volatile competitive pressure.
- Focused on licensing wireless connectivity and smart sensing technologies, including DSPs, AI processors, and platforms for 5G and IoT.
- Faces disruption risks in wireless and sensing tech but targets niche DSP and AI processor markets for mobile and IoT devices.
Arm Holdings plc American Depositary Shares vs CEVA, Inc. Positioning
Arm’s strategy is diversified across multiple semiconductor IP segments and global markets, providing scale advantages but facing fierce competition. CEVA concentrates on wireless connectivity and smart sensing IP with a smaller scale, offering specialization but also vulnerability to narrower market shifts.
Which has the best competitive advantage?
Both companies show unfavorable MOAT evaluations, indicating they are shedding value. Arm has stable profitability but destroys value, while CEVA’s declining ROIC shows worsening value destruction, suggesting neither holds a strong competitive advantage currently.
Stock Comparison
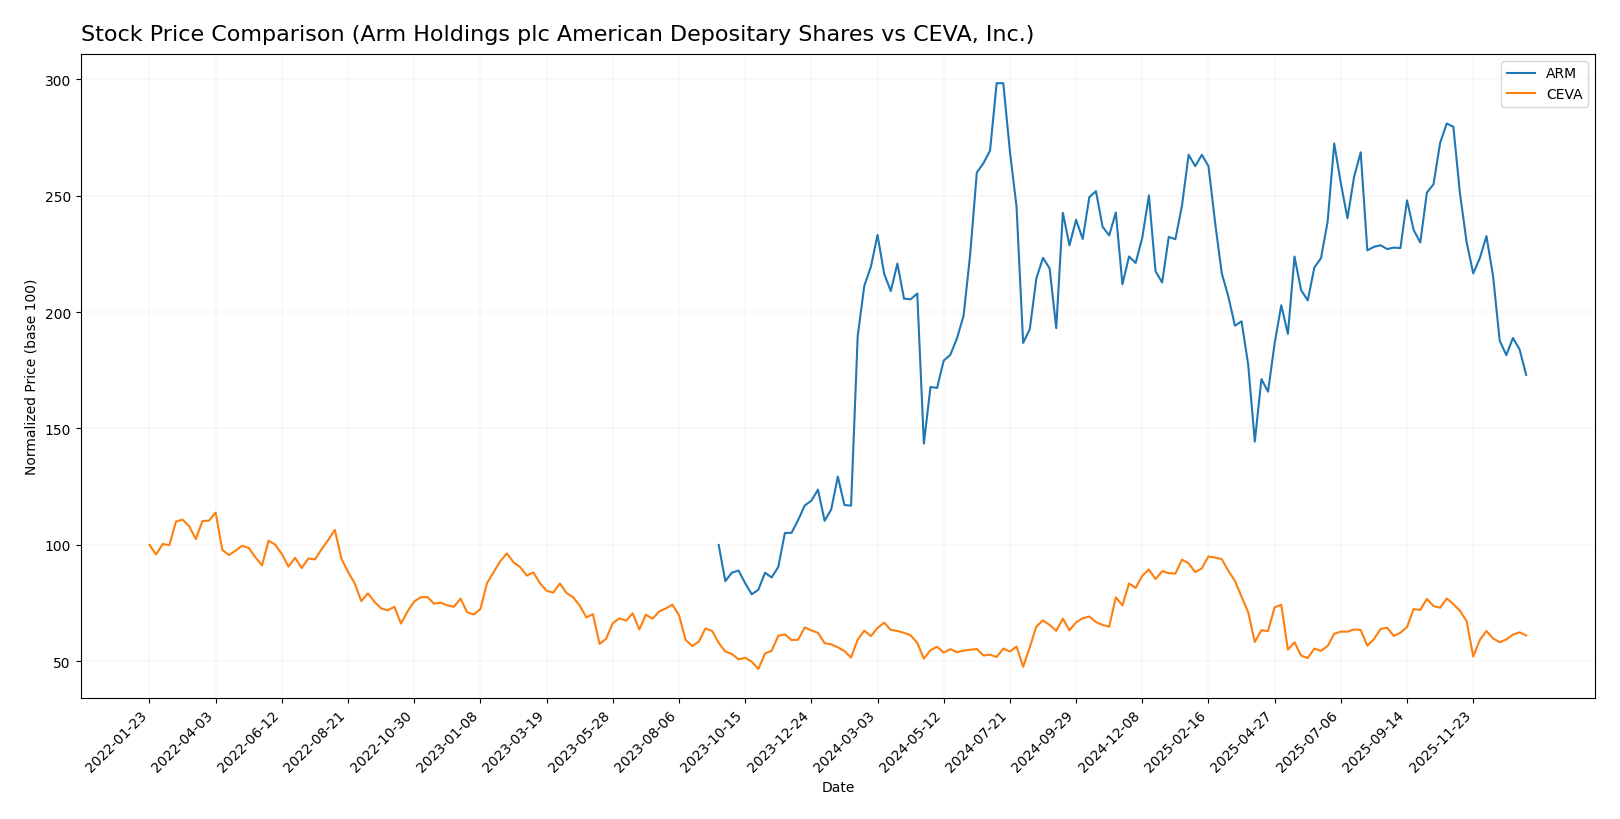
The stock price movements of Arm Holdings plc American Depositary Shares (ARM) and CEVA, Inc. over the past year show contrasting trends, with ARM experiencing a significant decline and CEVA maintaining relative stability despite recent weakness.
Trend Analysis
Arm Holdings plc’s stock revealed a bearish trend over the past 12 months with a -21.17% price change and decelerating downward momentum. The price ranged from a high of 181.19 to a low of 87.19, with notable volatility at a standard deviation of 19.31.
CEVA, Inc.’s stock showed a slight bullish trend with a 0.45% price increase over the same period, though momentum decelerated. Price ranged from 17.39 to 34.67, exhibiting lower volatility, with a standard deviation of 4.4.
Comparing both, CEVA delivered the highest market performance with a marginal positive gain, whereas ARM experienced a marked decline, reflecting contrasting investor sentiment and market dynamics.
Target Prices
Analysts present a mixed but optimistic target consensus for Arm Holdings plc and CEVA, Inc.
| Company | Target High | Target Low | Consensus |
|---|---|---|---|
| Arm Holdings plc | 210 | 120 | 166 |
| CEVA, Inc. | 28 | 28 | 28 |
Arm Holdings’ consensus target of 166 USD suggests substantial upside from the current 105.11 USD price, reflecting confidence in its semiconductor licensing business. CEVA’s single target price at 28 USD also indicates potential growth from the current 22.3 USD trading level, albeit with less analyst coverage.
Analyst Opinions Comparison
This section compares analysts’ ratings and grades for Arm Holdings plc American Depositary Shares (ARM) and CEVA, Inc. (CEVA):
Rating Comparison
ARM Rating
- Rating: B, indicating a very favorable overall assessment.
- Discounted Cash Flow Score: 3, moderate indication of valuation reliability.
- ROE Score: 3, moderate efficiency in generating profit from equity.
- ROA Score: 4, favorable asset utilization efficiency.
- Debt To Equity Score: 4, favorable financial risk profile.
- Overall Score: 3, moderate overall financial standing.
CEVA Rating
- Rating: C+, also considered very favorable but lower than ARM’s rating.
- Discounted Cash Flow Score: 3, showing moderate valuation reliability as well.
- ROE Score: 1, very unfavorable, indicating low profitability from equity.
- ROA Score: 1, very unfavorable, showing weak use of assets to generate earnings.
- Debt To Equity Score: 4, favorable and similar strong balance sheet assessment.
- Overall Score: 2, moderate but lower financial standing compared to ARM.
Which one is the best rated?
Based strictly on the provided data, ARM holds a higher rating (“B”) and generally stronger scores in return on equity and assets compared to CEVA’s lower rating (“C+”) and weaker profitability metrics. Both have favorable debt-to-equity scores, but ARM’s overall financial standing scores better.
Scores Comparison
Here is a comparison of the Altman Z-Score and Piotroski Score for Arm Holdings and CEVA, based on their financial strength indicators:
Arm Scores
- Altman Z-Score: 32.4, indicating a safe zone and very low bankruptcy risk.
- Piotroski Score: 7, classified as strong financial health and value.
CEVA Scores
- Altman Z-Score: 10.0, also in the safe zone with low bankruptcy risk.
- Piotroski Score: 4, reflecting average financial strength and value.
Which company has the best scores?
Arm Holdings exhibits both a higher Altman Z-Score and a stronger Piotroski Score compared to CEVA, indicating better overall financial stability and investment quality based on these metrics.
Grades Comparison
Here is a comparison of recent reliable grades assigned by recognized financial institutions for both companies:
Arm Holdings plc American Depositary Shares Grades
The following table summarizes recent grade actions by major grading companies for Arm Holdings plc:
| Grading Company | Action | New Grade | Date |
|---|---|---|---|
| B of A Securities | Downgrade | Neutral | 2026-01-13 |
| B of A Securities | Maintain | Buy | 2025-12-16 |
| Goldman Sachs | Downgrade | Sell | 2025-12-15 |
| Loop Capital | Maintain | Buy | 2025-11-12 |
| TD Cowen | Maintain | Buy | 2025-11-06 |
| Rosenblatt | Maintain | Buy | 2025-11-06 |
| Wells Fargo | Maintain | Overweight | 2025-11-06 |
| Mizuho | Maintain | Outperform | 2025-11-06 |
| Barclays | Maintain | Overweight | 2025-11-06 |
| UBS | Maintain | Buy | 2025-11-06 |
Overall, Arm Holdings has mostly maintained a Buy or Overweight stance, with some recent downgrades to Neutral and Sell, indicating mixed sentiment.
CEVA, Inc. Grades
The following table presents recent grade actions by major grading companies for CEVA, Inc.:
| Grading Company | Action | New Grade | Date |
|---|---|---|---|
| Barclays | Maintain | Overweight | 2025-11-12 |
| Rosenblatt | Maintain | Buy | 2025-11-11 |
| Rosenblatt | Maintain | Buy | 2025-08-14 |
| Oppenheimer | Maintain | Outperform | 2025-05-09 |
| Rosenblatt | Maintain | Buy | 2025-05-08 |
| Barclays | Maintain | Overweight | 2025-05-08 |
| Rosenblatt | Maintain | Buy | 2025-04-23 |
| Barclays | Maintain | Overweight | 2025-02-14 |
| Rosenblatt | Maintain | Buy | 2025-02-14 |
| Rosenblatt | Maintain | Buy | 2025-02-11 |
CEVA shows consistent Buy and Overweight grades with no recent downgrades, reflecting stable positive analyst sentiment.
Which company has the best grades?
CEVA, Inc. has received consistently positive grades without downgrades, suggesting stronger analyst confidence compared to Arm Holdings, which shows some recent downgrades. This may imply differing risk perceptions and growth expectations for investors evaluating these stocks.
Strengths and Weaknesses
Below is a comparison of the key strengths and weaknesses of Arm Holdings plc (ARM) and CEVA, Inc., based on the most recent financial and operational data.
| Criterion | Arm Holdings plc (ARM) | CEVA, Inc. |
|---|---|---|
| Diversification | Moderate: Revenue mainly from licensing and royalties with growth in both segments | Limited: Focused on connectivity and smart sensing products, less diversified |
| Profitability | Strong net margin at 19.77%, but ROIC below WACC indicates value destruction | Negative profitability with net margin -8.22% and declining ROIC |
| Innovation | Solid innovation evident in high fixed asset turnover (5.61) and royalty growth | Innovation moderate with favorable fixed asset turnover, but declining ROIC and profitability |
| Global presence | Wide global presence supported by licensing model and large market footprint | Smaller global footprint, niche market presence in specialized connectivity and sensing |
| Market Share | Significant market share in semiconductor IP licensing | Smaller market share, focused on specific DSP and connectivity niches |
Key takeaways: ARM shows strong profitability and innovative capacity but struggles with efficient capital use and value creation. CEVA faces declining profitability and value destruction, with limited diversification and smaller market presence, increasing investment risk.
Risk Analysis
Below is a comparative table highlighting key risks for Arm Holdings plc (ARM) and CEVA, Inc. based on the most recent data from 2025 and 2024 respectively:
| Metric | Arm Holdings plc (ARM) | CEVA, Inc. |
|---|---|---|
| Market Risk | High (Beta 4.36) | Moderate (Beta 1.44) |
| Debt level | Very Low (D/E 0.05) | Very Low (D/E 0.02) |
| Regulatory Risk | Moderate (Global ops) | Moderate (US based) |
| Operational Risk | Moderate (Large scale) | Moderate (Smaller scale) |
| Environmental Risk | Moderate (Industry norms) | Moderate (Industry norms) |
| Geopolitical Risk | High (Exposure to China, Taiwan) | Low (Primarily US) |
In synthesis, ARM faces the most impactful risks in market volatility due to a very high beta and geopolitical exposure across Asia, which is sensitive to trade tensions. CEVA’s risks are more operational and financial, with weaker profitability metrics and moderate market risk. ARM’s strong balance sheet lowers debt risk, but valuation metrics suggest caution. CEVA shows financial fragility with negative margins and moderate leverage but benefits from lower geopolitical risk. Investors should weigh ARM’s growth potential against its market and geopolitical vulnerabilities, while CEVA requires careful risk management due to operational and profitability concerns.
Which Stock to Choose?
Arm Holdings plc American Depositary Shares (ARM) shows a favorable income evolution with 23.94% revenue growth in the last year and a strong net margin of 19.77%. Its financial ratios are slightly unfavorable globally, with a moderate return on equity (11.58%) and low debt (debt-to-equity 0.05). Profitability is stable but the company is shedding value as ROIC is below WACC. ARM holds a very favorable rating overall with a B grade.
CEVA, Inc. exhibits a mixed income profile: despite 9.77% revenue growth last year, it reports negative net margin (-8.22%) and unfavorable profitability ratios, indicating losses and value destruction. Financial ratios are globally unfavorable, with weak returns and moderate debt levels. CEVA’s rating is also very favorable at C+, supported by a safe zone Altman Z-Score but an average Piotroski Score.
Investors focused on stability and consistent profitability might find ARM’s stronger income growth and better rating more aligned with their profile, while those with tolerance for volatility and seeking potential turnaround opportunities could interpret CEVA’s current valuation and financial position as indicative of riskier, speculative exposure.
Disclaimer: Investment carries a risk of loss of initial capital. The past performance is not a reliable indicator of future results. Be sure to understand risks before making an investment decision.
Go Further
I encourage you to read the complete analyses of Arm Holdings plc American Depositary Shares and CEVA, Inc. to enhance your investment decisions: