In the fast-evolving semiconductor industry, Broadcom Inc. and Arm Holdings plc stand out as influential players shaping technology’s future. Broadcom excels in diverse semiconductor and infrastructure software solutions, while Arm focuses on CPU architecture and licensing innovation. Their overlapping markets and distinct strategies make this comparison essential. Join me as we analyze these companies to identify which presents the most compelling investment opportunity in 2026.

Table of contents
Companies Overview
I will begin the comparison between Broadcom and Arm Holdings by providing an overview of these two companies and their main differences.
Broadcom Overview
Broadcom Inc. is a global technology company headquartered in Palo Alto, California, specializing in semiconductor and infrastructure software solutions. It operates through four segments: Wired Infrastructure, Wireless Communications, Enterprise Storage, and Industrial & Other. Broadcom’s products serve diverse applications, including data center networking, smartphones, telecommunication equipment, and factory automation, employing about 37,000 full-time staff.
Arm Holdings Overview
Arm Holdings plc, headquartered in Cambridge, UK, focuses on architecting, developing, and licensing CPU products and related technologies. It provides microprocessors, system IPs, GPUs, and software for semiconductor companies and OEMs in markets like automotive, computing infrastructure, consumer technologies, and IoT. The company employs approximately 8,330 people and operates internationally as a subsidiary of Kronos II LLC.
Key similarities and differences
Both Broadcom and Arm operate in the semiconductor industry and provide technology solutions essential to various electronic products. Broadcom focuses on manufacturing and supplying semiconductor devices and infrastructure software, while Arm primarily develops and licenses intellectual property for CPUs and related technologies. Broadcom has a broader product portfolio and larger workforce, whereas Arm concentrates on design and licensing rather than direct manufacturing.
Income Statement Comparison
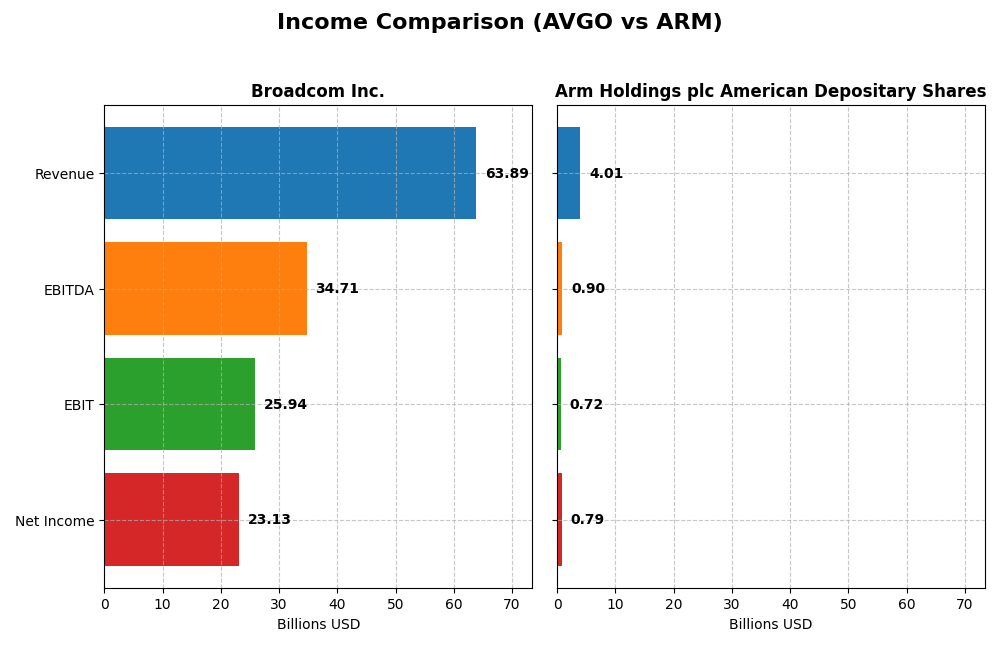
The table below compares key income statement metrics for the fiscal year 2025 of Broadcom Inc. and Arm Holdings plc American Depositary Shares, providing a snapshot of their financial performance.
| Metric | Broadcom Inc. (AVGO) | Arm Holdings plc (ARM) |
|---|---|---|
| Market Cap | 1.6T | 111B |
| Revenue | 63.9B | 4.0B |
| EBITDA | 34.7B | 903M |
| EBIT | 25.9B | 720M |
| Net Income | 23.1B | 792M |
| EPS | 4.91 | 0.75 |
| Fiscal Year | 2025 | 2025 |
Income Statement Interpretations
Broadcom Inc.
Broadcom’s revenue rose significantly from $27.45B in 2021 to $63.89B in 2025, showing a strong upward trend. Net income also surged from $6.44B to $23.13B over the same period. Margins improved notably, with gross margin reaching 67.77% and net margin 36.2% in 2025. The latest year showed marked growth acceleration, especially in EBIT and net income margins.
Arm Holdings plc American Depositary Shares
Arm’s revenue increased steadily from $2.03B in 2021 to $4.01B in 2025, nearly doubling over five years. Net income followed a similar trajectory, growing from $388M to $792M. The company maintains a high gross margin of 94.86%, though its net margin was lower at 19.77% in 2025. The latest fiscal year saw strong EBIT and net margin improvements, reflecting operational gains.
Which one has the stronger fundamentals?
Both companies exhibit favorable income statement trends with solid revenue and net income growth. Broadcom boasts higher absolute earnings and stronger net margins, while Arm excels in gross margin and shows rapid EBIT growth. Broadcom’s scale and margin expansion contrast with Arm’s high profitability ratios but lower net income, indicating different strengths in fundamentals.
Financial Ratios Comparison
Below is a comparison of key financial ratios for Broadcom Inc. (AVGO) and Arm Holdings plc American Depositary Shares (ARM) for their most recent fiscal years.
| Ratios | Broadcom Inc. (AVGO) 2025 | Arm Holdings plc (ARM) 2025 |
|---|---|---|
| ROE | 28.4% | 11.6% |
| ROIC | 16.4% | 10.3% |
| P/E | 73.9 | 141.6 |
| P/B | 21.0 | 16.4 |
| Current Ratio | 1.71 | 5.20 |
| Quick Ratio | 1.58 | 5.20 |
| D/E (Debt-to-Equity) | 0.80 | 0.05 |
| Debt-to-Assets | 38.1% | 4.0% |
| Interest Coverage | 7.94 | 0 |
| Asset Turnover | 0.37 | 0.45 |
| Fixed Asset Turnover | 25.3 | 5.61 |
| Payout Ratio | 48.2% | 0% |
| Dividend Yield | 0.65% | 0% |
Interpretation of the Ratios
Broadcom Inc.
Broadcom shows strong profitability with a net margin of 36.2% and a return on equity of 28.45%, both favorable. Its liquidity ratios are solid, though valuation multiples like PE at 73.87 and PB at 21.01 appear stretched. The company pays dividends with a low yield of 0.65%, indicating cautious distribution relative to earnings and potential risks in payout sustainability.
Arm Holdings plc American Depositary Shares
Arm’s net margin is favorable at 19.77%, but return on invested capital at 10.28% is unfavorable, and its weighted average cost of capital at 24.25% signals high capital costs. The firm does not pay dividends, likely prioritizing reinvestment and growth, supported by very low debt and strong interest coverage, despite a high PE of 141.58 and an unfavorable current ratio of 5.2.
Which one has the best ratios?
Broadcom presents a more balanced profile with half its ratios favorable and a slightly favorable global opinion, while Arm has a higher proportion of unfavorable ratios and a slightly unfavorable global view. Broadcom’s profitability and dividend aspects contrast with Arm’s growth and reinvestment focus, reflecting different financial strengths and challenges.
Strategic Positioning
This section compares the strategic positioning of Broadcom Inc. and Arm Holdings plc, including market position, key segments, and exposure to technological disruption:
Broadcom Inc.
- Large market cap of 1.6T USD with moderate beta 1.22, facing competition in semiconductors.
- Operates through four segments: Wired Infrastructure, Wireless Communications, Enterprise Storage, and Industrial & Other.
- Exposure includes semiconductor design and infrastructure software, with products integrating firmware and hardware sensors.
Arm Holdings plc
- Smaller market cap of 111B USD with high beta 4.36, competing in semiconductor IP licensing.
- Focuses on CPU architecture licensing, microprocessors, and related IP across automotive, computing, and IoT markets.
- Exposure centers on semiconductor IP licensing and royalties, potentially sensitive to shifts in chip design technologies.
Broadcom Inc. vs Arm Holdings plc Positioning
Broadcom’s diversified segments across infrastructure software and semiconductor solutions contrast with Arm’s concentrated focus on CPU architecture and IP licensing. Broadcom benefits from multiple revenue streams, while Arm relies heavily on licensing and royalties, influencing risk and growth dynamics.
Which has the best competitive advantage?
Broadcom shows a very favorable MOAT with growing ROIC above WACC, indicating durable competitive advantage and value creation. Arm’s unfavorable MOAT with ROIC below WACC reflects value destruction, signaling weaker competitive positioning.
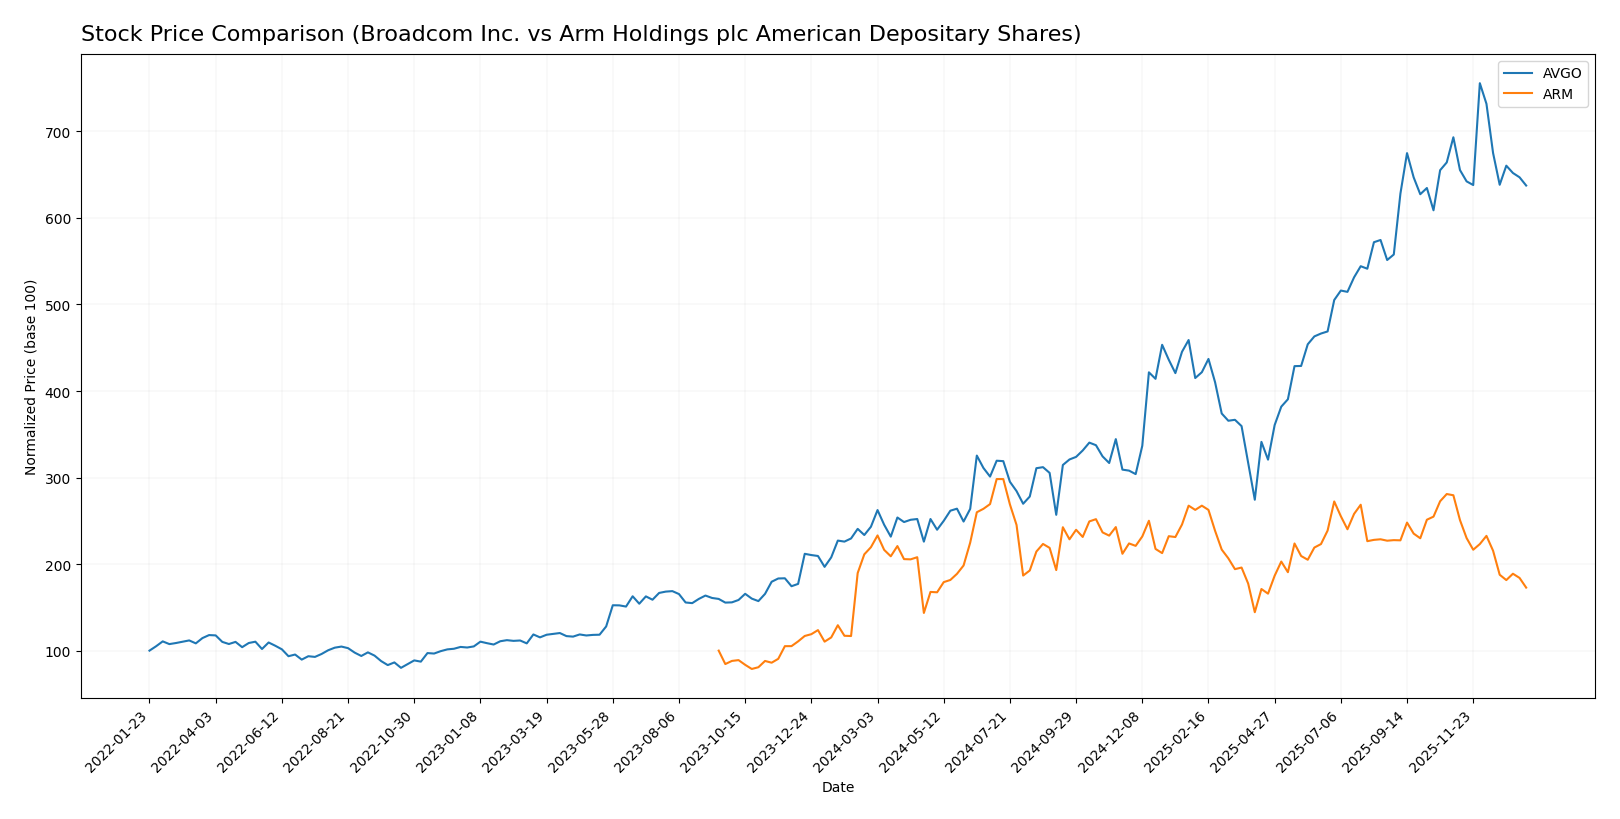
Stock Comparison
The stock price movements over the past year reveal a strong bullish trend for Broadcom Inc., contrasted by a bearish trajectory for Arm Holdings plc, with notable volatility and deceleration in both cases.
Trend Analysis
Broadcom Inc. (AVGO) showed a significant bullish trend over the past 12 months with a price increase of 162.18%, although the trend is decelerating. The stock experienced a high of 402.96 and a low of 120.47, with notable volatility (std deviation 78.56).
Arm Holdings plc (ARM) displayed a bearish trend over the past 12 months, with a price decrease of 21.26% and deceleration in trend momentum. The stock’s price ranged between 87.19 and 181.19, with moderate volatility (std deviation 19.31).
Comparing both stocks, Broadcom Inc. delivered the highest market performance with a strong bullish gain versus Arm Holdings’ bearish decline over the analyzed period.
Target Prices
The current analyst consensus for target prices suggests moderate upside potential for both Broadcom Inc. and Arm Holdings plc.
| Company | Target High | Target Low | Consensus |
|---|---|---|---|
| Broadcom Inc. | 510 | 370 | 454.8 |
| Arm Holdings plc American Depositary Shares | 210 | 120 | 166 |
Analysts expect Broadcom’s stock to trade significantly above its current price of $339.89, while Arm Holdings shows a consensus target price well above its current $104.99, indicating bullish sentiment for both.
Analyst Opinions Comparison
This section compares analysts’ ratings and grades for Broadcom Inc. and Arm Holdings plc American Depositary Shares:
Rating Comparison
Broadcom Inc. Rating
- Rating: B, assessed as Very Favorable by analysts.
- Discounted Cash Flow Score: 3, indicating a Moderate valuation outlook.
- ROE Score: 5, considered Very Favorable for profitability from equity.
- ROA Score: 5, rated Very Favorable for asset utilization efficiency.
- Debt To Equity Score: 1, marked Very Unfavorable due to high financial risk.
- Overall Score: 3, a Moderate overall financial standing.
Arm Holdings plc American Depositary Shares Rating
- Rating: B, also rated Very Favorable by analysts.
- Discounted Cash Flow Score: 3, reflecting a Moderate valuation outlook.
- ROE Score: 3, seen as Moderate in generating profit from shareholders’ equity.
- ROA Score: 4, regarded as Favorable for asset use effectiveness.
- Debt To Equity Score: 4, considered Favorable reflecting lower financial risk.
- Overall Score: 3, also Moderate in overall financial health.
Which one is the best rated?
Both Broadcom Inc. and Arm Holdings share the same overall rating of B and an identical overall score of 3, indicating moderate financial standing. Broadcom excels in profitability metrics but lags in financial stability, while Arm shows a stronger balance sheet but lower return on equity.
Scores Comparison
Here is a comparison of the Altman Z-Score and Piotroski Score for both companies:
Broadcom Inc. Scores
- Altman Z-Score: 12.13, indicating a safe zone with low bankruptcy risk.
- Piotroski Score: 8, classified as very strong financial health.
Arm Holdings plc Scores
- Altman Z-Score: 32.43, indicating a safe zone with very low bankruptcy risk.
- Piotroski Score: 7, classified as strong financial health.
Which company has the best scores?
Arm Holdings has a higher Altman Z-Score than Broadcom, suggesting lower bankruptcy risk, while Broadcom shows a slightly stronger Piotroski Score. Both companies are financially robust based on these metrics.
Grades Comparison
Here is a detailed comparison of the latest grades assigned to Broadcom Inc. and Arm Holdings plc American Depositary Shares by recognized grading companies:
Broadcom Inc. Grades
The following table summarizes the recent grades from several investment firms for Broadcom Inc.:
| Grading Company | Action | New Grade | Date |
|---|---|---|---|
| Mizuho | Maintain | Outperform | 2026-01-09 |
| Truist Securities | Maintain | Buy | 2025-12-19 |
| UBS | Maintain | Buy | 2025-12-15 |
| Benchmark | Maintain | Buy | 2025-12-12 |
| Rosenblatt | Maintain | Buy | 2025-12-12 |
| Piper Sandler | Maintain | Overweight | 2025-12-12 |
| TD Cowen | Maintain | Buy | 2025-12-12 |
| B of A Securities | Maintain | Buy | 2025-12-12 |
| JP Morgan | Maintain | Overweight | 2025-12-12 |
| Mizuho | Maintain | Outperform | 2025-12-12 |
Broadcom maintains a strong buy and outperform consensus, with multiple firms consistently assigning buy or better grades.
Arm Holdings plc American Depositary Shares Grades
The table below presents recent grading data for Arm Holdings:
| Grading Company | Action | New Grade | Date |
|---|---|---|---|
| B of A Securities | Downgrade | Neutral | 2026-01-13 |
| B of A Securities | Maintain | Buy | 2025-12-16 |
| Goldman Sachs | Downgrade | Sell | 2025-12-15 |
| Loop Capital | Maintain | Buy | 2025-11-12 |
| Rosenblatt | Maintain | Buy | 2025-11-06 |
| TD Cowen | Maintain | Buy | 2025-11-06 |
| Wells Fargo | Maintain | Overweight | 2025-11-06 |
| Mizuho | Maintain | Outperform | 2025-11-06 |
| Barclays | Maintain | Overweight | 2025-11-06 |
| UBS | Maintain | Buy | 2025-11-06 |
Arm shows a more mixed pattern, including downgrades to neutral and sell from B of A Securities and Goldman Sachs, but also retains several buy and overweight ratings.
Which company has the best grades?
Broadcom Inc. has received more consistent and higher grades, predominantly buy and outperform ratings, compared to Arm Holdings which has experienced recent downgrades and a wider rating spread. This suggests Broadcom currently enjoys stronger analyst confidence, potentially implying lower perceived risk and greater investor appeal in the short term.
Strengths and Weaknesses
The table below compares key strengths and weaknesses of Broadcom Inc. (AVGO) and Arm Holdings plc (ARM) based on recent financial performance, innovation, market presence, and profitability.
| Criterion | Broadcom Inc. (AVGO) | Arm Holdings plc (ARM) |
|---|---|---|
| Diversification | Strong diversification with Infrastructure Software ($27B) and Semiconductor Solutions ($37B) segments | Limited diversification, primarily License and Royalty revenue streams (~$4B total) |
| Profitability | High net margin (36.2%), ROIC 16.36%, ROE 28.45%, creating value with growing ROIC | Moderate net margin (19.77%), ROIC 10.28%, but ROIC below WACC, shedding value |
| Innovation | Demonstrates durable competitive advantage, strong innovation in semiconductor solutions | Innovation constrained by licensing model; neutral ROIC trend indicates stable but limited growth |
| Global presence | Extensive global footprint in semiconductors and infrastructure software markets | Global licensing reach but less direct market control and presence |
| Market Share | Significant market share in semiconductor industry with growing revenues | Strong position in processor IP licensing but faces competitive pressure |
Key takeaways: Broadcom shows robust profitability, diversified revenue streams, and a durable moat with strong value creation. Arm, while a recognized innovator in chip design licensing, faces profitability challenges and less diversification, posing higher investment risks.
Risk Analysis
Below is a summary table outlining key risks for Broadcom Inc. (AVGO) and Arm Holdings plc (ARM) as of 2026:
| Metric | Broadcom Inc. (AVGO) | Arm Holdings plc (ARM) |
|---|---|---|
| Market Risk | Moderate (Beta 1.22) | High (Beta 4.36) |
| Debt level | Moderate (D/E 0.8, 38% assets) | Low (D/E 0.05, 4% assets) |
| Regulatory Risk | Moderate (US tech regulations) | Elevated (UK & global IP laws) |
| Operational Risk | Moderate (complex supply chain) | Moderate (dependency on licensors) |
| Environmental Risk | Moderate (semiconductor industry impact) | Moderate (energy use & emissions) |
| Geopolitical Risk | Moderate (US-China tensions) | High (exposure to China, Taiwan) |
The most impactful risks are ARM’s high market volatility (beta 4.36) and geopolitical exposure due to its operations in sensitive regions, while Broadcom faces moderate debt and US regulatory risks. ARM’s low debt contrasts with its high valuation risks, which could influence investment decisions. Both companies remain in safe financial zones but require monitoring of market and geopolitical shifts.
Which Stock to Choose?
Broadcom Inc. (AVGO) shows strong income growth with a 23.87% revenue increase in 2025 and favorable profitability ratios, including a 36.2% net margin and 28.45% ROE. Its debt level is moderate, with a neutral debt-to-equity ratio, and it holds a very favorable overall rating.
Arm Holdings plc (ARM) also exhibits favorable income growth and profitability, with a 23.94% revenue increase and a 19.77% net margin in 2025. However, several financial ratios are less favorable, including a high WACC and a neutral to unfavorable ROE, while maintaining a very favorable rating but with more mixed financial stability.
Investors focused on stable value creation and durable competitive advantage might find Broadcom’s very favorable MOAT and strong financial ratios more aligned with their profile, while those with a tolerance for higher risk and interest in growth potential might consider Arm’s favorable income statement but should remain cautious given its less robust financial ratios.
Disclaimer: Investment carries a risk of loss of initial capital. The past performance is not a reliable indicator of future results. Be sure to understand risks before making an investment decision.
Go Further
I encourage you to read the complete analyses of Broadcom Inc. and Arm Holdings plc American Depositary Shares to enhance your investment decisions: