In the dynamic world of semiconductors, Arm Holdings plc and Astera Labs, Inc. stand out as key players driving innovation and shaping future technologies. Arm, with its extensive portfolio of CPU architectures, serves a broad range of markets, while Astera Labs focuses on cutting-edge connectivity solutions for cloud and AI infrastructure. This article will explore their strengths and strategies to help you decide which company holds the most promise for your investment portfolio.

Table of contents
Companies Overview
I will begin the comparison between Arm Holdings plc and Astera Labs, Inc. by providing an overview of these two companies and their main differences.
Arm Holdings plc Overview
Arm Holdings plc architects, develops, and licenses central processing unit products and related technologies for semiconductor companies and original equipment manufacturers. The company offers microprocessors, systems IP, graphics processing units, and software used across markets such as automotive, computing infrastructure, consumer technologies, and IoT. Founded in 1990 and headquartered in Cambridge, UK, Arm operates globally as a subsidiary of Kronos II LLC.
Astera Labs, Inc. Overview
Astera Labs designs, manufactures, and sells semiconductor-based connectivity solutions targeting cloud and AI infrastructure. Its Intelligent Connectivity Platform includes data, network, and memory connectivity products built on a software-defined architecture to support scalable, high-performance deployments. Incorporated in 2017, the company is based in Santa Clara, California, and focuses on advanced technology for cloud and AI markets.
Key similarities and differences
Both Arm and Astera Labs operate in the semiconductor industry and technology sector, supplying critical components for computing infrastructure. However, Arm’s business centers on licensing CPU designs and broad semiconductor IP, supporting diverse markets globally. In contrast, Astera Labs specializes in connectivity solutions for cloud and AI infrastructure, with a narrower product focus and smaller scale, reflected in their respective market caps and employee counts.
Income Statement Comparison
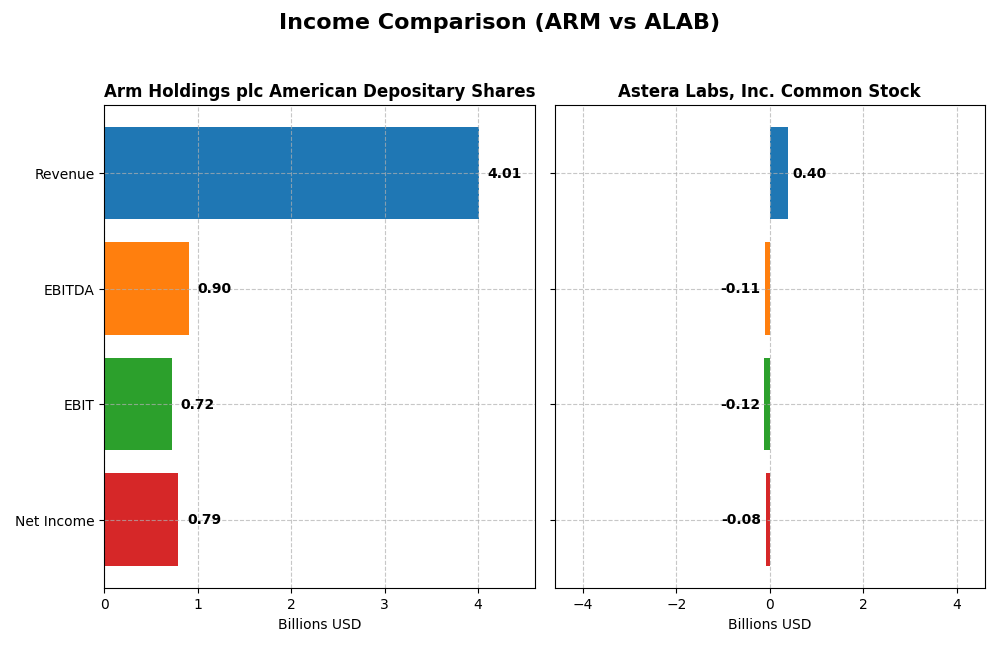
The table below presents a side-by-side comparison of key income statement metrics for Arm Holdings plc and Astera Labs, Inc. for their most recent fiscal years.
| Metric | Arm Holdings plc American Depositary Shares | Astera Labs, Inc. Common Stock |
|---|---|---|
| Market Cap | 111B | 29.5B |
| Revenue | 4.01B | 396M |
| EBITDA | 903M | -113M |
| EBIT | 720M | -116M |
| Net Income | 792M | -83.4M |
| EPS | 0.75 | -0.64 |
| Fiscal Year | 2025 | 2024 |
Income Statement Interpretations
Arm Holdings plc American Depositary Shares
Arm Holdings showed a strong upward trend in revenue and net income from 2021 to 2025, nearly doubling its revenue to $4B and net income to $792M. Margins remained robust, with a gross margin close to 95% and net margin improving to nearly 20%. The 2025 fiscal year saw substantial growth acceleration, with EBIT and net income more than doubling, reflecting improving operational efficiency.
Astera Labs, Inc. Common Stock
Astera Labs experienced significant revenue growth, rising 242% in the latest year to $396M. However, net income remained negative at -$83M, despite a slight improvement in net margin. EBIT margins were unfavorable at -29%, indicating persistent operating losses. While gross margin improved to 76%, the company continues to face challenges in translating revenue gains into profitability.
Which one has the stronger fundamentals?
Arm Holdings demonstrates stronger fundamentals with consistently favorable income statement metrics, including high gross and net margins, and solid profitability growth. Astera Labs, while showing rapid revenue expansion, struggles with negative net income and EBIT margins. The mixed performance of Astera Labs contrasts with Arm’s stable and growing profit metrics, indicating a more favorable financial position for Arm over the period analyzed.
Financial Ratios Comparison
The table below presents a side-by-side comparison of key financial ratios for Arm Holdings plc (ARM) and Astera Labs, Inc. (ALAB) based on their most recent fiscal year data.
| Ratios | Arm Holdings plc (ARM) FY 2025 | Astera Labs, Inc. (ALAB) FY 2024 |
|---|---|---|
| ROE | 11.6% | -8.6% |
| ROIC | 10.3% | -12.0% |
| P/E | 141.6 | -208.4 |
| P/B | 16.4 | 18.0 |
| Current Ratio | 5.20 | 11.7 |
| Quick Ratio | 5.20 | 11.2 |
| D/E (Debt-to-Equity) | 0.052 | 0.0013 |
| Debt-to-Assets | 4.0% | 0.12% |
| Interest Coverage | 0 | 0 |
| Asset Turnover | 0.45 | 0.38 |
| Fixed Asset Turnover | 5.61 | 11.1 |
| Payout Ratio | 0 | 0 |
| Dividend Yield | 0 | 0 |
Interpretation of the Ratios
Arm Holdings plc American Depositary Shares
Arm Holdings shows a mixed ratio profile with a strong net margin of 19.77% but unfavorable returns on invested capital (10.28%) and a high weighted average cost of capital (24.3%). Its price and book multiples are elevated, reflecting market expectations. The company maintains a low debt-to-equity ratio (0.05) and strong interest coverage. Arm does not pay dividends, likely reflecting reinvestment in its high R&D intensity.
Astera Labs, Inc. Common Stock
Astera Labs exhibits weak profitability ratios with a negative net margin (-21.05%) and return on equity (-8.65%). Despite a favorable price-to-earnings ratio, the company faces challenges with an unfavorable current ratio (11.71) and zero interest coverage. The absence of dividends aligns with its negative earnings and focus on growth through R&D and capital investment in a competitive semiconductor niche.
Which one has the best ratios?
Arm Holdings presents a more balanced ratio profile with notable strengths in profitability and capital structure, despite some valuation and liquidity concerns. Astera Labs’ ratios are predominantly unfavorable, reflecting its current financial struggles and early growth stage. Overall, Arm’s ratios are slightly more favorable compared to Astera Labs, which shows considerable risk in profitability and operational metrics.
Strategic Positioning
This section compares the strategic positioning of Arm Holdings plc and Astera Labs, Inc., focusing on market position, key segments, and exposure to technological disruption:
Arm Holdings plc American Depositary Shares
- Large market cap of 111B USD in semiconductors; faces high competitive pressure globally.
- Key segments include licensing microprocessors, IPs, and software for automotive, computing, IoT markets.
- Exposed to disruption through evolving semiconductor architectures and software-defined platforms.
Astera Labs, Inc. Common Stock
- Smaller market cap of 29.5B USD; competes in niche cloud and AI semiconductor connectivity solutions.
- Focused on product and technology service sales for cloud and AI infrastructure connectivity.
- Faces disruption risks in cloud and AI infrastructure but leverages software-defined architecture for scalability.
Arm Holdings plc vs Astera Labs, Inc. Positioning
Arm exhibits a diversified business model with broad licensing revenue streams across multiple markets, while Astera Labs concentrates on specialized connectivity products for cloud and AI. Arm’s large scale provides broad market reach; Astera’s focus offers targeted innovation but limits diversification.
Which has the best competitive advantage?
Both companies are currently shedding value with ROIC below WACC; however, Astera Labs shows improving profitability trends, while Arm maintains stable but unfavorable returns, indicating neither has a strong competitive moat at present.
Stock Comparison
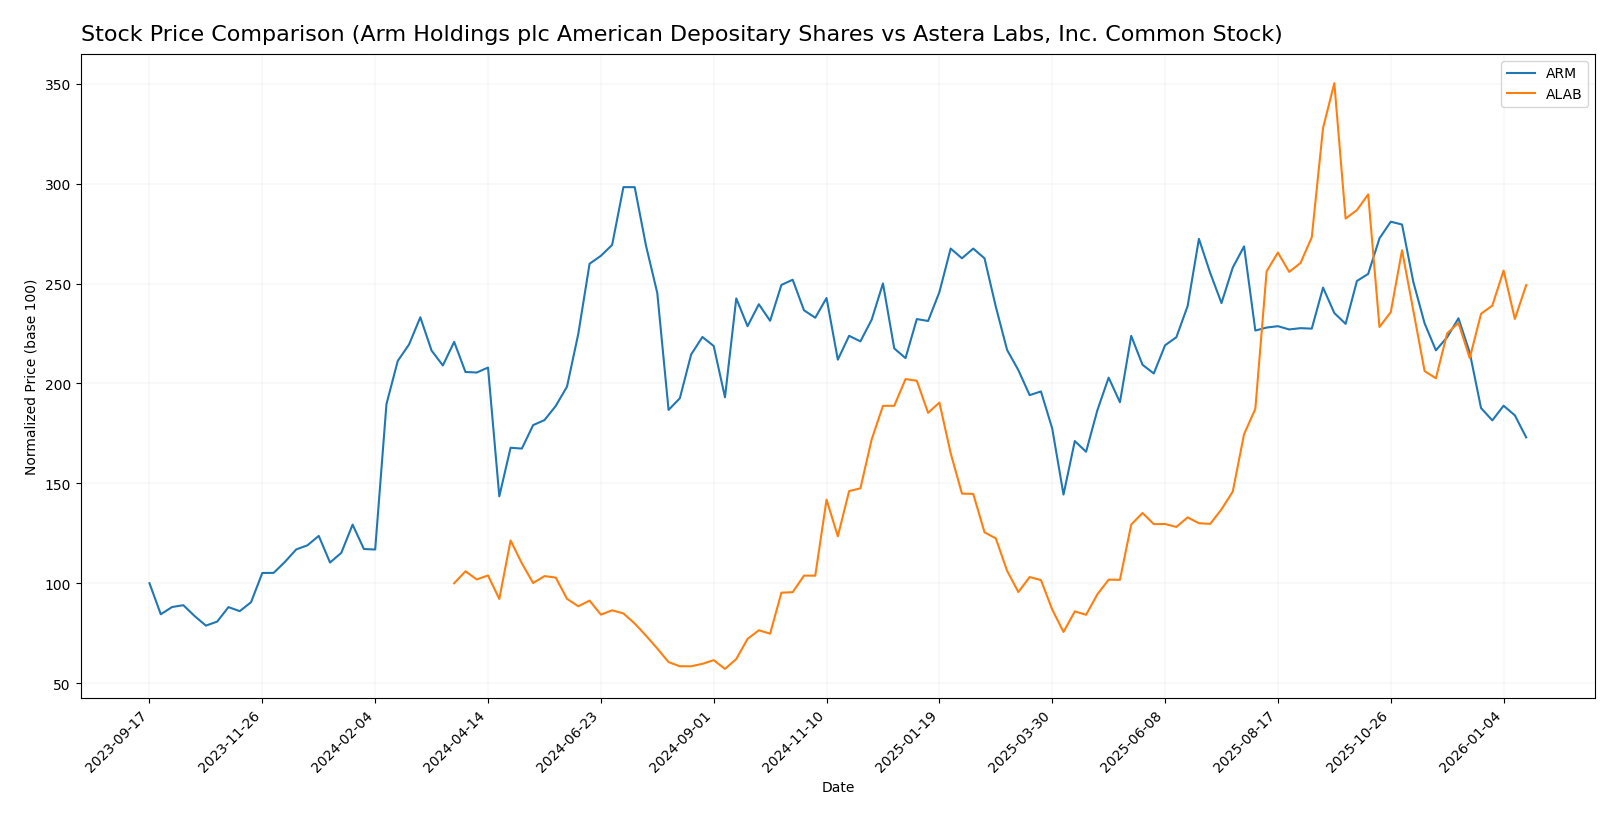
The stock price chart highlights divergent trajectories over the past 12 months, with Arm Holdings showing a significant decline while Astera Labs demonstrates strong growth, despite recent moderation in both trading volumes and price momentum.
Trend Analysis
Arm Holdings plc American Depositary Shares experienced a bearish trend over the past year, with a price decline of 21.17% and deceleration in the downtrend. The stock ranged between a high of 181.19 and a low of 87.19, with volatility reflected by a standard deviation of 19.31.
Astera Labs, Inc. Common Stock showed a bullish trend over the same period, gaining 149.21%, although the uptrend is decelerating. Price volatility is notably high with a standard deviation of 50.14, and prices fluctuated between 40.0 and 245.2.
Comparing both stocks, Astera Labs delivered the highest market performance with robust gains, whereas Arm Holdings faced a substantial decline, indicating contrasting investor sentiment and market dynamics.
Target Prices
The current analyst consensus presents optimistic target prices for both Arm Holdings plc and Astera Labs, Inc.
| Company | Target High | Target Low | Consensus |
|---|---|---|---|
| Arm Holdings plc American Depositary Shares | 210 | 120 | 166 |
| Astera Labs, Inc. Common Stock | 225 | 165 | 202.14 |
Analysts expect Arm Holdings’ price to rise substantially from its current $105.11, while Astera Labs shows a similarly bullish consensus above its present $174.45 market price.
Analyst Opinions Comparison
This section compares analysts’ ratings and grades for Arm Holdings plc American Depositary Shares (ARM) and Astera Labs, Inc. Common Stock (ALAB):
Rating Comparison
ARM Rating
- Rating: B, considered Very Favorable by analysts
- Discounted Cash Flow Score: Moderate at 3, indicating a balanced valuation outlook
- Return on Equity Score: Moderate at 3, showing average efficiency in generating shareholder profit
- Return on Assets Score: Favorable at 4, reflecting effective asset utilization
- Debt To Equity Score: Favorable at 4, signaling a relatively strong balance sheet
- Overall Score: Moderate at 3, summarizing the company’s financial standing
ALAB Rating
- Rating: B, also Very Favorable according to analyst evaluations
- Discounted Cash Flow Score: Very Unfavorable at 1, suggesting potential overvaluation concerns
- Return on Equity Score: Favorable at 4, indicating better efficiency in profit generation
- Return on Assets Score: Very Favorable at 5, demonstrating superior asset use efficiency
- Debt To Equity Score: Favorable at 4, similarly indicating sound financial risk management
- Overall Score: Moderate at 3, reflecting comparable overall financial assessment
Which one is the best rated?
Both ARM and ALAB share the same overall rating and score, labeled as Moderate and Very Favorable respectively. ALAB scores higher on ROE and ROA, while ARM has a stronger Discounted Cash Flow score, making their ratings comparable with distinct strengths.
Scores Comparison
Here is a comparison of the Altman Z-Score and Piotroski Score for Arm Holdings and Astera Labs:
Arm Scores
- Altman Z-Score: 32.43, indicating a safe zone for bankruptcy risk.
- Piotroski Score: 7, categorized as strong financial health.
Astera Labs Scores
- Altman Z-Score: 136.88, indicating a safe zone for bankruptcy risk.
- Piotroski Score: 6, categorized as average financial health.
Which company has the best scores?
Astera Labs has a higher Altman Z-Score than Arm, suggesting lower bankruptcy risk. However, Arm has a stronger Piotroski Score, indicating better overall financial strength.
Grades Comparison
Here is a comparison of recent reliable grades awarded to Arm Holdings plc American Depositary Shares and Astera Labs, Inc. Common Stock:
Arm Holdings plc American Depositary Shares Grades
The following table summarizes recent grades from recognized grading companies for Arm Holdings plc:
| Grading Company | Action | New Grade | Date |
|---|---|---|---|
| B of A Securities | Downgrade | Neutral | 2026-01-13 |
| B of A Securities | Maintain | Buy | 2025-12-16 |
| Goldman Sachs | Downgrade | Sell | 2025-12-15 |
| Loop Capital | Maintain | Buy | 2025-11-12 |
| TD Cowen | Maintain | Buy | 2025-11-06 |
| Rosenblatt | Maintain | Buy | 2025-11-06 |
| Wells Fargo | Maintain | Overweight | 2025-11-06 |
| Mizuho | Maintain | Outperform | 2025-11-06 |
| Barclays | Maintain | Overweight | 2025-11-06 |
| UBS | Maintain | Buy | 2025-11-06 |
Arm Holdings plc shows a majority of buy and outperform ratings, with recent downgrades to neutral and sell by B of A Securities and Goldman Sachs, indicating some cautious sentiment among analysts.
Astera Labs, Inc. Common Stock Grades
The following table presents recent grades from recognized grading companies for Astera Labs, Inc.:
| Grading Company | Action | New Grade | Date |
|---|---|---|---|
| Northland Capital Markets | Maintain | Outperform | 2025-12-09 |
| Northland Capital Markets | Upgrade | Outperform | 2025-11-17 |
| Stifel | Maintain | Buy | 2025-11-05 |
| Morgan Stanley | Maintain | Overweight | 2025-11-05 |
| Roth Capital | Maintain | Buy | 2025-11-05 |
| Needham | Maintain | Buy | 2025-11-05 |
| JP Morgan | Maintain | Overweight | 2025-11-05 |
| TD Cowen | Maintain | Hold | 2025-11-05 |
| Barclays | Downgrade | Equal Weight | 2025-10-20 |
| Stifel | Maintain | Buy | 2025-10-17 |
Astera Labs, Inc. consistently receives buy and outperform ratings, with only a single downgrade to equal weight by Barclays, showing generally positive analyst sentiment.
Which company has the best grades?
Both Arm Holdings plc and Astera Labs, Inc. have a consensus rating of “Buy.” However, Astera Labs shows a steadier positive trend with multiple outperform and buy grades and fewer downgrades. Arm Holdings exhibits more mixed signals, including recent downgrades to neutral and sell, which could suggest higher uncertainty for investors.
Strengths and Weaknesses
The table below summarizes the key strengths and weaknesses of Arm Holdings plc (ARM) and Astera Labs, Inc. (ALAB) based on their most recent financial and operational data.
| Criterion | Arm Holdings plc (ARM) | Astera Labs, Inc. (ALAB) |
|---|---|---|
| Diversification | Moderate: Revenue mainly from licensing and royalties (4B in 2025) | Limited: Revenue concentrated in product sales (393M in 2024) |
| Profitability | Moderate net margin (19.77%), but ROIC below WACC indicating value destruction | Negative net margin (-21.05%) and ROIC well below WACC, shedding value |
| Innovation | Strong IP portfolio supporting licensing and royalties | Growing ROIC trend suggests improving innovation impact despite losses |
| Global presence | Strong global footprint through licensing | Smaller scale, less global penetration |
| Market Share | Significant in semiconductor IP licensing | Niche player in technology services and products |
Key takeaways: ARM shows solid revenue streams and profitability metrics but struggles with value creation as ROIC lags behind WACC. ALAB is currently unprofitable with negative margins but exhibits improving operational efficiency through a rising ROIC trend. Both require cautious evaluation due to financial and market risks.
Risk Analysis
Below is a comparative table highlighting key risk factors for Arm Holdings plc (ARM) and Astera Labs, Inc. (ALAB) based on the most recent financial and market data.
| Metric | Arm Holdings plc (ARM) | Astera Labs, Inc. (ALAB) |
|---|---|---|
| Market Risk | High beta (4.36), volatile trading range (80-183.16) | Moderate beta (1.51), wider range (47.13-262.9) |
| Debt level | Very low debt-to-equity (0.05), strong interest coverage | No debt, zero interest coverage due to losses |
| Regulatory Risk | Exposure to multiple countries including China and UK | US-focused, but subject to semiconductor export controls |
| Operational Risk | Large workforce (8,330), complex IP licensing model | Smaller workforce (440), newer company with growth challenges |
| Environmental Risk | Moderate; tech industry focus with rising sustainability demands | Moderate; semiconductor manufacturing footprint |
| Geopolitical Risk | High, with significant China exposure amid tensions | Moderate, mainly US-based but impacted by global supply chains |
In synthesis, ARM faces significant market and geopolitical risks due to its high beta and broad international exposure, especially in China. ALAB’s primary risks relate to operational scale and financial losses, despite no debt burden. Both companies show moderate regulatory and environmental risks typical of the semiconductor sector. Investors should weigh ARM’s volatility and geopolitical exposure against ALAB’s early-stage financial challenges.
Which Stock to Choose?
Arm Holdings plc (ARM) shows a favorable income evolution with a 23.94% revenue growth in 2025 and strong profitability reflected by a 19.77% net margin. Its financial ratios are mixed, with 42.86% favorable but a slightly unfavorable global evaluation, supported by low debt and a very favorable rating of B.
Astera Labs, Inc. (ALAB) presents neutral income performance, with rapid revenue growth of 242.24% in 2024 but negative profitability marked by a -21.05% net margin. Its financial ratios are mostly unfavorable at 64.29%, despite very favorable liquidity and a similar rating of B, while showing slightly unfavorable value creation.
Which stock is most favorable could depend on the investor’s profile. Those with a tolerance for risk and seeking growth might find ALAB’s accelerating revenue and improving profitability trends appealing. Conversely, investors prioritizing stable profitability and moderate risk may perceive ARM’s consistent income growth and stronger overall rating as more suitable.
Disclaimer: Investment carries a risk of loss of initial capital. The past performance is not a reliable indicator of future results. Be sure to understand risks before making an investment decision.
Go Further
I encourage you to read the complete analyses of Arm Holdings plc American Depositary Shares and Astera Labs, Inc. Common Stock to enhance your investment decisions: