In the rapidly evolving technology sector, Arista Networks, Inc. (ANET) and IonQ, Inc. (IONQ) stand out as pioneers in their respective fields. Both operate in computer hardware but differ vastly in focus: Arista leads in cloud networking solutions, while IonQ innovates in quantum computing systems. Comparing these companies offers insight into distinct growth opportunities and risks. This article will help you decide which is the more compelling investment choice.

Table of contents
Companies Overview
I will begin the comparison between Arista Networks, Inc. and IonQ, Inc. by providing an overview of these two companies and their main differences.
Arista Networks, Inc. Overview
Arista Networks, Inc. develops and sells cloud networking solutions globally, including operating systems, network applications, and gigabit Ethernet switching platforms. Serving industries such as internet companies, financial services, and government agencies, Arista also offers post-contract support services. The company, headquartered in Santa Clara, California, is a key player in the computer hardware sector with a market cap of 163.5B USD.
IonQ, Inc. Overview
IonQ, Inc. focuses on developing general-purpose quantum computing systems, providing access to quantum computers with 20 qubits via cloud platforms like AWS, Microsoft Azure, and Google Cloud. Founded in 2015 and based in College Park, Maryland, IonQ operates in the technology sector with a market cap of 17.3B USD. Its business model emphasizes cloud-based quantum computing services.
Key similarities and differences
Both Arista Networks and IonQ operate in the computer hardware industry within the technology sector and trade on the NYSE. Arista concentrates on cloud networking infrastructure and related support, targeting various large-scale industries. In contrast, IonQ specializes in quantum computing technology, offering cloud access to its systems. Their scale differs significantly, with Arista having a much larger market capitalization and employee base.
Income Statement Comparison
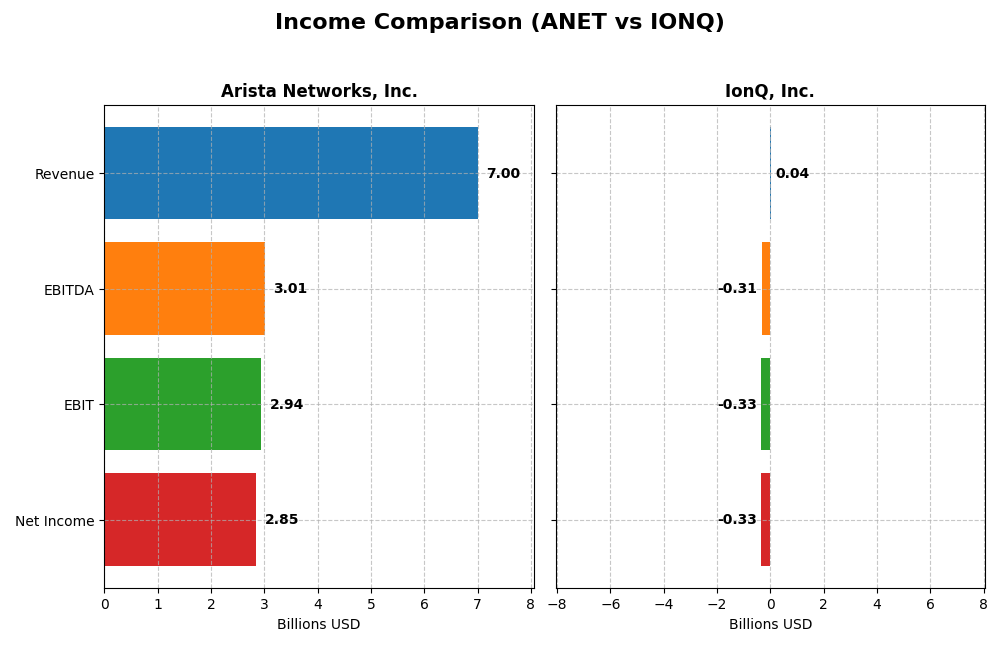
This table compares the key income statement metrics for Arista Networks, Inc. and IonQ, Inc. for the fiscal year 2024, highlighting differences in scale and profitability.
| Metric | Arista Networks, Inc. | IonQ, Inc. |
|---|---|---|
| Market Cap | 164B | 17.3B |
| Revenue | 7.00B | 43.1M |
| EBITDA | 3.01B | -313M |
| EBIT | 2.94B | -332M |
| Net Income | 2.85B | -332M |
| EPS | 2.27 | -1.56 |
| Fiscal Year | 2024 | 2024 |
Income Statement Interpretations
Arista Networks, Inc.
Arista Networks demonstrated strong revenue growth from 2.3B in 2020 to 7B in 2024, with net income rising from 635M to 2.85B. Margins showed consistent improvement, with gross margin at 64.13% and net margin reaching 40.73% in 2024. The latest year saw a 19.5% revenue increase and a 14.34% net margin growth, signaling robust profitability expansion.
IonQ, Inc.
IonQ’s revenue grew from zero in 2020 to 43M in 2024, but net income remained negative, deepening losses to -332M in 2024. Gross margin was low at 8.87%, while EBIT and net margins were strongly negative at around -770%. Despite a 95.4% revenue increase in 2024, profitability metrics deteriorated, reflecting ongoing high expenses relative to income.
Which one has the stronger fundamentals?
Arista Networks shows favorable income statement health with sustained revenue and net income growth, strong margins, and positive EPS trends. IonQ faces challenges with persistent losses, negative margins, and unfavorable overall growth metrics despite revenue gains. The comparative data indicates Arista’s fundamentals are currently stronger in terms of profitability and financial stability.
Financial Ratios Comparison
The table below presents key financial ratios for Arista Networks, Inc. and IonQ, Inc. based on their most recent fiscal year 2024 data, providing a snapshot of their financial health and performance.
| Ratios | Arista Networks, Inc. (ANET) | IonQ, Inc. (IONQ) |
|---|---|---|
| ROE | 28.5% | -86.4% |
| ROIC | 22.7% | -48.2% |
| P/E | 48.7 | -26.8 |
| P/B | 13.9 | 23.2 |
| Current Ratio | 4.36 | 10.5 |
| Quick Ratio | 3.69 | 9.98 |
| D/E | 0 | 0.046 |
| Debt-to-Assets | 0 | 0.035 |
| Interest Coverage | 0 | 0 |
| Asset Turnover | 0.50 | 0.085 |
| Fixed Asset Turnover | 70.8 | 0.69 |
| Payout Ratio | 0 | 0 |
| Dividend Yield | 0% | 0% |
Interpretation of the Ratios
Arista Networks, Inc.
Arista Networks shows strong profitability ratios with a net margin of 40.73% and return on equity at 28.54%, indicating efficient management and earnings generation. However, valuation multiples like a PE of 48.69 and PB of 13.89 appear stretched. The company does not pay dividends, likely reflecting a focus on growth and reinvestment, supported by solid free cash flow coverage.
IonQ, Inc.
IonQ presents weak financial ratios, including a negative net margin of -769.96% and a return on equity of -86.4%, signaling significant operating losses and inefficiency. The current ratio is high at 10.5 but flagged unfavorable, possibly due to asset structure. IonQ does not pay dividends, consistent with its high growth phase and ongoing investments in R&D and acquisitions.
Which one has the best ratios?
Based on the analysis, Arista Networks has a more favorable overall ratio profile, reflecting solid profitability and efficient capital use despite some valuation concerns. IonQ’s ratios indicate financial stress and lack of profitability, typical for an early-stage growth company. Thus, Arista Networks demonstrates stronger financial health in this comparison.
Strategic Positioning
This section compares the strategic positioning of Arista Networks, Inc. and IonQ, Inc., including market position, key segments, and exposure to technological disruption:
Arista Networks, Inc.
- Large market cap of 163.5B USD with strong competitive presence in cloud networking hardware.
- Key segments: cloud networking products and services, serving internet, financial, government, and media sectors.
- Operates in established networking hardware with incremental technological upgrades.
IonQ, Inc.
- Smaller market cap of 17.3B USD, focused on emerging quantum computing technology.
- Key segment: quantum computing systems with cloud-based access via major platforms.
- Positioned in cutting-edge quantum computing, facing high technological disruption.
Arista Networks, Inc. vs IonQ, Inc. Positioning
Arista Networks pursues a diversified approach across cloud networking hardware and services with broad industry exposure, while IonQ concentrates on the nascent quantum computing segment. Arista benefits from scale and established markets; IonQ faces high disruption risk but potential for innovation.
Which has the best competitive advantage?
Arista Networks shows a very favorable moat with strong and growing ROIC above WACC, indicating value creation and durable advantage. IonQ’s declining ROIC below WACC signals value destruction and a weak competitive moat.
Stock Comparison
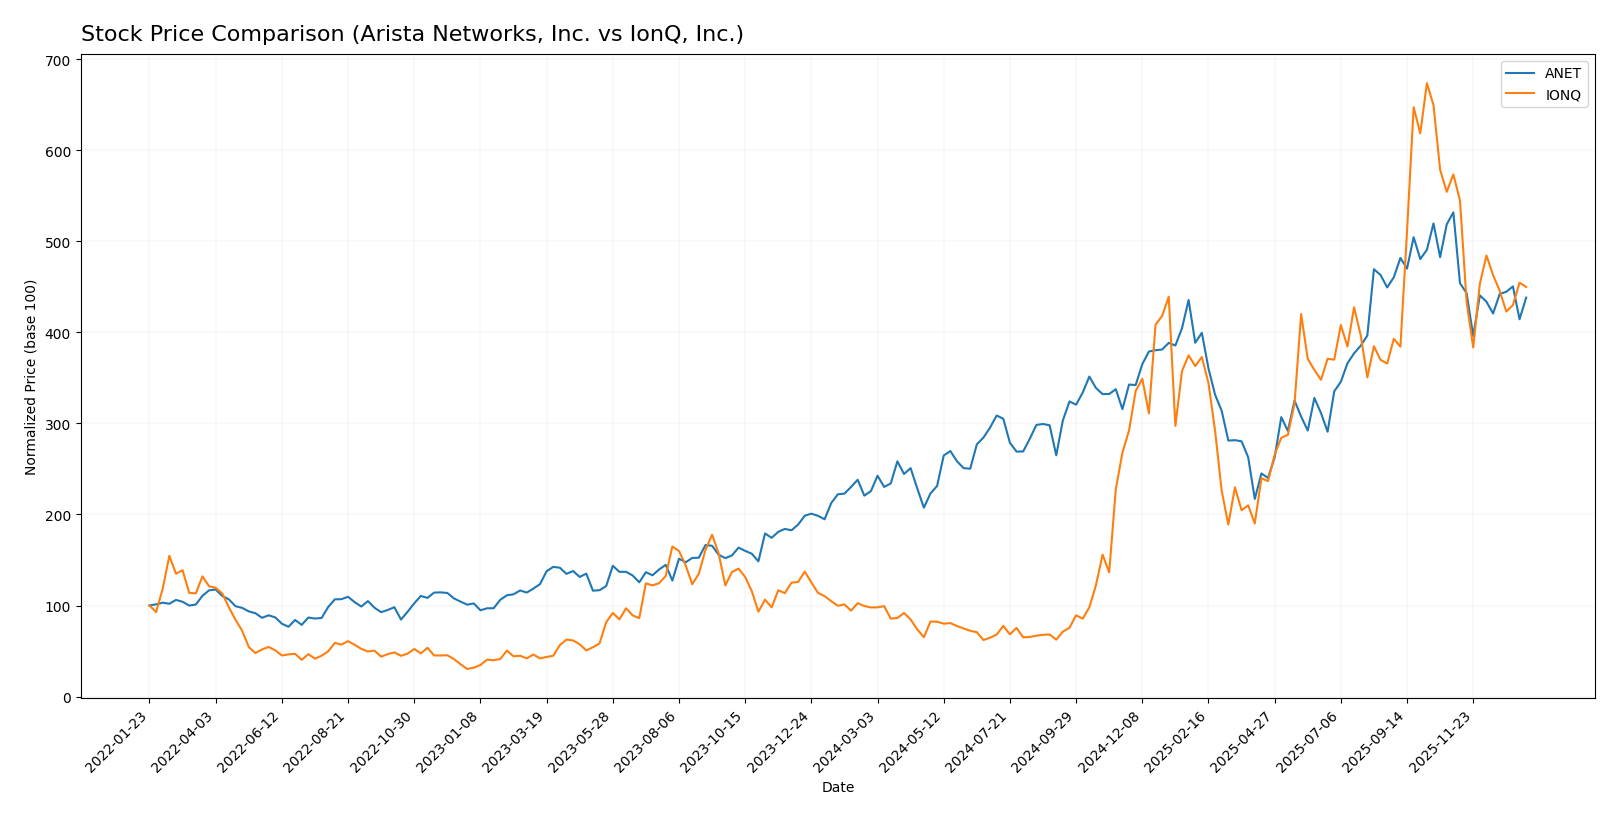
The stock prices of Arista Networks, Inc. (ANET) and IonQ, Inc. (IONQ) have experienced significant bullish trends over the past 12 months, with notable price increases followed by recent downward corrections in trading dynamics.
Trend Analysis
Arista Networks, Inc. showed a strong bullish trend over the past year with a 94.16% price increase, though the momentum has decelerated. The stock experienced a recent 17.6% decline from November 2025 to January 2026, indicating a short-term bearish phase.
IonQ, Inc. delivered a robust bullish trend with a 359.53% price rise over the same period, also showing deceleration. Recently, the stock dropped 21.55%, reflecting a similar short-term bearish correction.
Comparing both stocks, IonQ, Inc. has delivered the highest market performance with a substantially larger price increase despite recent declines, outperforming Arista Networks, Inc. over the past 12 months.
Target Prices
The current analyst consensus reveals optimistic target prices for both Arista Networks, Inc. and IonQ, Inc.
| Company | Target High | Target Low | Consensus |
|---|---|---|---|
| Arista Networks, Inc. | 183 | 150 | 163 |
| IonQ, Inc. | 100 | 55 | 72.57 |
Analysts expect Arista Networks’ stock to appreciate significantly from its current price of $129.93, reflecting strong confidence in its growth. IonQ’s consensus target price is also well above its current $48.94, indicating bullish sentiment despite higher volatility risk.
Analyst Opinions Comparison
This section compares analysts’ ratings and grades for Arista Networks, Inc. (ANET) and IonQ, Inc. (IONQ):
Rating Comparison
ANET Rating
- Rating: B, reflecting a very favorable overall financial standing.
- Discounted Cash Flow Score: Moderate score of 3, showing balanced valuation.
- ROE Score: Very favorable top score of 5, indicating efficient profit generation.
- ROA Score: Very favorable score of 5, demonstrating effective asset use.
- Debt To Equity Score: Very unfavorable score of 1, indicating high financial risk.
- Overall Score: Moderate score of 3, indicating average company performance.
IONQ Rating
- Rating: C-, indicating a very unfavorable overall financial standing.
- Discounted Cash Flow Score: Very unfavorable score of 1, suggesting overvaluation.
- ROE Score: Very unfavorable score of 1, showing poor profit generation.
- ROA Score: Very unfavorable score of 1, reflecting inefficient asset use.
- Debt To Equity Score: Favorable score of 4, suggesting lower financial risk.
- Overall Score: Very unfavorable score of 1, reflecting weak company performance.
Which one is the best rated?
Based strictly on the provided data, Arista Networks holds a superior rating with a B grade and stronger scores in ROE, ROA, and overall performance. IonQ lags with a C- rating and generally unfavorable financial metrics except for a better debt-to-equity score.
Scores Comparison
Here is a comparison of the Altman Z-Score and Piotroski Score for Arista Networks, Inc. (ANET) and IonQ, Inc. (IONQ):
ANET Scores
- Altman Z-Score: 18.45, indicating a safe zone with very low bankruptcy risk.
- Piotroski Score: 5, reflecting average financial strength.
IONQ Scores
- Altman Z-Score: 3.59, indicating a safe zone with low bankruptcy risk.
- Piotroski Score: 2, reflecting very weak financial strength.
Which company has the best scores?
Based on the provided data, ANET has a significantly higher Altman Z-Score and a stronger Piotroski Score than IONQ. ANET’s scores indicate better financial stability and average strength, while IONQ’s Piotroski Score is very weak despite being in the safe zone for bankruptcy risk.
Grades Comparison
Here is the detailed comparison of grades for Arista Networks, Inc. and IonQ, Inc.:
Arista Networks, Inc. Grades
The table below summarizes recent grades assigned by major financial institutions to Arista Networks, Inc.:
| Grading Company | Action | New Grade | Date |
|---|---|---|---|
| Piper Sandler | Upgrade | Overweight | 2026-01-05 |
| Morgan Stanley | Maintain | Overweight | 2025-12-17 |
| Piper Sandler | Maintain | Neutral | 2025-11-05 |
| Barclays | Maintain | Overweight | 2025-11-05 |
| Rosenblatt | Maintain | Neutral | 2025-11-05 |
| Morgan Stanley | Maintain | Overweight | 2025-10-10 |
| Needham | Maintain | Buy | 2025-09-16 |
| Wells Fargo | Maintain | Overweight | 2025-09-12 |
| JP Morgan | Maintain | Overweight | 2025-09-12 |
| Goldman Sachs | Maintain | Buy | 2025-09-12 |
Arista Networks has consistently received positive ratings, predominantly “Buy” and “Overweight,” indicating broad analyst confidence.
IonQ, Inc. Grades
The table below summarizes recent grades assigned by major financial institutions to IonQ, Inc.:
| Grading Company | Action | New Grade | Date |
|---|---|---|---|
| Benchmark | Maintain | Buy | 2024-08-12 |
| Goldman Sachs | Maintain | Neutral | 2024-08-09 |
| Craig-Hallum | Maintain | Buy | 2024-08-08 |
| Needham | Maintain | Buy | 2024-05-16 |
| Needham | Maintain | Buy | 2024-05-09 |
| Goldman Sachs | Maintain | Neutral | 2024-02-29 |
| Needham | Maintain | Buy | 2024-02-29 |
| Morgan Stanley | Maintain | Equal Weight | 2023-10-30 |
| Needham | Maintain | Buy | 2023-09-20 |
| Needham | Maintain | Buy | 2023-09-19 |
IonQ’s grades show a more mixed but generally positive outlook, with a majority of “Buy” ratings tempered by several “Neutral” and “Equal Weight” assessments.
Which company has the best grades?
Arista Networks, Inc. holds the stronger consensus with numerous “Buy” and “Overweight” ratings from top-tier firms, suggesting greater analyst confidence compared to IonQ, Inc., which has a blend of “Buy” and “Neutral” ratings. For investors, this may imply a clearer positive outlook for Arista based on current analyst sentiment.
Strengths and Weaknesses
Below is a comparison of key strengths and weaknesses for Arista Networks, Inc. (ANET) and IonQ, Inc. (IONQ) based on the most recent financial and market data.
| Criterion | Arista Networks, Inc. (ANET) | IonQ, Inc. (IONQ) |
|---|---|---|
| Diversification | Strong product and service revenue mix, with $5.88B in products and $1.12B in services in 2024 | Limited diversification, primarily focused on quantum computing technology |
| Profitability | High profitability with 40.7% net margin and 28.5% ROE; creating value with growing ROIC | Negative profitability: -770% net margin, ROE -86.4%, shedding value with declining ROIC |
| Innovation | Consistent investment in advanced networking solutions, maintaining a durable competitive edge | Innovative in quantum computing but early-stage with uncertain commercial returns |
| Global presence | Established global customer base in enterprise networking | Emerging global presence, largely in nascent markets |
| Market Share | Significant market share in high-performance networking equipment | Small market share, still developing market position |
Arista Networks demonstrates robust profitability, diversification, and a durable competitive advantage, making it a more stable investment. IonQ, while innovative, faces significant profitability challenges and value erosion, indicating higher investment risk.
Risk Analysis
Below is a comparative table of key risks for Arista Networks, Inc. (ANET) and IonQ, Inc. (IONQ) based on the most recent data from 2024-2026:
| Metric | Arista Networks, Inc. (ANET) | IonQ, Inc. (IONQ) |
|---|---|---|
| Market Risk | Beta 1.41, moderate volatility | Beta 2.63, high volatility |
| Debt level | Zero debt, very low financial risk | Low debt (5% D/E), manageable risk |
| Regulatory Risk | Moderate, tech sector compliance | Moderate, emerging quantum tech regulation |
| Operational Risk | Low, established operations | High, early-stage tech with scaling challenges |
| Environmental Risk | Low, standard tech industry impact | Low, limited physical footprint |
| Geopolitical Risk | Moderate, global supply chains | Moderate, reliant on cloud partners worldwide |
The most impactful and likely risks differ markedly: IonQ faces high operational and market risks due to its nascent quantum computing technology and elevated beta, while Arista Networks benefits from strong financial health but must manage market volatility and moderate geopolitical exposure. Investors should weigh IonQ’s innovation potential against its financial and operational instability, whereas Arista offers more stability with moderate growth risks.
Which Stock to Choose?
Arista Networks, Inc. (ANET) shows strong income growth with a 2024 revenue increase of 19.5% and a net margin of 40.73%. Its financial ratios are mostly favorable, including a high ROE of 28.54%, no debt, and a very favorable moat indicating durable competitive advantage.
IonQ, Inc. (IONQ) exhibits volatile income with a 95.41% revenue growth in 2024 but negative net margin of -769.96% and overall unfavorable financial ratios. The company carries some debt, has poor profitability metrics, and a very unfavorable moat reflecting declining profitability and value destruction.
Investors focused on growth might find IonQ’s high revenue growth appealing despite financial challenges, while those prioritizing financial stability and quality could view Arista Networks’ robust profitability and favorable ratings as more attractive for risk-averse profiles.
Disclaimer: Investment carries a risk of loss of initial capital. The past performance is not a reliable indicator of future results. Be sure to understand risks before making an investment decision.
Go Further
I encourage you to read the complete analyses of Arista Networks, Inc. and IonQ, Inc. to enhance your investment decisions: