Arista Networks, Inc. (ANET) and HP Inc. (HPQ) are two prominent players in the computer hardware industry, each with a distinct approach to innovation and market presence. While Arista specializes in cloud networking solutions, HP focuses on personal computing and printing products. Their overlapping technology sectors and strategic innovations make them compelling companies to compare. In this article, I will help you identify which company holds the most promise for your investment portfolio.

Table of contents
Companies Overview
I will begin the comparison between Arista Networks and HP Inc. by providing an overview of these two companies and their main differences.
Arista Networks Overview
Arista Networks, Inc. specializes in cloud networking solutions, offering extensible operating systems, network applications, and gigabit Ethernet switching and routing platforms. The company serves diverse industries such as internet companies, financial services, and government agencies. Headquartered in Santa Clara, California, Arista emphasizes technical support and post-contract services to maintain customer satisfaction in a competitive technology sector.
HP Inc. Overview
HP Inc. delivers personal computing devices, imaging and printing products, and related technologies worldwide. Its operations are divided into Personal Systems, Printing, and Corporate Investments segments. Serving consumers, businesses, and various sectors including government and education, HP is headquartered in Palo Alto, California. The company has a broad product range from desktops and notebooks to commercial printers and software support.
Key similarities and differences
Both Arista Networks and HP operate within the technology sector, focusing on computer hardware products. Arista targets cloud networking infrastructure and specialized industries, while HP offers a wider product portfolio including personal computers, printing solutions, and corporate investments. Arista’s business model leans towards network-centric solutions and support, whereas HP combines hardware sales with diverse service offerings across consumer and enterprise markets.
Income Statement Comparison
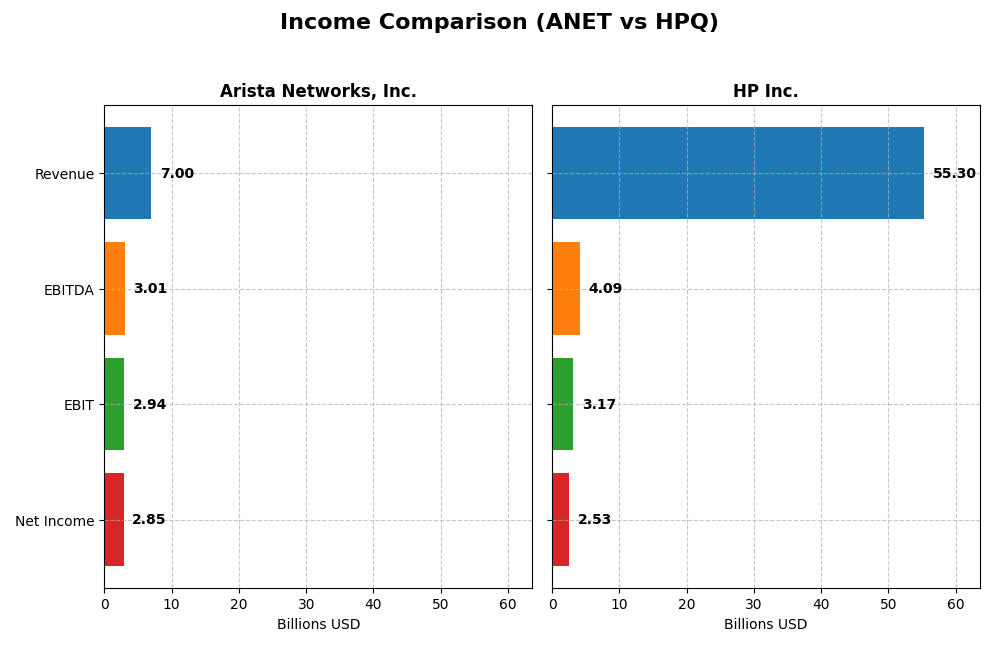
The table below presents the most recent fiscal year income statement data for Arista Networks, Inc. and HP Inc., highlighting key financial metrics to facilitate a clear comparison.
| Metric | Arista Networks, Inc. | HP Inc. |
|---|---|---|
| Market Cap | 164B | 19.7B |
| Revenue | 7.00B | 55.3B |
| EBITDA | 3.01B | 4.09B |
| EBIT | 2.94B | 3.17B |
| Net Income | 2.85B | 2.53B |
| EPS | 2.27 | 2.67 |
| Fiscal Year | 2024 | 2025 |
Income Statement Interpretations
Arista Networks, Inc.
Arista Networks demonstrated strong revenue growth from 2020 to 2024, surging from $2.3B to $7B, with net income rising from $635M to $2.85B. Margins remained robust, with gross margin above 64% and net margin at 40.7% in 2024. The latest year showed accelerated growth, with revenue and net income increasing by nearly 20% and 36% respectively, alongside improved profitability metrics.
HP Inc.
HP Inc.’s revenue declined over the 2021-2025 period, dropping from $63.5B to $55.3B, while net income fell substantially from $6.5B to $2.53B. Margins were modest, with a 19.98% gross margin and 4.57% net margin in 2025. The most recent year reflected slower revenue growth of 3.2% and negative trends in earnings, with net income and EPS decreasing, indicating margin pressures and operational challenges.
Which one has the stronger fundamentals?
Arista Networks exhibits stronger fundamentals, characterized by consistent double-digit revenue and net income growth, superior margins, and a favorable income statement evaluation across all key metrics. In contrast, HP Inc. shows declining revenues and profits, lower margins, and an overall unfavorable income statement evaluation, reflecting weaker financial performance over the period analyzed.
Financial Ratios Comparison
The table below presents the most recent financial ratios for Arista Networks, Inc. (ANET) and HP Inc. (HPQ), offering a side-by-side view of key performance and financial health metrics as of their latest fiscal years.
| Ratios | Arista Networks, Inc. (2024 FY) | HP Inc. (2025 FY) |
|---|---|---|
| ROE | 28.5% | -7.3% |
| ROIC | 22.7% | 24.97% |
| P/E | 48.7 | 10.35 |
| P/B | 13.9 | -75.7 |
| Current Ratio | 4.36 | 0.77 |
| Quick Ratio | 3.69 | 0.48 |
| D/E | 0 | -31.45 |
| Debt-to-Assets | 0 | 26.1% |
| Interest Coverage | 0 | 7.16 |
| Asset Turnover | 0.50 | 1.32 |
| Fixed Asset Turnover | 70.8 | 13.2 |
| Payout ratio | 0 | 43.0% |
| Dividend yield | 0% | 4.16% |
Interpretation of the Ratios
Arista Networks, Inc.
Arista Networks shows strong profitability and return ratios with net margin at 40.73%, ROE at 28.54%, and ROIC at 22.74%, though valuation multiples like P/E of 48.69 and P/B of 13.89 appear high. Liquidity is mixed with a high current ratio of 4.36 flagged as unfavorable, while leverage metrics are favorable with zero debt. The company does not pay dividends, likely focusing on growth and reinvestment.
HP Inc.
HP Inc. presents mixed financials with a modest net margin of 4.57% and a negative ROE of -730.92%, indicating profitability challenges, despite strong ROIC at 24.97% and favorable valuation multiples including a P/E of 10.35. Liquidity ratios are weak, with a current ratio of 0.77 below 1. The company pays dividends yielding 4.16%, supported by stable coverage and buybacks, indicating shareholder returns despite operational concerns.
Which one has the best ratios?
Both companies have a favorable global ratio opinion, but Arista Networks excels in profitability and leverage, while HP Inc. benefits from stronger valuation and dividend yield. Arista’s high valuation multiples and liquidity concerns contrast with HP’s negative profitability metrics and weak liquidity, making their ratio profiles strong in different aspects.
Strategic Positioning
This section compares the strategic positioning of Arista Networks, Inc. and HP Inc. regarding Market position, Key segments, and Exposure to technological disruption:
Arista Networks, Inc.
- Market leader in cloud networking with significant competitive pressure from global tech firms.
- Focuses on cloud networking products and services targeting internet, financial, government, and media sectors.
- Exposure through cloud networking technology and network hardware innovation.
HP Inc.
- Established player in personal computing and printing with moderate competitive pressures.
- Operates three segments: Personal Systems, Printing, and Corporate Investments.
- Exposure through technology evolution in personal computing and printing solutions.
Arista Networks, Inc. vs HP Inc. Positioning
Arista Networks maintains a concentrated focus on cloud networking, leveraging high-value industry sectors. HP Inc. pursues a diversified approach, spanning personal systems, printing, and investments, with broader but potentially less specialized market coverage.
Which has the best competitive advantage?
Arista Networks shows a very favorable moat with growing ROIC and durable competitive advantage. HP Inc. creates value but has a slightly favorable moat with declining profitability, indicating a less robust competitive position.
Stock Comparison
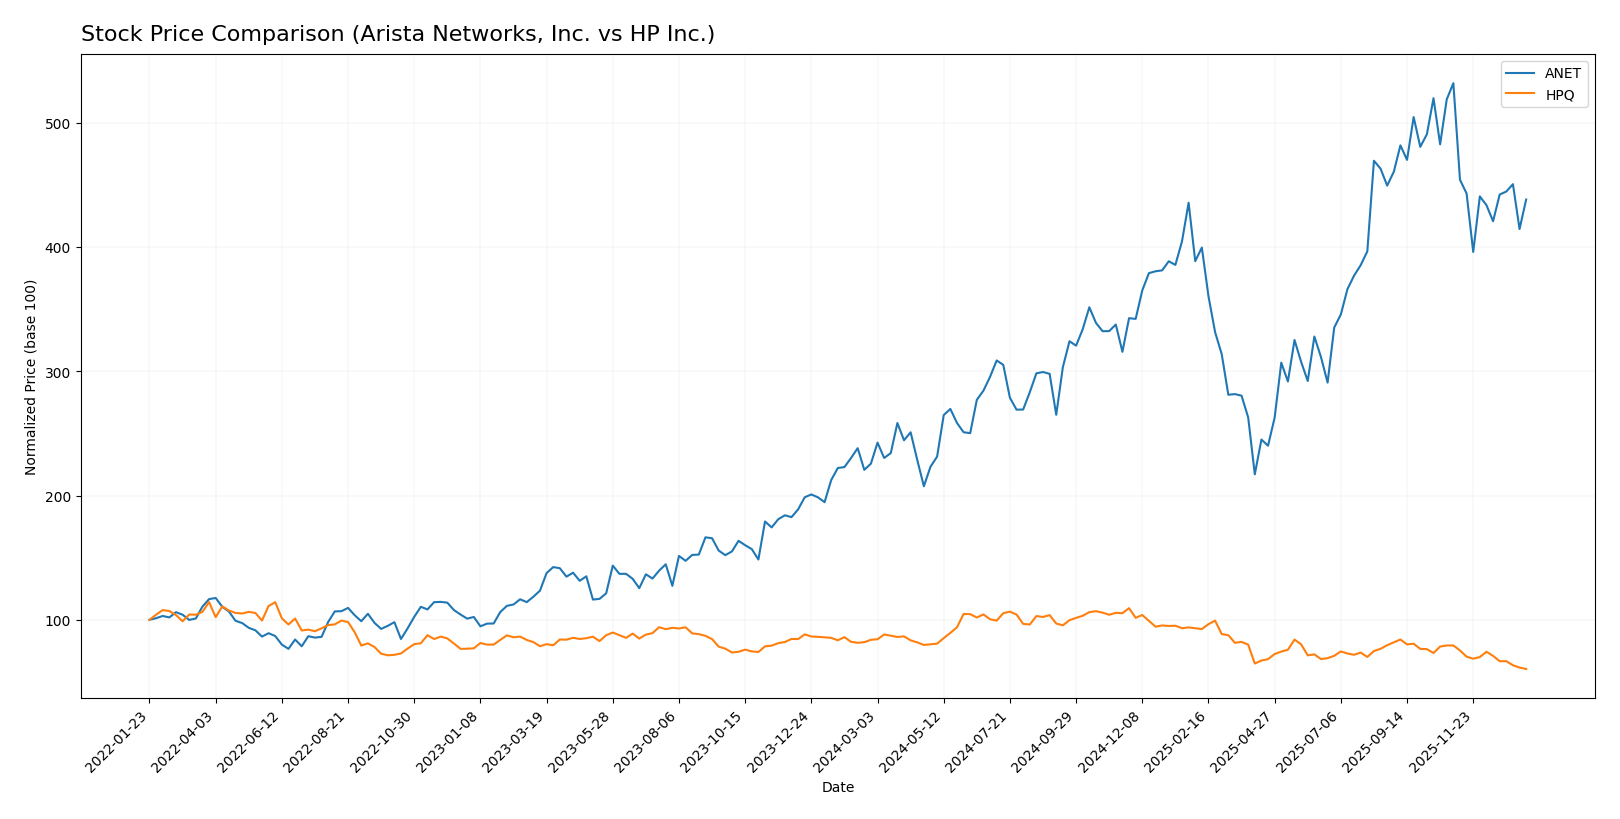
The stock price movements of Arista Networks, Inc. and HP Inc. over the past 12 months reveal contrasting trends, with Arista showing significant gains and HP experiencing declines amid shifting trading dynamics.
Trend Analysis
Arista Networks, Inc. exhibited a strong bullish trend over the past year with a 94.16% price increase, although the upward momentum has decelerated recently. The stock’s volatility is notable, with a standard deviation of 24.64, and it reached a high of 157.69.
HP Inc. faced a bearish trend over the same period, with a 27.98% price decline and decelerating downside momentum. Its volatility remains lower at a 4.65 standard deviation, with a highest price of 38.13 and a lowest of 21.08.
Comparatively, Arista Networks delivered the highest market performance, significantly outperforming HP Inc., which suffered considerable losses in the analyzed 12-month timeframe.
Target Prices
The consensus target prices from verified analysts indicate growth potential for both Arista Networks, Inc. and HP Inc.
| Company | Target High | Target Low | Consensus |
|---|---|---|---|
| Arista Networks, Inc. | 183 | 150 | 163 |
| HP Inc. | 30 | 20 | 24.8 |
Analysts expect Arista Networks to trade significantly above its current price of $129.93, suggesting bullish sentiment. HP Inc.’s consensus target of $24.8 also indicates moderate upside from its current $21.08 trading level.
Analyst Opinions Comparison
This section compares analysts’ ratings and grades for Arista Networks, Inc. (ANET) and HP Inc. (HPQ):
Rating Comparison
ANET Rating
- Rating: B, considered very favorable overall.
- Discounted Cash Flow Score: Moderate at 3.
- ROE Score: Very favorable at 5.
- ROA Score: Very favorable at 5.
- Debt To Equity Score: Very unfavorable at 1.
- Overall Score: Moderate at 3.
HPQ Rating
- Rating: B-, also very favorable overall.
- Discounted Cash Flow Score: Favorable at 4.
- ROE Score: Very unfavorable at 1.
- ROA Score: Favorable at 4.
- Debt To Equity Score: Very unfavorable at 1.
- Overall Score: Moderate at 2.
Which one is the best rated?
Based strictly on the data, ANET holds a higher overall rating (B vs. B-) and stronger ROE and ROA scores, while HPQ has a better discounted cash flow score. Both have equally unfavorable debt-to-equity scores.
Scores Comparison
Here is a comparison of the Altman Z-Score and Piotroski Score for Arista Networks, Inc. and HP Inc.:
ANET Scores
- Altman Z-Score: 18.45, indicating a safe zone, very low bankruptcy risk.
- Piotroski Score: 5, reflecting average financial strength and value.
HPQ Scores
- Altman Z-Score: 1.60, in distress zone, high bankruptcy risk.
- Piotroski Score: 6, reflecting average financial strength and value.
Which company has the best scores?
Based on the provided data, Arista Networks shows a significantly stronger Altman Z-Score indicating lower bankruptcy risk, while HP Inc. has a slightly higher Piotroski Score but remains in the average range. Overall, Arista Networks has the better scores.
Grades Comparison
Here is a comparison of the latest grades assigned to Arista Networks, Inc. and HP Inc. by reputable grading companies:
Arista Networks, Inc. Grades
The following table summarizes recent grades and rating actions for Arista Networks, Inc.:
| Grading Company | Action | New Grade | Date |
|---|---|---|---|
| Piper Sandler | Upgrade | Overweight | 2026-01-05 |
| Morgan Stanley | Maintain | Overweight | 2025-12-17 |
| Piper Sandler | Maintain | Neutral | 2025-11-05 |
| Barclays | Maintain | Overweight | 2025-11-05 |
| Rosenblatt | Maintain | Neutral | 2025-11-05 |
| Morgan Stanley | Maintain | Overweight | 2025-10-10 |
| Needham | Maintain | Buy | 2025-09-16 |
| Wells Fargo | Maintain | Overweight | 2025-09-12 |
| JP Morgan | Maintain | Overweight | 2025-09-12 |
| Goldman Sachs | Maintain | Buy | 2025-09-12 |
Overall, Arista Networks has consistently received positive ratings, with a majority of “Overweight” and “Buy” grades maintained or upgraded recently.
HP Inc. Grades
The following table summarizes recent grades and rating actions for HP Inc.:
| Grading Company | Action | New Grade | Date |
|---|---|---|---|
| Goldman Sachs | Maintain | Neutral | 2025-11-26 |
| Evercore ISI Group | Maintain | In Line | 2025-11-26 |
| Citigroup | Maintain | Neutral | 2025-11-26 |
| Morgan Stanley | Maintain | Underweight | 2025-11-26 |
| JP Morgan | Maintain | Neutral | 2025-11-26 |
| Barclays | Maintain | Equal Weight | 2025-11-26 |
| TD Cowen | Maintain | Hold | 2025-11-26 |
| UBS | Maintain | Neutral | 2025-11-26 |
| Morgan Stanley | Maintain | Underweight | 2025-11-21 |
| B of A Securities | Maintain | Neutral | 2025-11-21 |
HP Inc. shows a predominance of “Neutral,” “Hold,” and “Underweight” ratings, reflecting a more cautious market outlook.
Which company has the best grades?
Arista Networks holds notably stronger grades, predominantly “Buy” and “Overweight,” while HP Inc. is rated mostly “Neutral” or “Underweight.” This suggests that investors may view Arista Networks as having greater growth potential or stronger fundamentals compared to HP Inc.
Strengths and Weaknesses
Below is a comparison table highlighting key strengths and weaknesses of Arista Networks, Inc. (ANET) and HP Inc. (HPQ) based on their latest financial and operational data.
| Criterion | Arista Networks, Inc. (ANET) | HP Inc. (HPQ) |
|---|---|---|
| Diversification | Moderate: Mainly focused on networking products and services | High: Diverse segments including Personal Systems, Printing, and Corporate Investments |
| Profitability | Very high net margin (40.7%), strong ROIC (22.7%), creating value with growing profitability | Moderate net margin (4.6%), high ROIC (25%), but profitability declining over recent years |
| Innovation | Strong: High fixed asset turnover (70.85) indicates efficient use of assets, continuous growth in ROIC | Moderate: Investment in Corporate segment, but declining ROIC trend suggests challenges in innovation impact |
| Global presence | Strong in networking hardware with expanding service revenues | Extensive global footprint in personal systems and printing markets |
| Market Share | Growing product sales, with product revenue up to $5.88B in 2024 | Large scale in Personal Systems ($38.5B) and Printing ($16.7B) segments, steady market presence |
Key takeaways: Arista Networks shows superior profitability with a focused product and service line and strong growth in return on invested capital, indicating a durable competitive advantage. HP Inc. benefits from broader diversification and global reach but faces challenges with declining profitability despite maintaining value creation. Investors should weigh Arista’s growth and efficiency against HP’s scale and diversification while considering their risk tolerance.
Risk Analysis
Below is a summary table highlighting key risk factors for Arista Networks, Inc. (ANET) and HP Inc. (HPQ) based on the most recent financial and operational data:
| Metric | Arista Networks, Inc. (ANET) | HP Inc. (HPQ) |
|---|---|---|
| Market Risk | High beta (1.414) implies higher volatility and sensitivity to market swings. | Moderately high beta (1.22), somewhat volatile but less than ANET. |
| Debt level | Zero debt; strong balance sheet with no financial leverage risk. | Moderate debt-to-assets at 26.05%; manageable but requires monitoring. |
| Regulatory Risk | Moderate; operates globally with exposure to tech regulations and export controls. | Moderate; faces regulations in hardware, printing, and data privacy sectors. |
| Operational Risk | Low; strong operational efficiency and favorable ROE/ROIC metrics. | Moderate; weaker net margin and negative ROE indicate operational challenges. |
| Environmental Risk | Low; limited direct environmental impact from cloud networking solutions. | Moderate; hardware manufacturing and printing involve environmental considerations. |
| Geopolitical Risk | Moderate; global sales expose to supply chain and geopolitical tensions. | Moderate; global presence with some exposure to trade and geopolitical shifts. |
In synthesis, Arista Networks presents the most significant risk from market volatility due to its high beta but benefits from a debt-free position and strong operational metrics. HP Inc. faces notable operational challenges reflected in its negative ROE and distress-level Altman Z-Score, indicating higher bankruptcy risk, though its debt remains moderate. Investors should weigh ANET’s market risk against HPQ’s financial distress and operational inefficiencies when managing portfolio risk.
Which Stock to Choose?
Arista Networks, Inc. (ANET) shows strong income growth with a 2024 revenue increase of 19.5% and favorable profitability metrics, including a 40.73% net margin. It maintains zero debt, high return ratios, and a very favorable rating “B” reflecting solid financial health.
HP Inc. (HPQ) exhibits modest revenue growth of 3.24% in 2025 but unfavorable net margin at 4.57% and negative return on equity. Despite some favorable valuations and a “B-” rating, it carries significant debt and a weaker liquidity position, indicating financial challenges.
Investors prioritizing growth and profitability might find ANET’s strong income evolution and very favorable financial ratios more appealing, while those focused on value or dividend yield may see HPQ’s lower valuation and moderate rating as potentially fitting a different risk profile.
Disclaimer: Investment carries a risk of loss of initial capital. The past performance is not a reliable indicator of future results. Be sure to understand risks before making an investment decision.
Go Further
I encourage you to read the complete analyses of Arista Networks, Inc. and HP Inc. to enhance your investment decisions: