Home > Comparison > Financial Services > BK vs ARES
The strategic rivalry between The Bank of New York Mellon Corporation and Ares Management Corporation shapes the financial services sector’s competitive landscape. BK operates as a diversified, capital-intensive asset manager with global custody and wealth services. In contrast, ARES excels as a nimble alternative asset manager focused on credit, private equity, and real estate investments. This analysis evaluates which corporate strategy delivers superior risk-adjusted returns for a diversified portfolio amid evolving market dynamics.

Table of contents
Companies Overview
The Bank of New York Mellon Corporation and Ares Management Corporation stand as major players in the global asset management landscape.
The Bank of New York Mellon Corporation: Global Financial Custodian
This company dominates the asset management sector by providing custody, wealth, and investment services internationally. Its core revenue stems from securities services, market and wealth services, and investment management. In 2026, the firm focuses on expanding technology-driven solutions and integrated cash management to enhance client servicing across institutional and high-net-worth segments.
Ares Management Corporation: Alternative Asset Specialist
Ares Management excels in alternative asset management, focusing on credit, private equity, and real estate investments. It generates revenue by managing diverse investment funds and providing direct lending to mid-sized businesses. The 2026 strategy emphasizes growth in control investments and self-originated financing, leveraging its multi-asset approach across the US, Europe, and Asia.
Strategic Collision: Similarities & Divergences
Both firms operate in asset management but diverge sharply on business models: BNY Mellon centers on a broad custody and wealth services ecosystem while Ares pursues active control in alternative assets. Their battle for assets under management plays out between traditional institutional custody and nimble, opportunistic private investments. This contrast defines their distinct investment profiles—stable, diversified versus growth-oriented, niche-focused.
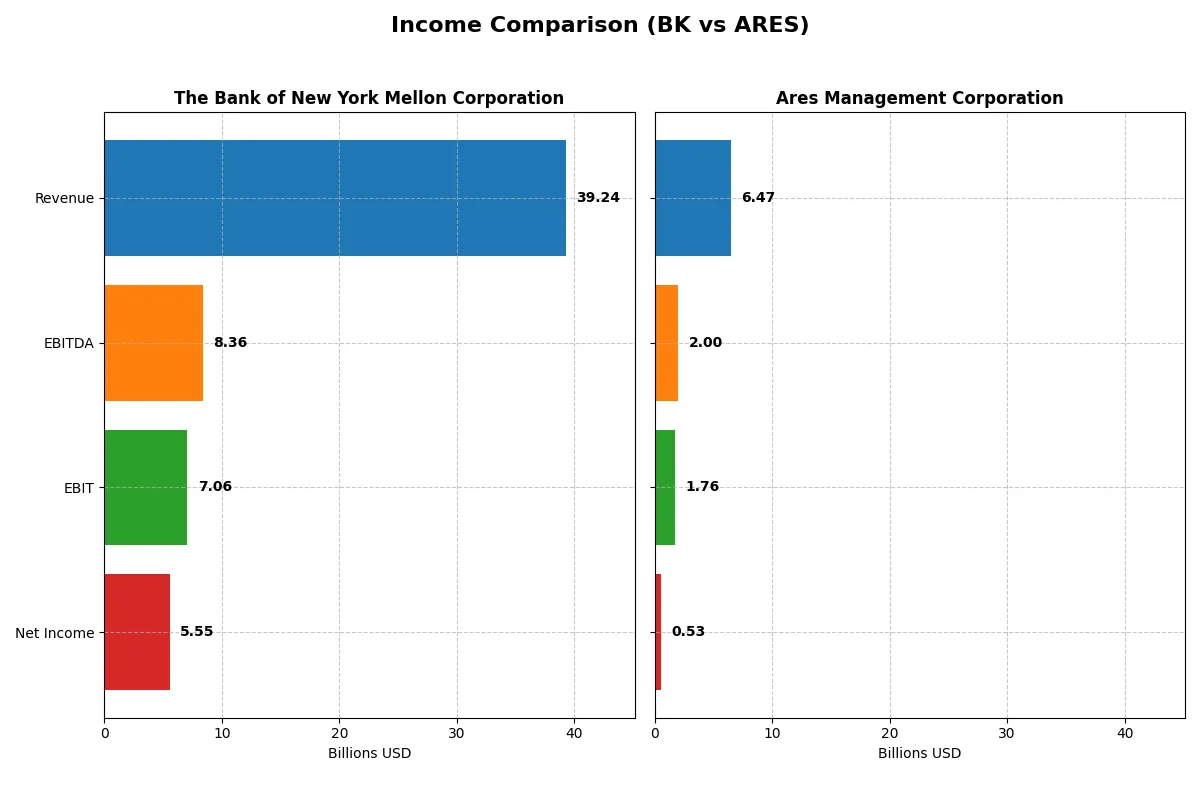
Income Statement Comparison
This data dissects the core profitability and scalability of both corporate engines to reveal who dominates the bottom line:
| Metric | The Bank of New York Mellon Corporation (BK) | Ares Management Corporation (ARES) |
|---|---|---|
| Revenue | 39.2B | 6.5B |
| Cost of Revenue | 19.4B | 1.4B |
| Operating Expenses | 12.8B | 1.0B |
| Gross Profit | 19.9B | 1.9B |
| EBITDA | 8.4B | 2.0B |
| EBIT | 7.1B | 1.8B |
| Interest Expense | 20.7B | 0 |
| Net Income | 5.5B | 527M |
| EPS | 7.46 | 1.96 |
| Fiscal Year | 2025 | 2025 |
Income Statement Analysis: The Bottom-Line Duel
This income statement comparison reveals which company operates with superior efficiency and profitability in their core business engines.
The Bank of New York Mellon Corporation Analysis
BK’s revenue grew from $15.9B in 2021 to $39.2B in 2025, showing strong top-line expansion. Net income surged from $3.76B to $5.55B, reflecting solid bottom-line growth. Gross margin stays robust at 50.6%, while net margin improved to 14.1%. The 2025 EBIT margin of 18% signals enhanced operational efficiency and momentum despite slight revenue contraction.
Ares Management Corporation Analysis
ARES posted steady revenue growth from $4.2B in 2021 to $6.5B in 2025, a 53.6% rise over five years. Net income increased from $409M to $527M, albeit with margin pressure. Gross margin sits at 30%, with a higher EBIT margin of 27.2%, but net margin declined to 8.2%. The latest year shows strong top-line momentum but a drop in net margin and EPS signals efficiency challenges.
Margin Power vs. Revenue Scale
BK dominates with higher revenue and net income, supported by superior gross and net margins, demonstrating more effective cost control and capital allocation. ARES shows promising revenue growth and EBITDA margins but suffers from weaker net profitability and EPS declines. BK’s profile appeals to investors seeking a stable, efficient business with clear earnings growth.
Financial Ratios Comparison
These vital ratios act as a diagnostic tool to expose the underlying fiscal health, valuation premiums, and capital efficiency of the companies compared below:
| Ratios | The Bank of New York Mellon Corporation (BK) | Ares Management Corporation (ARES) |
|---|---|---|
| ROE | 12.5% | 0% |
| ROIC | 6.4% | 0% |
| P/E | 14.7 | 66.6 |
| P/B | 1.85 | 0 |
| Current Ratio | 0.70 | 0 |
| Quick Ratio | 0.70 | 0 |
| D/E (Debt-to-Equity) | 0.76 | 0 |
| Debt-to-Assets | 7.2% | 0 |
| Interest Coverage | 0.34 | 0 |
| Asset Turnover | 0.08 | 0 |
| Fixed Asset Turnover | 11.0 | 0 |
| Payout Ratio | 25.4% | 185% |
| Dividend Yield | 1.7% | 2.8% |
| Fiscal Year | 2025 | 2025 |
Efficiency & Valuation Duel: The Vital Signs
Financial ratios act as a company’s DNA, exposing hidden risks and revealing operational strengths that shape investor confidence.
The Bank of New York Mellon Corporation
BK demonstrates solid profitability with a 12.5% ROE and a favorable 14.14% net margin, suggesting operational efficiency. Its P/E of 14.74 indicates reasonable valuation compared to sector norms. Dividend yield stands at 1.72%, balancing shareholder returns between steady dividends and reinvestment in stable business operations.
Ares Management Corporation
ARES shows weaker core profitability, with an unfavorable zero ROE and 8.15% net margin, reflecting operational challenges. Its P/E at 66.62 signals an expensive valuation, implying growth expectations priced in. Despite this, ARES offers a higher 2.77% dividend yield, rewarding shareholders amid uncertain reinvestment returns.
Premium Valuation vs. Operational Safety
BK provides a more balanced risk-reward profile, combining steady profitability with reasonable valuation and modest dividends. In contrast, ARES’s expensive valuation and weak profitability increase risk, despite attractive dividends. Investors seeking stability may prefer BK, while growth seekers might tolerate ARES’s stretched metrics.
Which one offers the Superior Shareholder Reward?
I compare The Bank of New York Mellon Corporation (BK) and Ares Management Corporation (ARES) focusing on dividends, payout ratios, and buybacks. BK yields 1.7–3.6%, with a conservative payout ratio near 25–54%, balancing dividends with solid buybacks. ARES offers higher yields around 2.7–4.7% but sports payout ratios exceeding 100%, signaling aggressive dividend policies likely fueled by debt. BK’s buyback programs are steady, supporting sustainable total returns. ARES’s high leverage and negative free cash flow raise doubts about dividend sustainability. I find BK’s disciplined distribution and buybacks offer a more reliable, long-term shareholder reward in 2026.
Comparative Score Analysis: The Strategic Profile
The radar chart reveals the fundamental DNA and trade-offs of The Bank of New York Mellon Corporation and Ares Management Corporation, highlighting their strategic financial strengths and weaknesses:
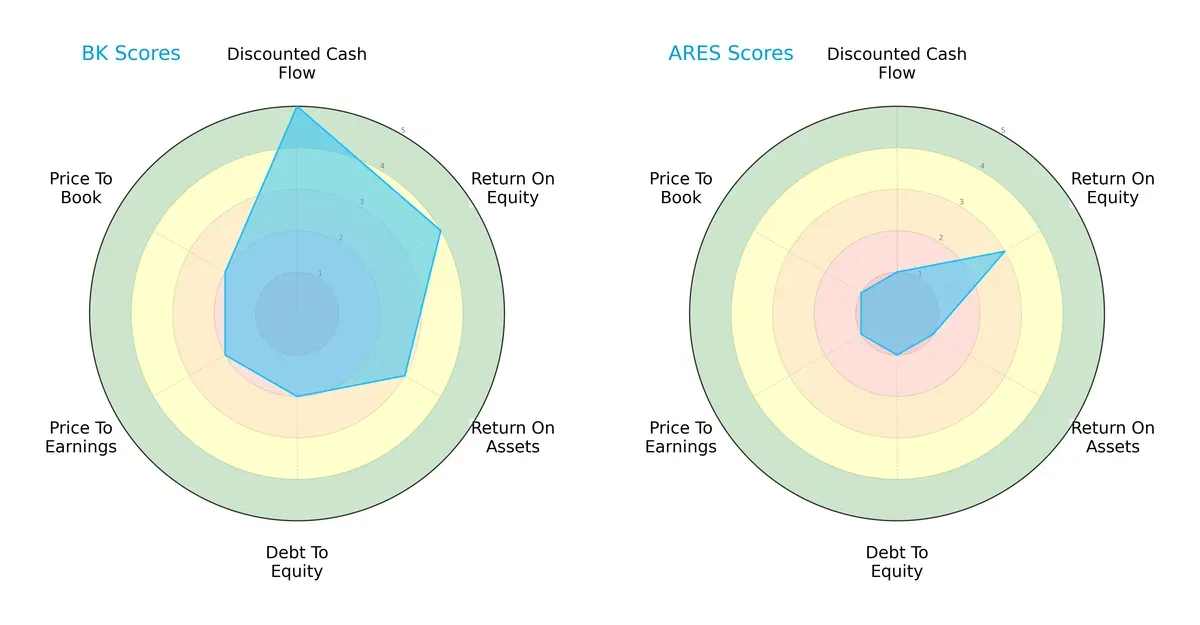
The Bank of New York Mellon Corporation shows a more balanced profile with strong DCF (5) and favorable ROE (4) scores. However, its debt-to-equity (2) and valuation metrics (PE and PB both 2) are weaker. Ares Management relies heavily on a specific edge but scores very low on most metrics, including DCF (1) and valuation ratios (1), signaling significant challenges in profitability and financial stability.
Bankruptcy Risk: Solvency Showdown
The Bank of New York Mellon Corporation’s Altman Z-Score of 0.10 places it in the distress zone, implying high bankruptcy risk; Ares Management’s score is unavailable, preventing direct comparison:

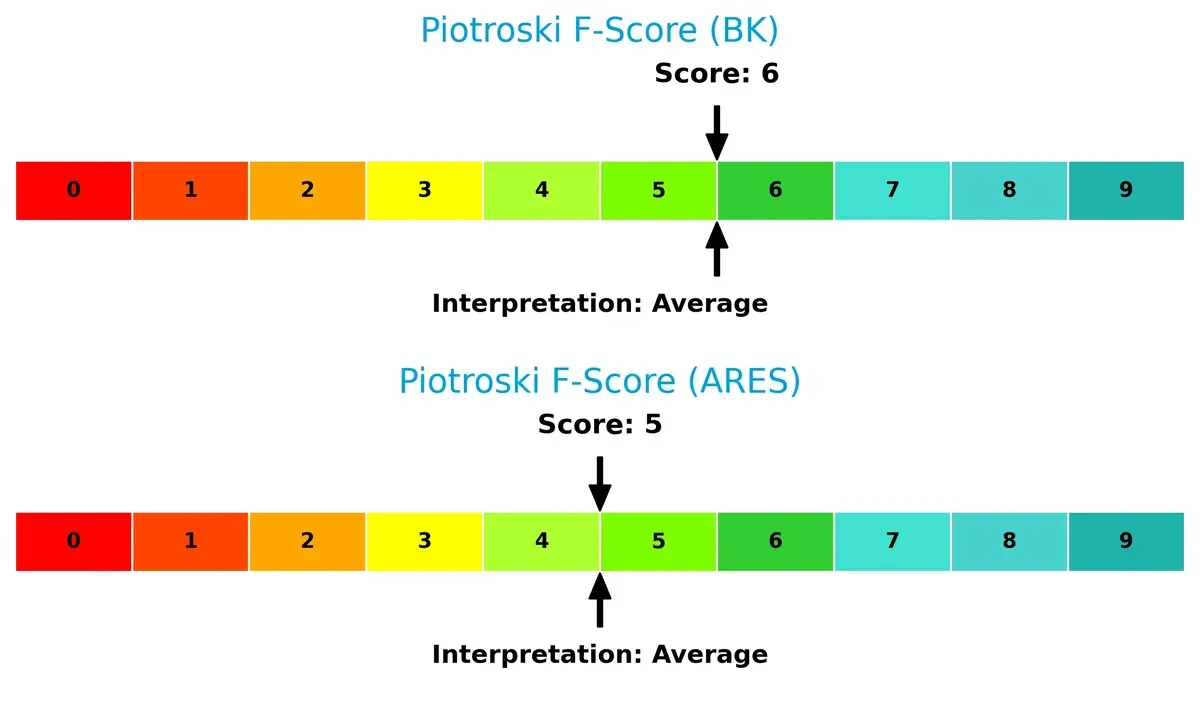
Financial Health: Quality of Operations
Both firms have average Piotroski F-Scores, with The Bank of New York Mellon at 6 and Ares Management at 5. This suggests moderate financial health for both, though neither is in peak condition:
How are the two companies positioned?
This section dissects the operational DNA of BK and ARES by comparing their revenue distribution and internal dynamics, including strengths and weaknesses. The final goal is to confront their economic moats and identify which business model offers the most resilient, sustainable competitive advantage today.
Revenue Segmentation: The Strategic Mix
This visual comparison dissects how The Bank of New York Mellon Corporation and Ares Management Corporation diversify income streams and reveals their primary sector bets:
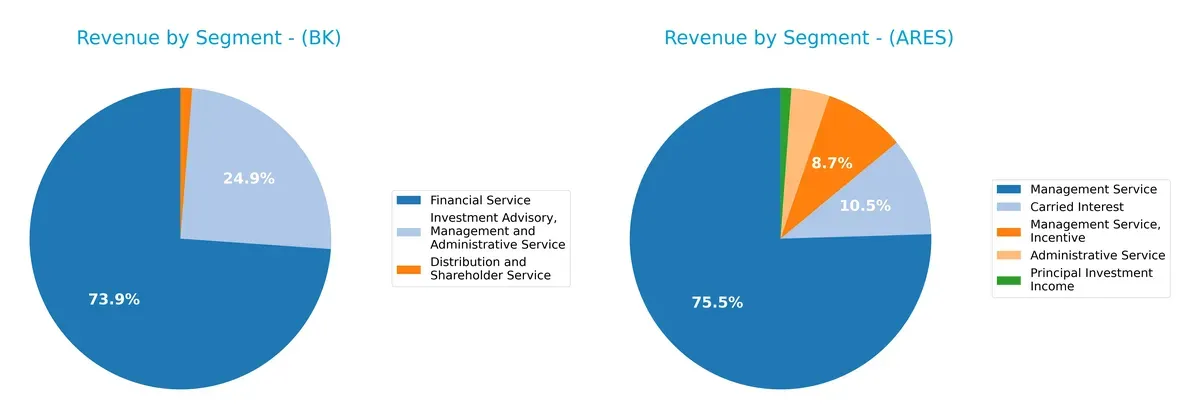
The Bank of New York Mellon anchors 9.3B in Financial Service and 3.1B in Investment Advisory, showing a strong concentration in financial services. In contrast, Ares Management pivots around 3B in Management Service, supported by carried interest and incentives totaling over 750M, reflecting a more diversified asset management model. BNY Mellon’s focus suggests infrastructure dominance, while Ares balances fee and performance revenues, reducing concentration risk.
Strengths and Weaknesses Comparison
This table compares the Strengths and Weaknesses of BK and ARES based on diversification, profitability, financials, innovation, global presence, and market share:
BK Strengths
- Diversified revenue streams across Financial Services and Investment Advisory
- Favorable net margin at 14.14%
- Strong fixed asset turnover at 10.96
- Low debt-to-assets ratio at 7.17%
- Established global presence with significant US and EMEA revenues
ARES Strengths
- Favorable debt-to-equity and debt-to-assets ratios
- High interest coverage ratio indicating strong ability to service debt
- Favorable dividend yield at 2.77%
- Favorable price-to-book ratio
- Focused revenue from Management Service, Carried Interest, and Administrative Service
BK Weaknesses
- Unfavorable weighted average cost of capital at 19.63%
- Low current and quick ratios at 0.7 indicating liquidity risk
- Unfavorable interest coverage at 0.34
- Unfavorable asset turnover at 0.08
- Neutral return on invested capital at 6.38% below WACC
ARES Weaknesses
- Unavailable WACC impedes capital efficiency assessment
- Zero return on equity and ROIC indicating weak profitability
- Unfavorable net margin at 8.15%
- Unfavorable price-to-earnings ratio at 66.62
- Unfavorable current and quick ratios at zero indicating liquidity issues
- Unfavorable asset and fixed asset turnover at zero
BK demonstrates strong diversification and asset utilization but faces liquidity and cost of capital challenges. ARES has strong debt management and dividend yield but struggles with profitability and liquidity metrics. These factors shape each company’s strategic financial priorities.
The Moat Duel: Analyzing Competitive Defensibility
A structural moat is the only reliable shield protecting long-term profits from relentless competitive erosion in any industry:
The Bank of New York Mellon Corporation: Intangible Asset Moat Anchored in Trusted Custody Services
I see BNY Mellon’s primary moat in its intangible assets—trusted global custody and data analytics. This generates stable margins and a growing ROIC trend despite slight value destruction. Innovation in wealth tech may deepen this moat by 2026.
Ares Management Corporation: Niche Alternative Asset Expertise with Market Adaptability
ARES leverages specialized alternative asset management, contrasting BNY Mellon’s broad custody moat. Its financials reveal margin pressure and declining ROIC, signaling a weaker economic moat. Expansion into new credit markets could offset this by 2026.
Legacy Trust vs. Specialized Credit: The Moat Battle
BNY Mellon’s intangible asset moat is wider, backed by scale and trusted client relationships. Ares shows niche strength but suffers from shrinking returns. BNY Mellon stands better positioned to defend market share amid rising competition.
Which stock offers better returns?
The past year saw The Bank of New York Mellon Corporation’s stock surge sharply, while Ares Management Corporation experienced a modest decline, reflecting contrasting market momentum and trading patterns.
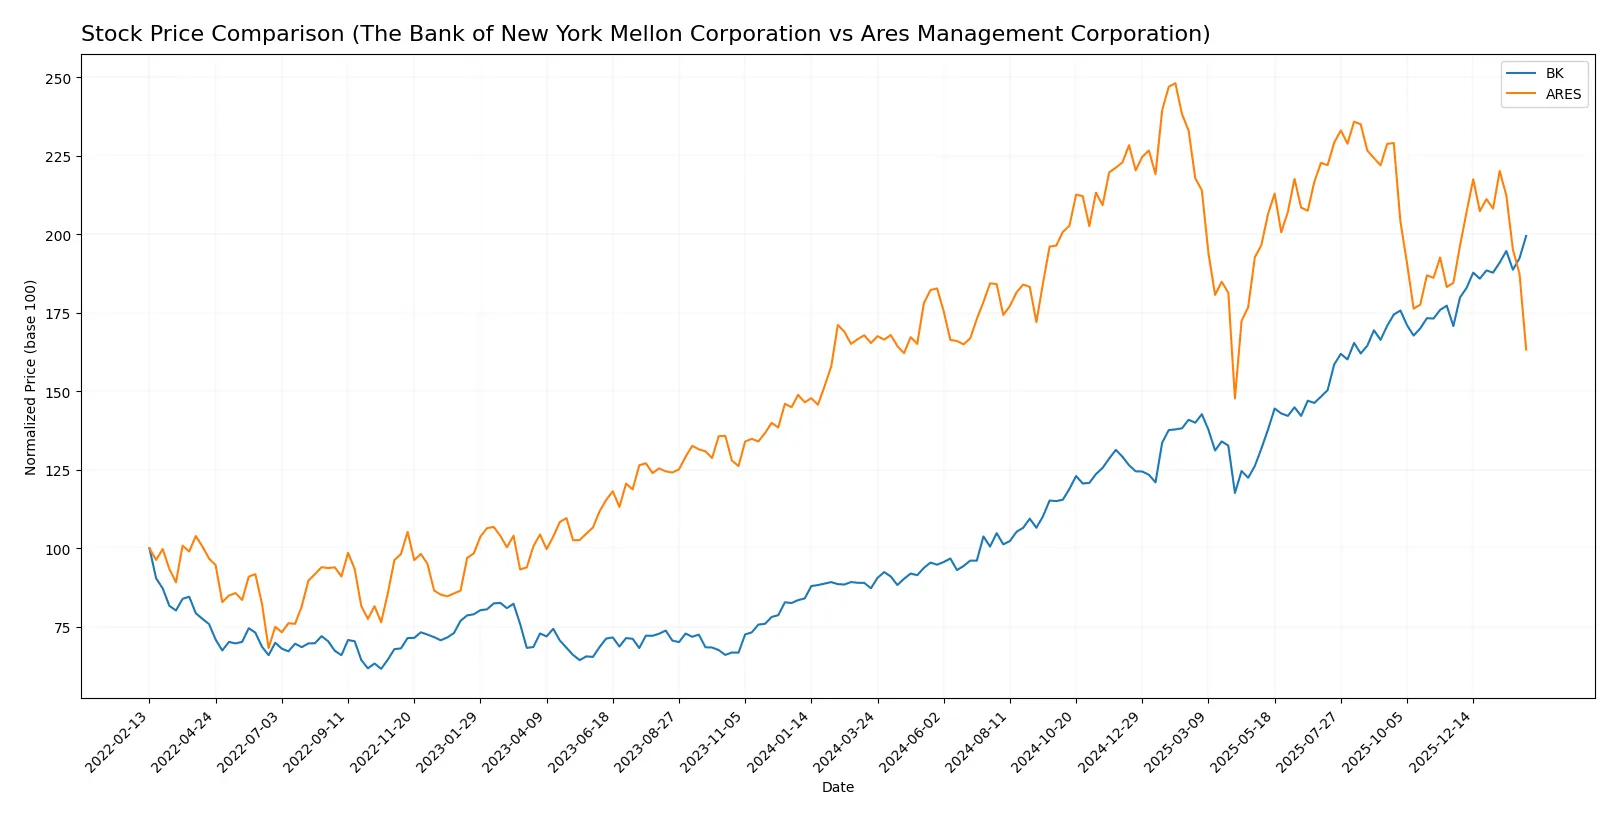
Trend Comparison
The Bank of New York Mellon Corporation’s stock rose 128.49% over the past year, showing a bullish trend with acceleration and a high volatility of 19.58%. Its price peaked at 124.32 and bottomed at 54.41.
Ares Management Corporation’s stock fell 1.25% over the same period, marking a bearish trend with deceleration and a volatility of 18.74%. Its highest price reached 198.22 and lowest was 118.04.
Comparing trends, BK delivered clearly superior market performance with strong upward momentum versus ARES’s mild decline and decelerating trend.
Target Prices
Analysts present a confident target consensus for both The Bank of New York Mellon Corporation and Ares Management Corporation.
| Company | Target Low | Target High | Consensus |
|---|---|---|---|
| The Bank of New York Mellon Corporation | 110 | 143 | 130.25 |
| Ares Management Corporation | 155 | 215 | 187.29 |
The target consensus for BK suggests modest upside from its current 124.32 price, reflecting steady sector fundamentals. ARES shows stronger growth expectations, with targets well above its current 130.46 price, indicating bullish analyst sentiment.

Don’t Let Luck Decide Your Entry Point
Optimize your entry points with our advanced ProRealTime indicators. You’ll get efficient buy signals with precise price targets for maximum performance. Start outperforming now!
How do institutions grade them?
The Bank of New York Mellon Corporation Grades
Below is a summary of recent institutional grades for The Bank of New York Mellon Corporation:
| Grading Company | Action | New Grade | Date |
|---|---|---|---|
| Keefe, Bruyette & Woods | Maintain | Outperform | 2026-01-14 |
| Citigroup | Maintain | Neutral | 2026-01-14 |
| RBC Capital | Maintain | Sector Perform | 2026-01-14 |
| Wells Fargo | Maintain | Equal Weight | 2026-01-14 |
| Morgan Stanley | Maintain | Overweight | 2026-01-14 |
| TD Cowen | Maintain | Buy | 2026-01-07 |
| Truist Securities | Upgrade | Buy | 2026-01-07 |
| Barclays | Maintain | Overweight | 2026-01-05 |
| Morgan Stanley | Maintain | Overweight | 2025-12-17 |
| TD Cowen | Maintain | Buy | 2025-10-20 |
Ares Management Corporation Grades
Below is a summary of recent institutional grades for Ares Management Corporation:
| Grading Company | Action | New Grade | Date |
|---|---|---|---|
| Oppenheimer | Maintain | Outperform | 2026-02-06 |
| Barclays | Maintain | Overweight | 2026-02-06 |
| TD Cowen | Maintain | Buy | 2026-01-14 |
| UBS | Maintain | Neutral | 2026-01-13 |
| Barclays | Maintain | Overweight | 2026-01-09 |
| Barclays | Maintain | Overweight | 2025-12-12 |
| Keefe, Bruyette & Woods | Maintain | Outperform | 2025-11-04 |
| TD Cowen | Maintain | Buy | 2025-11-04 |
| Morgan Stanley | Maintain | Equal Weight | 2025-10-21 |
| Oppenheimer | Upgrade | Outperform | 2025-10-14 |
Which company has the best grades?
Both companies receive strong grades from reputable institutions, with consistent “Outperform,” “Buy,” and “Overweight” ratings. Ares Management shows more recent upgrades and repeated “Outperform” grades, indicating stronger institutional confidence. Investors may view Ares as having a slightly more favorable consensus.
Risks specific to each company
The following categories identify the critical pressure points and systemic threats facing both firms in the 2026 market environment:
1. Market & Competition
The Bank of New York Mellon Corporation
- Operates in traditional asset management with broad service lines and established client base. Faces pressure from fintech innovation and market volatility.
Ares Management Corporation
- Focuses on alternative asset management, direct lending, and private equity. Faces competition from specialized firms and market cyclicality.
2. Capital Structure & Debt
The Bank of New York Mellon Corporation
- Moderate debt-to-equity ratio (0.76), but weak interest coverage (0.34) signals potential stress servicing debt.
Ares Management Corporation
- Minimal or no reported debt, strong interest coverage (infinite), reflecting low financial leverage risk.
3. Stock Volatility
The Bank of New York Mellon Corporation
- Beta of 1.09 suggests moderate market correlation and volatility near the sector average.
Ares Management Corporation
- Higher beta at 1.54 indicates greater stock price sensitivity to market swings and elevated risk.
4. Regulatory & Legal
The Bank of New York Mellon Corporation
- Subject to extensive US and international financial regulations, increasing compliance costs and risk of fines.
Ares Management Corporation
- Operates across US, Europe, and Asia, facing complex regulatory environments with potential cross-border legal risks.
5. Supply Chain & Operations
The Bank of New York Mellon Corporation
- Relies heavily on technology infrastructure and data management; vulnerable to cyber risks and operational disruptions.
Ares Management Corporation
- Operations concentrated in alternative asset management sectors; risks include fund performance and operational execution.
6. ESG & Climate Transition
The Bank of New York Mellon Corporation
- Increasing pressure to integrate ESG in investment products and reduce carbon footprint; reputational risks.
Ares Management Corporation
- Faces growing demand for ESG-compliant assets and sustainable investing, challenging capital allocation strategies.
7. Geopolitical Exposure
The Bank of New York Mellon Corporation
- Global presence exposes it to geopolitical instability, currency risks, and trade tensions impacting asset flows.
Ares Management Corporation
- International operations subject to geopolitical risks, especially in Asia and Europe, affecting deal flow and valuations.
Which company shows a better risk-adjusted profile?
The Bank of New York Mellon faces its biggest risk in high financial leverage stress, notably poor interest coverage, despite stable market positioning. Ares Management’s principal risk lies in elevated stock volatility and weaker profitability metrics. BK’s stable core operations and moderate beta offer a better risk-adjusted profile. Ares’s higher beta and unfavorable P/E ratio highlight elevated market and valuation risks. The contrast in interest coverage and leverage underlines BK’s more cautious capital structure amid market uncertainties.
Final Verdict: Which stock to choose?
The Bank of New York Mellon Corporation (BK) stands out for its unmatched efficiency in capital allocation and steady profitability growth. Its ability to generate increasing returns despite a challenging cost of capital environment reveals operational strength. The main point of vigilance remains its liquidity ratios, which suggest careful monitoring is warranted. BK suits portfolios seeking stable income with moderate growth potential.
Ares Management Corporation (ARES) leverages a strategic moat rooted in asset management expertise and recurring fee revenues, providing resilience amid market volatility. Its lower financial leverage and stronger interest coverage offer a safer profile compared to BK. However, its declining ROIC trend and valuation premium call for caution. ARES fits investors focused on growth at a reasonable price with a tolerance for valuation risk.
If you prioritize operational efficiency and income stability, BK is the compelling choice due to its improving profitability and cash flow generation despite liquidity concerns. However, if you seek exposure to alternative asset management with better financial safety and are comfortable with valuation risk, ARES offers superior downside protection and strategic moat advantages. Both present analytical scenarios that cater to distinct investor profiles.
Disclaimer: Investment carries a risk of loss of initial capital. The past performance is not a reliable indicator of future results. Be sure to understand risks before making an investment decision.
Go Further
I encourage you to read the complete analyses of The Bank of New York Mellon Corporation and Ares Management Corporation to enhance your investment decisions: