Home > Comparison > Financial Services > ARES vs STT
The strategic rivalry between Ares Management Corporation and State Street Corporation shapes the financial services landscape. Ares operates as a diversified alternative asset manager focusing on credit, private equity, and real estate. In contrast, State Street functions as a global institutional investment servicer and asset manager with broad custodial and trading capabilities. This analysis pits Ares’ growth-driven model against State Street’s scale and stability to identify the superior risk-adjusted investment for a balanced portfolio.
Table of contents
Companies Overview
Ares Management Corporation and State Street Corporation both hold significant roles in the asset management industry, shaping investment landscapes globally.
Ares Management Corporation: Alternative Asset Specialist
Ares Management Corporation stands as a leader in alternative asset management across the US, Europe, and Asia. Its core revenue derives from managing credit funds, direct lending, private equity, and real estate investments. In 2026, Ares sharpens its strategic focus on control or majority stakes in under-capitalized companies and middle-market real estate financing, emphasizing active asset repositioning and origination.
State Street Corporation: Institutional Services Powerhouse
State Street Corporation commands a diversified financial services platform tailored to institutional investors worldwide. It earns revenue via custody, fund administration, trading services, and investment management, including its renowned SPDR ETFs. In 2026, State Street prioritizes integrated portfolio management, risk analytics, and ESG investing solutions, reinforcing its role as a comprehensive service provider for institutional clients.
Strategic Collision: Similarities & Divergences
While both companies serve institutional investors, Ares embraces a control-oriented, direct investment model, contrasting with State Street’s broad, service-driven infrastructure. They compete primarily in the asset management space, with Ares targeting alternative assets and private equity, and State Street excelling in custody and fund administration. Their distinct investment profiles reflect divergent risk exposures and client engagements within the evolving financial ecosystem.
Income Statement Comparison
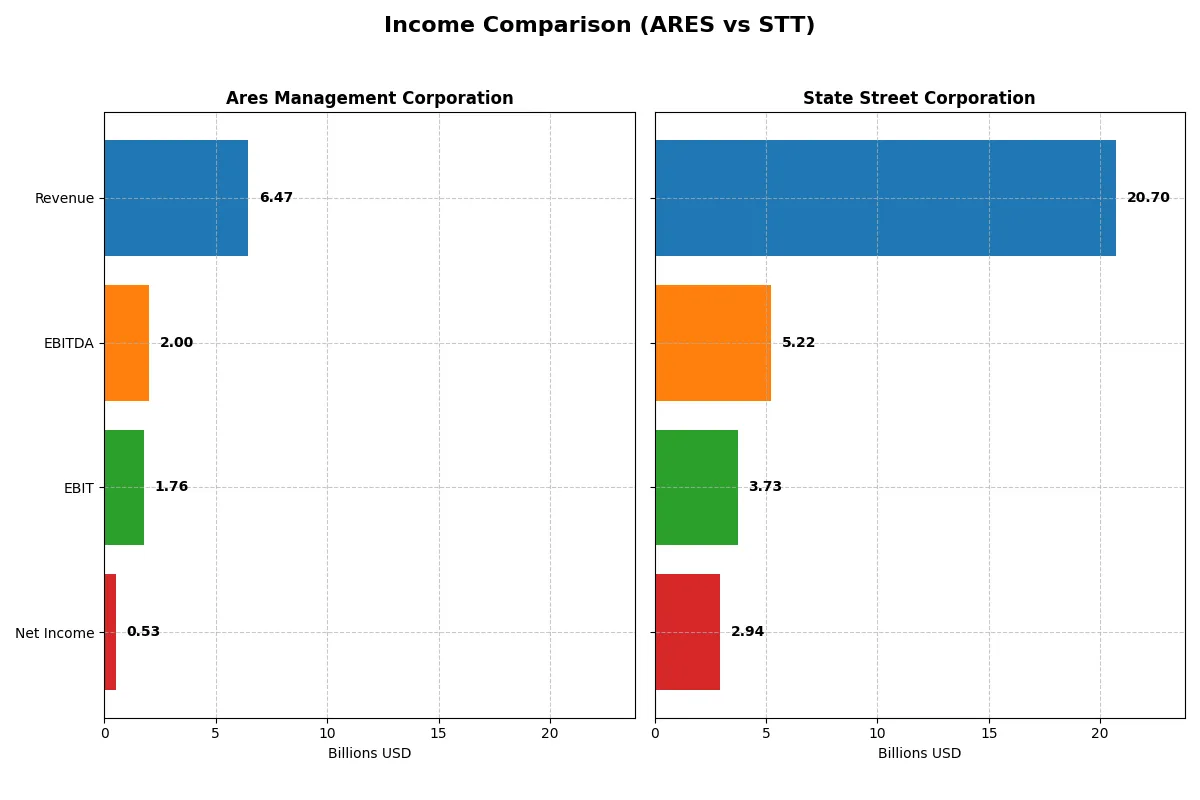
The following data dissects the core profitability and scalability of both corporate engines to reveal who dominates the bottom line:
| Metric | Ares Management Corporation (ARES) | State Street Corporation (STT) |
|---|---|---|
| Revenue | 6.47B | 20.7B |
| Cost of Revenue | 1.39B | 6.79B |
| Operating Expenses | 1.05B | 10.18B |
| Gross Profit | 1.94B | 13.91B |
| EBITDA | 2.00B | 5.22B |
| EBIT | 1.76B | 3.73B |
| Interest Expense | 0 | 8.68B |
| Net Income | 527M | 2.95B |
| EPS | 1.96 | 9.56 |
| Fiscal Year | 2025 | 2025 |
Income Statement Analysis: The Bottom-Line Duel
This income statement comparison exposes which company runs a more efficient and profitable core business engine in 2025.
Ares Management Corporation Analysis
Ares Management’s revenue surged 67% in 2025, reaching $6.47B, reflecting strong top-line growth. However, net income dipped to $527M, pressuring net margin to 8.15%. Despite a solid 30% gross margin, its EBIT fell 22%, signaling margin compression and less operating efficiency in the latest year.
State Street Corporation Analysis
State Street posted $20.7B in revenue for 2025, down 5.8% from 2024, yet grew net income 9.7% to $2.95B. Its hefty 67% gross margin and 14.2% net margin highlight robust profitability. EBIT expanded nearly 10%, showing improved operational leverage despite revenue softness.
Margin Strength vs. Revenue Scale
State Street dominates on absolute profits and margin strength, boasting a far superior net margin and EBIT growth. Ares shows impressive revenue momentum but struggles with margin deterioration and net income declines. For investors, State Street’s consistent profitability profile offers a more resilient earnings foundation.
Financial Ratios Comparison
These vital ratios act as a diagnostic tool to expose the underlying fiscal health, valuation premiums, and capital efficiency of the two companies:
| Ratios | Ares Management Corporation (ARES) | State Street Corporation (STT) |
|---|---|---|
| ROE | 13.1% (2024) | 10.6% (2024) |
| ROIC | 4.0% (2024) | 2.9% (2024) |
| P/E | 75.6 (2024) | 10.9 (2024) |
| P/B | 9.9 (2024) | 1.15 (2024) |
| Current Ratio | 0.98 (2024) | 0.51 (2024) |
| Quick Ratio | 0.98 (2024) | 0.51 (2024) |
| D/E | 3.71 (2024) | 1.45 (2024) |
| Debt-to-Assets | 52.8% (2024) | 10.4% (2024) |
| Interest Coverage | 0.97 (2024) | 0.37 (2024) |
| Asset Turnover | 0.16 (2024) | 0.062 (2024) |
| Fixed Asset Turnover | 5.64 (2024) | 6.22 (2024) |
| Payout Ratio | 283% (2024) | 38% (2024) |
| Dividend Yield | 3.7% (2024) | 3.5% (2024) |
| Fiscal Year | 2024 | 2024 |
Efficiency & Valuation Duel: The Vital Signs
Financial ratios serve as a company’s DNA, revealing hidden risks and operational strengths that numbers alone can’t express.
Ares Management Corporation
Ares shows moderate profitability with an 8.15% net margin but a concerning 0% ROE, signaling weak shareholder returns. The stock trades at a stretched P/E of 66.62, suggesting high valuation risk. However, it offers a 2.77% dividend yield, supporting income investors despite operational headwinds.
State Street Corporation
State Street posts a stronger 14.23% net margin and a decent 10.58% ROE, reflecting more efficient capital use. Its P/E of 12.27 appears attractively low, indicating reasonable valuation. The 2.42% dividend yield complements its slightly favorable ratio profile, balancing income and growth potential.
Valuation Stretch vs. Operational Efficiency
State Street offers better profitability and a more balanced valuation, blending risk and reward effectively. Ares appears overvalued with weaker returns but pays a higher dividend. Investors seeking operational efficiency may lean toward State Street, while income-focused profiles might consider Ares’ yield despite its stretched valuation.
Which one offers the Superior Shareholder Reward?
I see Ares Management offers a higher dividend yield at 4.7% in 2025, but with a payout ratio exceeding 180%, signaling potential sustainability concerns. State Street yields a modest 2.4% with a conservative 30% payout ratio. Ares also pursues aggressive buybacks, boosting total returns but risking cash flow strain. State Street’s steadier dividend and moderate buybacks suggest a more sustainable model. For 2026, I favor State Street’s balanced distribution, which better supports long-term shareholder value amid market cycles.
Comparative Score Analysis: The Strategic Profile
The radar chart reveals the fundamental DNA and trade-offs of Ares Management Corporation and State Street Corporation, highlighting their financial strengths and vulnerabilities:
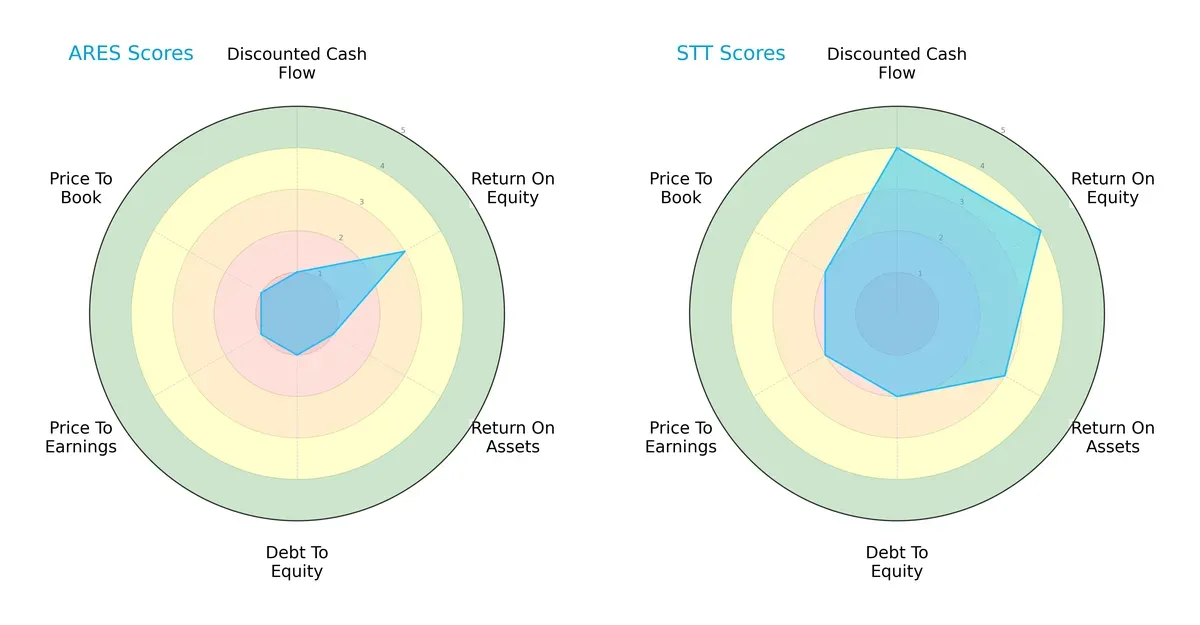
State Street dominates across most dimensions with a balanced profile: strong DCF (4), ROE (4), and ROA (3) scores reflect operational efficiency and growth potential. Ares lags significantly in DCF (1), ROA (1), and leverage control (debt/equity 1), showing reliance on moderate ROE (3) alone. State Street’s moderate debt management and valuation scores (2) indicate areas for caution but still outperform Ares’s uniformly very unfavorable metrics (all scores 1 except ROE at 3). State Street offers a more consistent and resilient investment proposition.
Financial Health: Quality of Operations
Ares scores a Piotroski F-Score of 5, while State Street registers slightly lower at 4:
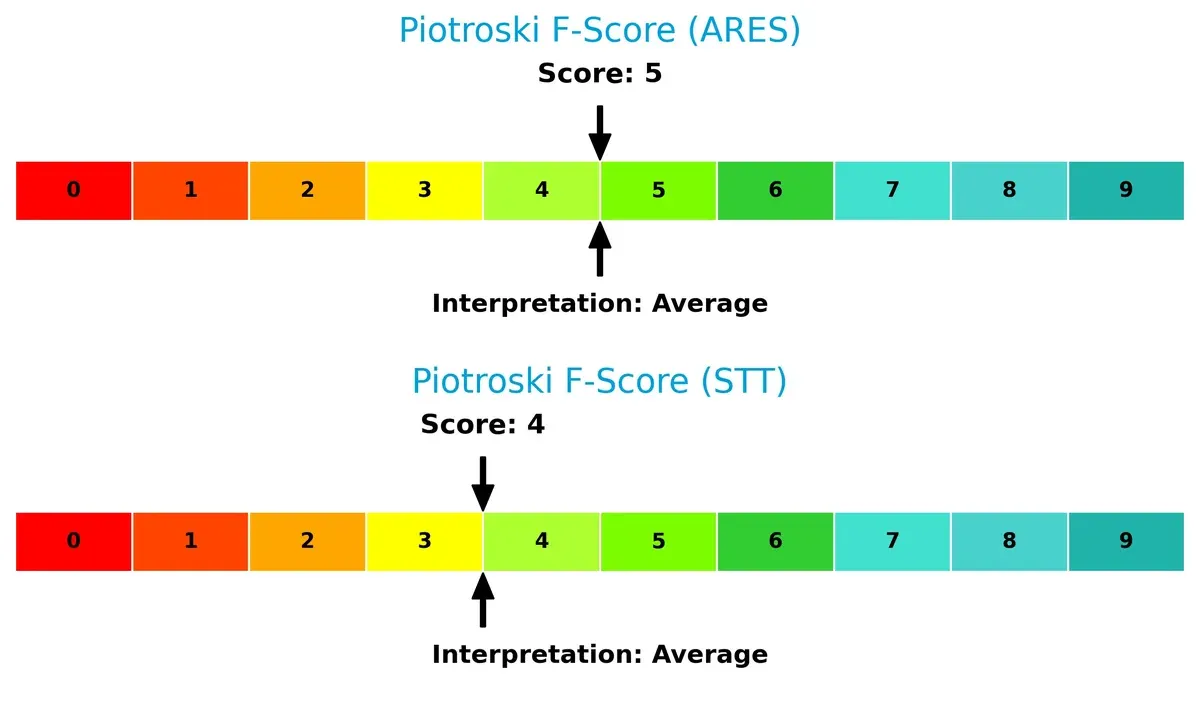
Both companies reflect average financial health with no clear dominance. Ares’s marginally higher score suggests relatively better internal financial stability. However, neither company shows peak financial strength, signaling the need for investors to monitor operational execution closely.
Bankruptcy Risk: Solvency Showdown
Data on Altman Z-Scores is incomplete for Ares, so I omit this section for accuracy and prudence.
How are the two companies positioned?
This section dissects Ares and State Street’s operational DNA by comparing revenue distribution and internal dynamics. The goal is to confront their economic moats and identify which model offers the most resilient competitive advantage today.
Revenue Segmentation: The Strategic Mix
This revenue comparison dissects how Ares Management Corporation and State Street Corporation diversify their income streams and reveals their primary sector bets:
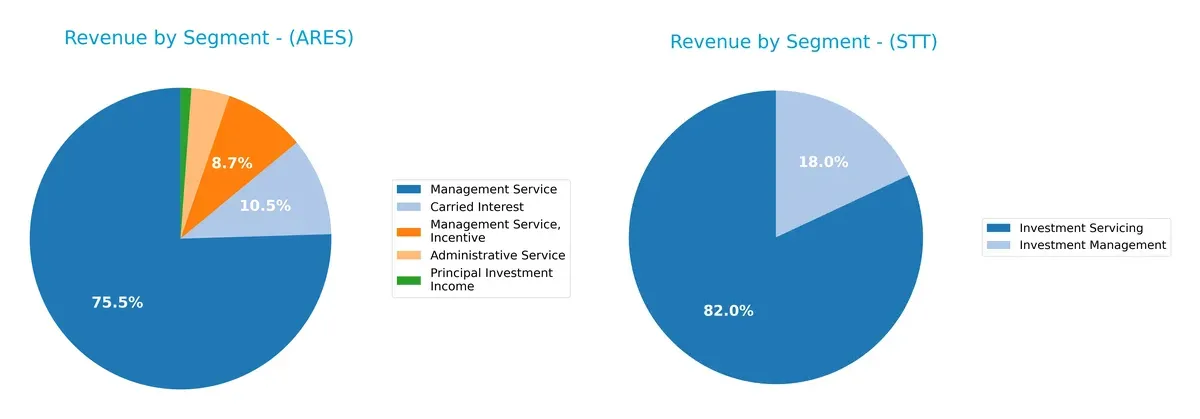
Ares pivots on Management Service, generating $2.99B in 2024, anchoring its revenue with significant contributions from Carried Interest ($417M). State Street dwarfs with a clear Investment Servicing dominance at $10.7B, complemented by $2.34B in Investment Management. Ares shows moderate diversification across niche financial services, while State Street’s concentrated servicing base signals infrastructure dominance but exposes it to servicing market cyclicality.
Strengths and Weaknesses Comparison
This table compares the Strengths and Weaknesses of Ares Management Corporation and State Street Corporation:
Ares Strengths
- Diverse revenue streams including Administrative, Carried Interest, and Management Services
- Favorable debt-to-equity and interest coverage ratios
- Dividend yield at 2.77%
State Street Strengths
- Strong net margin at 14.23% and favorable PE ratio of 12.27
- Robust global presence with significant US and Non-US revenue
- Quick ratio favorable at 3.59 and strong fixed asset turnover
Ares Weaknesses
- Unfavorable ROE and ROIC, signaling low capital efficiency
- Zero current and quick ratios suggest liquidity concerns
- Unfavorable asset turnover metrics
- PE ratio high at 66.62, indicating valuation risk
State Street Weaknesses
- Unfavorable debt-to-equity ratio at 1.07 and low interest coverage of 0.43
- Current ratio unfavorable despite quick ratio strength
- ROIC and WACC both unfavorable, implying capital cost issues
Both companies exhibit distinct strengths: Ares excels in diverse revenue streams and conservative leverage, while State Street shows superior profitability and global scale. However, each faces challenges in liquidity and capital efficiency that could influence their strategic focus.
The Moat Duel: Analyzing Competitive Defensibility
A structural moat is the only reliable barrier protecting long-term profits from relentless competition erosion. Let’s dissect the moats of two asset management giants:
Ares Management Corporation: Diversified Alternative Asset Moat
Ares leverages broad alternative asset expertise, creating switching costs through complex credit and private equity strategies. Its financials show margin stability despite recent profit growth challenges. New market expansion and product innovation in direct lending could deepen its moat in 2026.
State Street Corporation: Scale and Data-Driven Custody Moat
State Street’s moat rests on scale and intangible assets like advanced risk analytics and custody services, contrasting Ares’ alternative focus. It commands higher margins but faces pressure from rising interest expenses. Expanding ESG and ETF offerings may boost defensibility and disrupt traditional asset managers.
Scale and Specialization: The Moat Face-Off
State Street’s scale and data capabilities offer a wider moat than Ares’ niche alternative strategy. However, both show declining ROIC trends, signaling moat erosion risks. State Street remains better positioned to defend market share through innovation and diversified service offerings.
Which stock offers better returns?
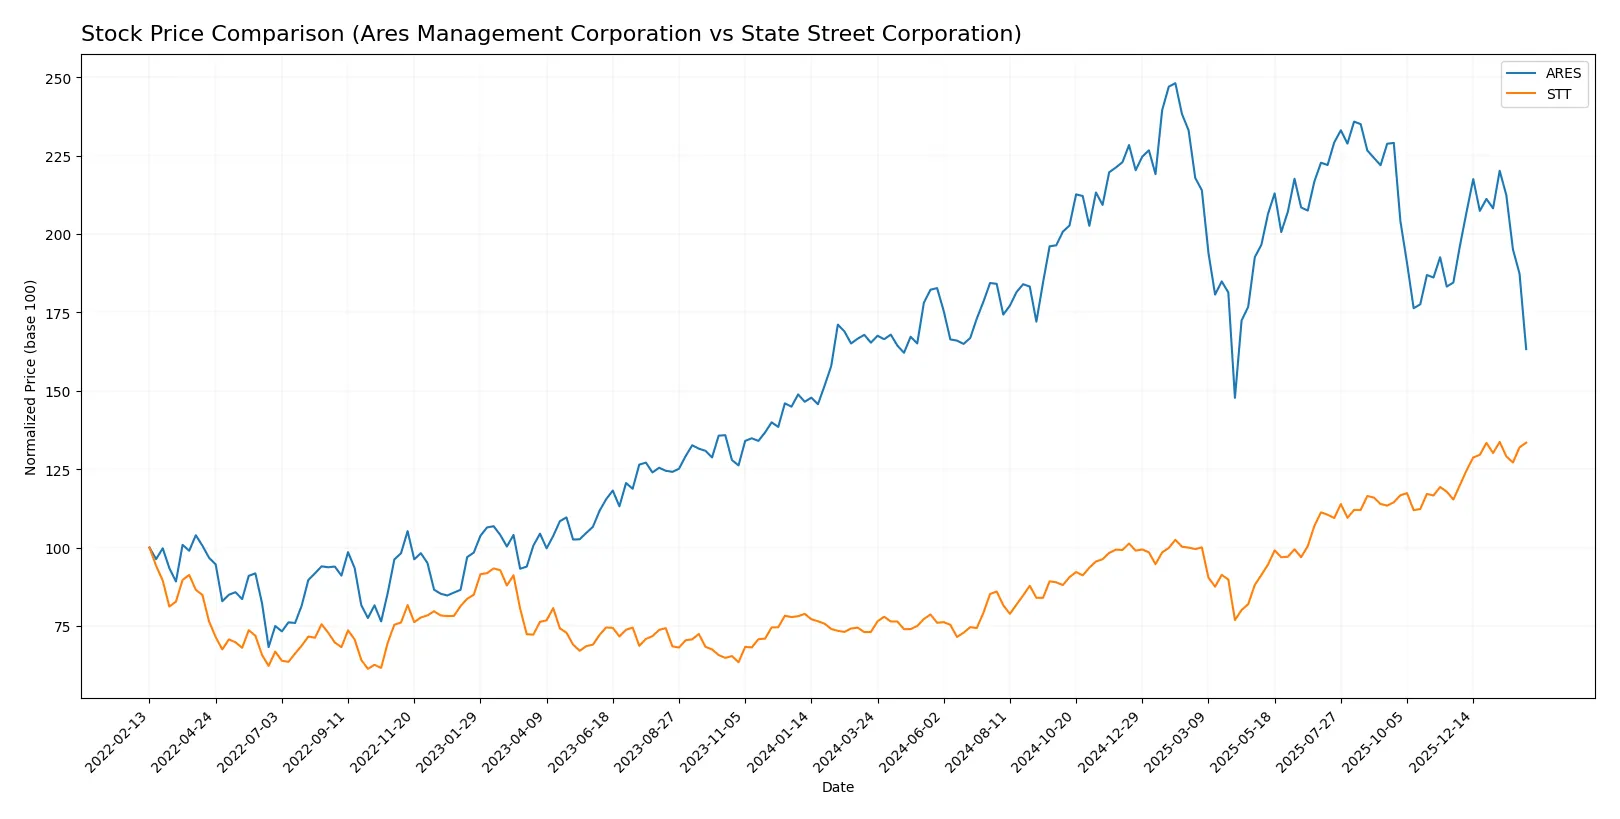
The past year shows starkly contrasting price movements for Ares Management Corporation and State Street Corporation, highlighting divergent market dynamics and investor sentiment.
Trend Comparison
Ares Management Corporation’s stock declined 1.25% over the past 12 months, marking a bearish trend with decelerating momentum. It peaked at 198.22 and bottomed at 118.04, showing moderate volatility (18.74 std deviation).
State Street Corporation surged 82.55% over the same period, reflecting a bullish trend with accelerating strength. Its price ranged between 70.91 and 132.57, with volatility slightly lower at 17.07 std deviation.
State Street’s stock delivered markedly higher returns than Ares, outperforming significantly in market performance over the last year.
Target Prices
The analyst consensus points to significant upside potential for these asset management firms.
| Company | Target Low | Target High | Consensus |
|---|---|---|---|
| Ares Management Corporation | 155 | 215 | 187.29 |
| State Street Corporation | 128 | 164 | 142.17 |
Analysts expect Ares to appreciate roughly 43% from its current 130.46 price, reflecting confidence in its diversified credit and private equity strategy. State Street’s target consensus suggests a more modest 7% upside, consistent with its established market position and steady cash flow generation.

Don’t Let Luck Decide Your Entry Point
Optimize your entry points with our advanced ProRealTime indicators. You’ll get efficient buy signals with precise price targets for maximum performance. Start outperforming now!
How do institutions grade them?
The following grades from reputable firms compare Ares Management Corporation and State Street Corporation:
Ares Management Corporation Grades
This table shows recent grades and rating actions from top-tier institutions for Ares Management Corporation.
| Grading Company | Action | New Grade | Date |
|---|---|---|---|
| Oppenheimer | Maintain | Outperform | 2026-02-06 |
| Barclays | Maintain | Overweight | 2026-02-06 |
| TD Cowen | Maintain | Buy | 2026-01-14 |
| UBS | Maintain | Neutral | 2026-01-13 |
| Barclays | Maintain | Overweight | 2026-01-09 |
| Barclays | Maintain | Overweight | 2025-12-12 |
| Keefe, Bruyette & Woods | Maintain | Outperform | 2025-11-04 |
| TD Cowen | Maintain | Buy | 2025-11-04 |
| Morgan Stanley | Maintain | Equal Weight | 2025-10-21 |
| Oppenheimer | Upgrade | Outperform | 2025-10-14 |
State Street Corporation Grades
This table presents recent institutional grades and rating changes for State Street Corporation.
| Grading Company | Action | New Grade | Date |
|---|---|---|---|
| Morgan Stanley | Maintain | Overweight | 2026-01-20 |
| Truist Securities | Downgrade | Hold | 2026-01-07 |
| TD Cowen | Maintain | Buy | 2026-01-07 |
| Barclays | Downgrade | Equal Weight | 2026-01-05 |
| Citigroup | Maintain | Buy | 2025-12-30 |
| Citigroup | Maintain | Buy | 2025-10-24 |
| Keefe, Bruyette & Woods | Maintain | Outperform | 2025-10-20 |
| Truist Securities | Maintain | Buy | 2025-10-20 |
| Morgan Stanley | Maintain | Overweight | 2025-10-20 |
| Wells Fargo | Maintain | Overweight | 2025-10-20 |
Which company has the best grades?
Ares Management consistently receives Outperform and Overweight ratings, including recent upgrades. State Street shows more mixed signals with recent downgrades and a Hold rating. Investors may see Ares as having stronger institutional confidence.
Risks specific to each company
The following categories identify the critical pressure points and systemic threats facing both firms in the 2026 market environment:
1. Market & Competition
Ares Management Corporation
- Faces pressure from alternative asset managers and credit market volatility.
State Street Corporation
- Competes broadly in institutional investment services and ETF markets with diverse rivals.
2. Capital Structure & Debt
Ares Management Corporation
- Strong debt metrics, low leverage, excellent interest coverage.
State Street Corporation
- Higher debt-to-equity ratio with weak interest coverage signals financial risk.
3. Stock Volatility
Ares Management Corporation
- Beta at 1.54 indicates higher sensitivity to market swings.
State Street Corporation
- Beta of 1.44 shows slightly lower volatility but still above market average.
4. Regulatory & Legal
Ares Management Corporation
- Exposure to alternative asset regulations and credit market compliance.
State Street Corporation
- Heavily regulated due to custody and investment management services worldwide.
5. Supply Chain & Operations
Ares Management Corporation
- Operational risk tied to credit and private equity deal flow.
State Street Corporation
- Complex global operations with risks in data management and trading platforms.
6. ESG & Climate Transition
Ares Management Corporation
- Growing pressure to align investments with ESG criteria in real estate and credit.
State Street Corporation
- Focuses on ESG products but faces scrutiny over fiduciary responsibilities and climate risk.
7. Geopolitical Exposure
Ares Management Corporation
- International presence in US, Europe, Asia exposes it to regional instability.
State Street Corporation
- Global institutional client base subjects it to geopolitical and currency risks.
Which company shows a better risk-adjusted profile?
Ares Management’s most impactful risk stems from market volatility and earnings uncertainty due to its high P/E and weak profitability metrics. State Street’s primary concern is its leveraged capital structure coupled with poor interest coverage. Despite this, State Street displays a slightly more favorable overall financial rating and a more balanced risk profile. Recent financial scores highlight State Street’s vulnerability in debt servicing but also indicate better operational efficiency than Ares. Hence, I see State Street as having a better risk-adjusted profile in 2026.
Final Verdict: Which stock to choose?
Ares Management’s superpower lies in its ability to generate strong revenue growth amid challenging conditions, driven by operational efficiency and disciplined capital allocation. Its point of vigilance is the declining return on invested capital, which could pressure long-term value creation. Ares suits portfolios aiming for aggressive growth with a tolerance for volatility.
State Street stands out with a strategic moat rooted in its diversified asset servicing and recurring fee income, providing steady cash flow and resilience. Relative to Ares, it offers better income stability and a more favorable valuation profile. State Street fits well in GARP portfolios seeking balanced growth and income.
If you prioritize high-growth potential and can absorb periods of ROIC weakness, Ares Management is the compelling choice due to its revenue momentum and operational focus. However, if you seek income reliability and a defensive edge in financial services, State Street offers better stability and a proven moat despite some valuation risks. Both demand careful risk assessment in today’s market environment.
Disclaimer: Investment carries a risk of loss of initial capital. The past performance is not a reliable indicator of future results. Be sure to understand risks before making an investment decision.
Go Further
I encourage you to read the complete analyses of Ares Management Corporation and State Street Corporation to enhance your investment decisions: