Home > Comparison > Financial Services > KKR vs ARES
The strategic rivalry between KKR & Co. Inc. and Ares Management Corporation shapes the asset management sector’s evolution. KKR operates as a global private equity and real estate powerhouse with diversified holdings across industries and geographies. In contrast, Ares focuses on alternative asset management with strength in credit markets and direct lending. This analysis will identify which firm’s business model offers superior risk-adjusted returns for a diversified portfolio in today’s dynamic financial landscape.
Table of contents
Companies Overview
KKR & Co. Inc. and Ares Management Corporation shape the global asset management landscape with distinct strategies and scale.
KKR & Co. Inc.: Global Private Equity Powerhouse
KKR dominates the private equity and real estate investment space with a broad focus on leveraged buyouts and growth equity. It generates revenue by acquiring controlling stakes across diverse industries worldwide. In 2026, KKR emphasizes strategic expansion in technology, energy, and infrastructure sectors, leveraging its global footprint and long-term investment horizon.
Ares Management Corporation: Diversified Alternative Asset Manager
Ares Management specializes in alternative asset management, including tradable credit, direct lending, private equity, and real estate. It earns fees by managing institutional and retail investment funds across multiple credit markets. In 2026, Ares prioritizes control investments and middle-market financing solutions, aiming to deepen its position in credit and real estate segments.
Strategic Collision: Similarities & Divergences
KKR and Ares share a focus on alternative assets but diverge in business philosophy: KKR seeks controlling stakes with a long-term, buyout-driven approach, while Ares blends credit and direct lending with flexible control investments. Their primary battleground lies in middle-market private equity and real estate. KKR offers a broad industry reach and scale; Ares delivers targeted credit expertise and diversified income streams, marking distinct investment profiles.
Income Statement Comparison
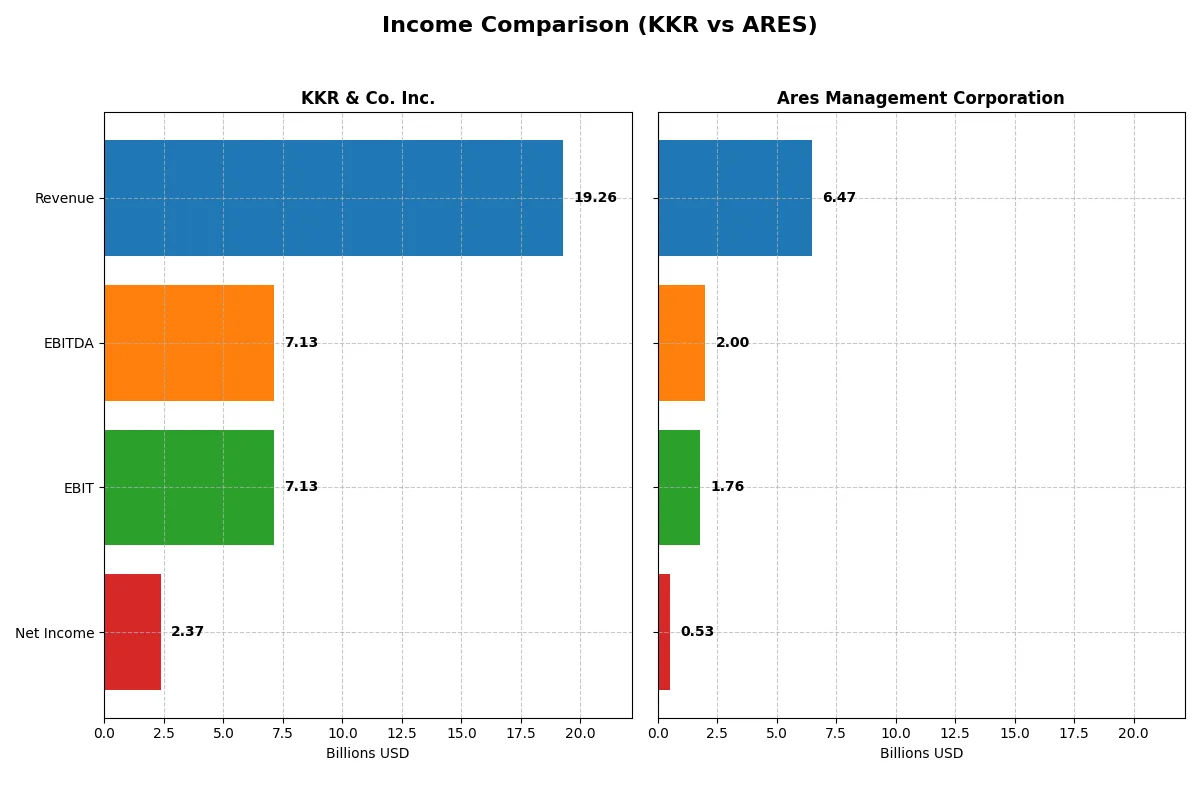
The following data dissects the core profitability and scalability of both corporate engines to reveal who dominates the bottom line:
| Metric | KKR & Co. Inc. (KKR) | Ares Management Corporation (ARES) |
|---|---|---|
| Revenue | 19.3B | 6.5B |
| Cost of Revenue | 11.2B | 1.4B |
| Operating Expenses | 7.6B | 1.0B |
| Gross Profit | 8.1B | 1.9B |
| EBITDA | 7.1B | 2.0B |
| EBIT | 7.1B | 1.8B |
| Interest Expense | 2.3B | 0 |
| Net Income | 2.4B | 527M |
| EPS | 2.52 | 1.96 |
| Fiscal Year | 2025 | 2025 |
Income Statement Analysis: The Bottom-Line Duel
This income statement comparison reveals which company runs a more efficient and sustainable profit engine in a challenging market environment.
KKR & Co. Inc. Analysis
KKR’s revenue rose 20% from 2021 to 2025 but fell 11% in the latest year to $19.3B. Net income declined sharply, dropping nearly 50% over five years, with 2025’s $2.4B reflecting margin pressures. Despite a strong 42% gross margin, a shrinking net margin of 12.3% signals rising costs and lower profit conversion. The recent margin contraction and 29% EPS decline highlight waning operational momentum.
Ares Management Corporation Analysis
Ares grew revenue 54% from 2021 to 2025, accelerating 67% in the latest year to $6.5B. Net income rose 29% over five years but tumbled 32% last year to $527M. Its 30% gross margin and 8.2% net margin are lower than KKR’s but more stable. The company’s sharp revenue growth contrasts with shrinking profitability and a modest 5% EPS drop, reflecting operational leverage challenges amid expanding scale.
Margin Strength vs. Growth Trajectory
KKR exhibits superior margins but suffers from declining net income and earnings per share, undermining its profitability edge. Ares shows robust revenue growth and improving net income over the period, though with lower margins and recent profitability setbacks. For investors, KKR offers margin resilience, while Ares presents growth potential tempered by margin compression, demanding careful risk consideration.
Financial Ratios Comparison
These vital ratios act as a diagnostic tool to expose the underlying fiscal health, valuation premiums, and capital efficiency of the companies compared below:
| Ratios | KKR & Co. Inc. (KKR) | Ares Management Corporation (ARES) |
|---|---|---|
| ROE | 13.01% (2024) | 13.09% (2024) |
| ROIC | 0.25% (2024) | 3.96% (2024) |
| P/E | 42.65 (2024) | 75.61 (2024) |
| P/B | 5.55 (2024) | 9.89 (2024) |
| Current Ratio | 4.12 (2024) | 0.98 (2024) |
| Quick Ratio | 4.12 (2024) | 0.98 (2024) |
| D/E | 2.15 (2024) | 3.71 (2024) |
| Debt-to-Assets | 14.11% (2024) | 52.84% (2024) |
| Interest Coverage | 0.28 (2024) | 0.97 (2024) |
| Asset Turnover | 6.01% (2024) | 15.61% (2024) |
| Fixed Asset Turnover | 12.23 (2024) | 5.64 (2024) |
| Payout ratio | 19.90% (2024) | 282.68% (2024) |
| Dividend yield | 0.47% (2024) | 3.74% (2024) |
| Fiscal Year | 2024 | 2024 |
Efficiency & Valuation Duel: The Vital Signs
Financial ratios serve as a company’s DNA, exposing hidden risks and showcasing operational strengths that shape investor confidence and valuation.
KKR & Co. Inc.
KKR posts a solid 13.0% ROE and a favorable 14.2% net margin, signaling decent profitability. However, its elevated 42.7 P/E ratio and 5.55 P/B ratio mark the stock as stretched. Dividend yield is low at 0.47%, indicating limited shareholder payouts amid reinvestment in operational efficiency and asset turnover.
Ares Management Corporation
Ares shows neutral net margin at 8.15% but an unfavorable 0% ROE and ROIC, reflecting weak core profitability. The P/E ratio of 66.6 denotes an expensive valuation, yet a 2.77% dividend yield offers tangible shareholder returns. Debt levels appear minimal, supporting financial flexibility despite operational challenges.
Premium Valuation vs. Operational Safety
KKR balances profitability with a stretched valuation, while Ares trades at a premium but offers stronger dividend income and less debt. KKR fits investors seeking operational efficiency; Ares suits those prioritizing dividend yield amid valuation risk.
Which one offers the Superior Shareholder Reward?
I see KKR & Co. Inc. delivers a conservative dividend yield near 0.47%, backed by a solid payout ratio around 20%. Its buyback activity remains modest but consistent, preserving capital for strategic reinvestment. Conversely, Ares Management Corporation pays a robust 3.7% dividend yield with a payout ratio above 280%, signaling aggressive distributions that may stress sustainability. Ares also executes heavier buybacks, boosting total returns yet risking long-term cash flow stability. Historically, I’ve observed that KKR’s balanced approach favors enduring value creation, while Ares’s yield-centric model trades security for income. In 2026, I judge KKR offers the superior total return profile, blending prudent dividends with sustainable capital allocation.
Comparative Score Analysis: The Strategic Profile
The radar chart reveals the fundamental DNA and trade-offs of KKR & Co. Inc. and Ares Management Corporation, highlighting their distinct financial strengths and weaknesses:
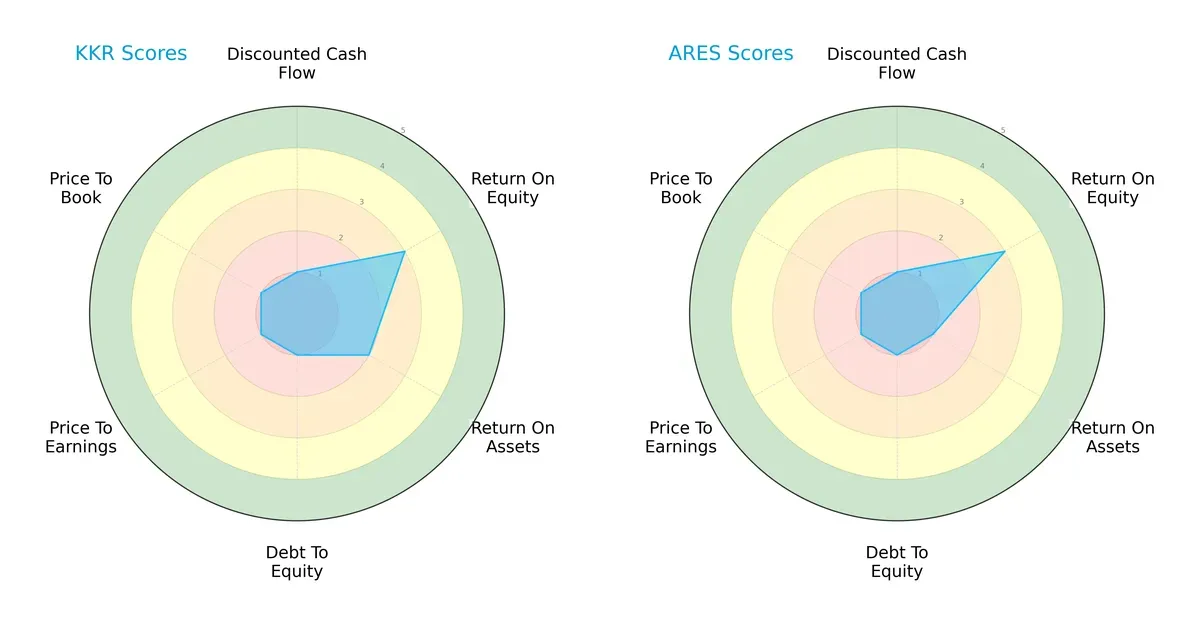
KKR and Ares share a similarly weak overall profile with very unfavorable DCF, debt-to-equity, P/E, and P/B scores. Both deliver moderate ROE (3) but differ in asset efficiency: KKR’s ROA (2) outperforms Ares (1). KKR’s slightly better asset use gives it a marginally more balanced profile, while Ares relies more heavily on equity returns despite weaker asset productivity.
Bankruptcy Risk: Solvency Showdown
KKR’s Altman Z-Score of 0.88 places it firmly in the distress zone, signaling a high bankruptcy risk. Ares’ score is unavailable, preventing direct comparison but underscoring caution for KKR investors in this cycle:

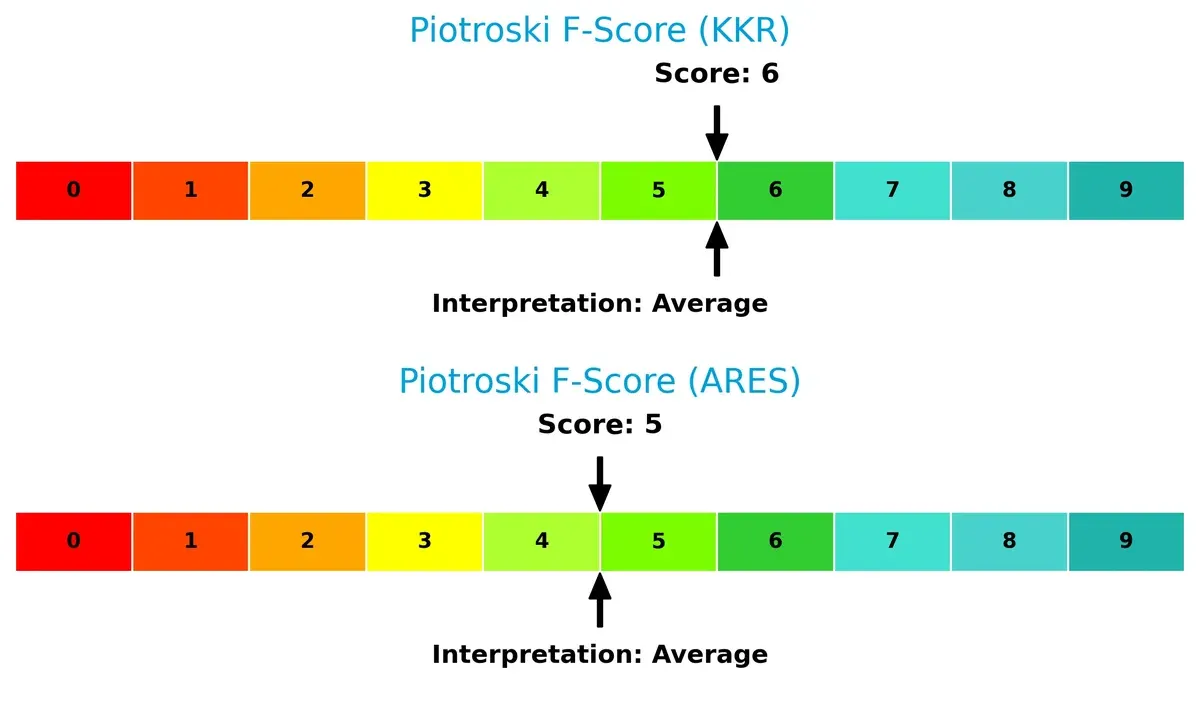
Financial Health: Quality of Operations
KKR scores a Piotroski F-Score of 6, slightly above Ares’ 5, indicating marginally stronger operational health. Neither firm exhibits peak financial strength, but KKR shows fewer red flags in internal metrics:
How are the two companies positioned?
This section dissects the operational DNA of KKR and Ares by comparing their revenue distribution and internal dynamics. The goal is to confront their economic moats to identify which model delivers the most resilient competitive advantage today.
Revenue Segmentation: The Strategic Mix
This visual comparison dissects how KKR & Co. Inc. and Ares Management Corporation diversify their income streams and highlights their primary sector bets:
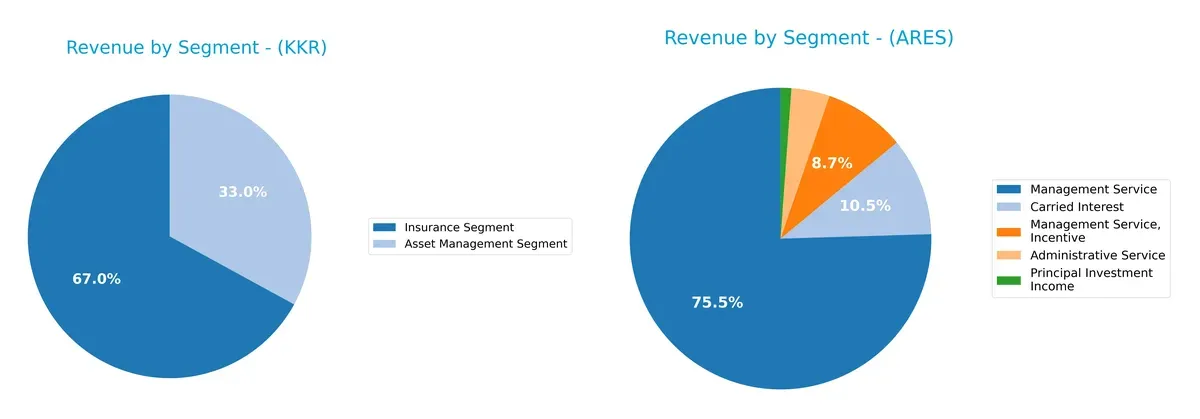
KKR anchors its revenue heavily in the Insurance Segment, with $14.7B in 2024, dwarfing its $7.2B Asset Management income. Ares shows a more balanced mix, with $3B from Management Service and $417M in Carried Interest. KKR’s concentration signals reliance on insurance infrastructure dominance but heightens sector risk. Ares’s diversified streams indicate strategic flexibility and resilience across alternative asset classes.
Strengths and Weaknesses Comparison
This table compares the strengths and weaknesses of KKR & Co. Inc. and Ares Management Corporation:
KKR Strengths
- Strong diversification with asset management and insurance segments
- Favorable net margin at 14.22%
- Favorable debt to assets ratio at 14.11%
- High fixed asset turnover at 12.23
- Favorable quick ratio at 4.12
ARES Strengths
- Favorable price-to-book ratio at 0
- Favorable debt-to-equity and debt-to-assets ratios
- Infinite interest coverage ratio
- Favorable dividend yield at 2.77%
- Diversified revenue streams across credit, private equity, and real estate
KKR Weaknesses
- Unfavorable return on invested capital at 0.25%
- Unfavorable price-to-earnings at 42.65
- Unfavorable current ratio at 4.12
- High debt-to-equity ratio at 2.15
- Unfavorable asset turnover at 0.06
- Slightly unfavorable overall financial ratios
ARES Weaknesses
- Unfavorable return on equity and invested capital at 0%
- Unfavorable price-to-earnings at 66.62
- Unfavorable current and quick ratios at 0
- Unfavorable asset and fixed asset turnover at 0
- Slightly unfavorable overall financial ratios
Both companies show modest strengths in diversification and some favorable financial metrics but face challenges in profitability and operational efficiency. These mixed profiles suggest the need for strategic focus on improving capital returns and asset utilization.
The Moat Duel: Analyzing Competitive Defensibility
A structural moat is the only reliable shield preventing long-term profits from erosion by relentless competition. Let’s dissect the competitive edges of two asset managers:
KKR & Co. Inc.: Diverse Investment Expertise as a Moat
KKR’s moat stems from its wide-ranging asset management expertise and control investments. This breadth delivers stable margins despite recent revenue declines. New market entries in tech and energy could reinforce its moat in 2026.
Ares Management Corporation: Focused Credit and Lending Advantage
Ares differentiates through specialized credit and direct lending platforms, generating solid revenue growth unlike KKR. Its targeted approach enables efficient capital deployment but faces margin pressure. Expansion in niche credit markets offers growth potential.
Moat Battle: Breadth of Expertise vs. Depth in Credit Specialization
KKR’s broader sector exposure creates a wider moat, balancing risk across industries. Ares shows deeper specialization but with more volatile returns. I see KKR better positioned to defend market share amid evolving investment landscapes.
Which stock offers better returns?
The past year shows contrasting stock price movements and trading dynamics between KKR & Co. Inc. and Ares Management Corporation.
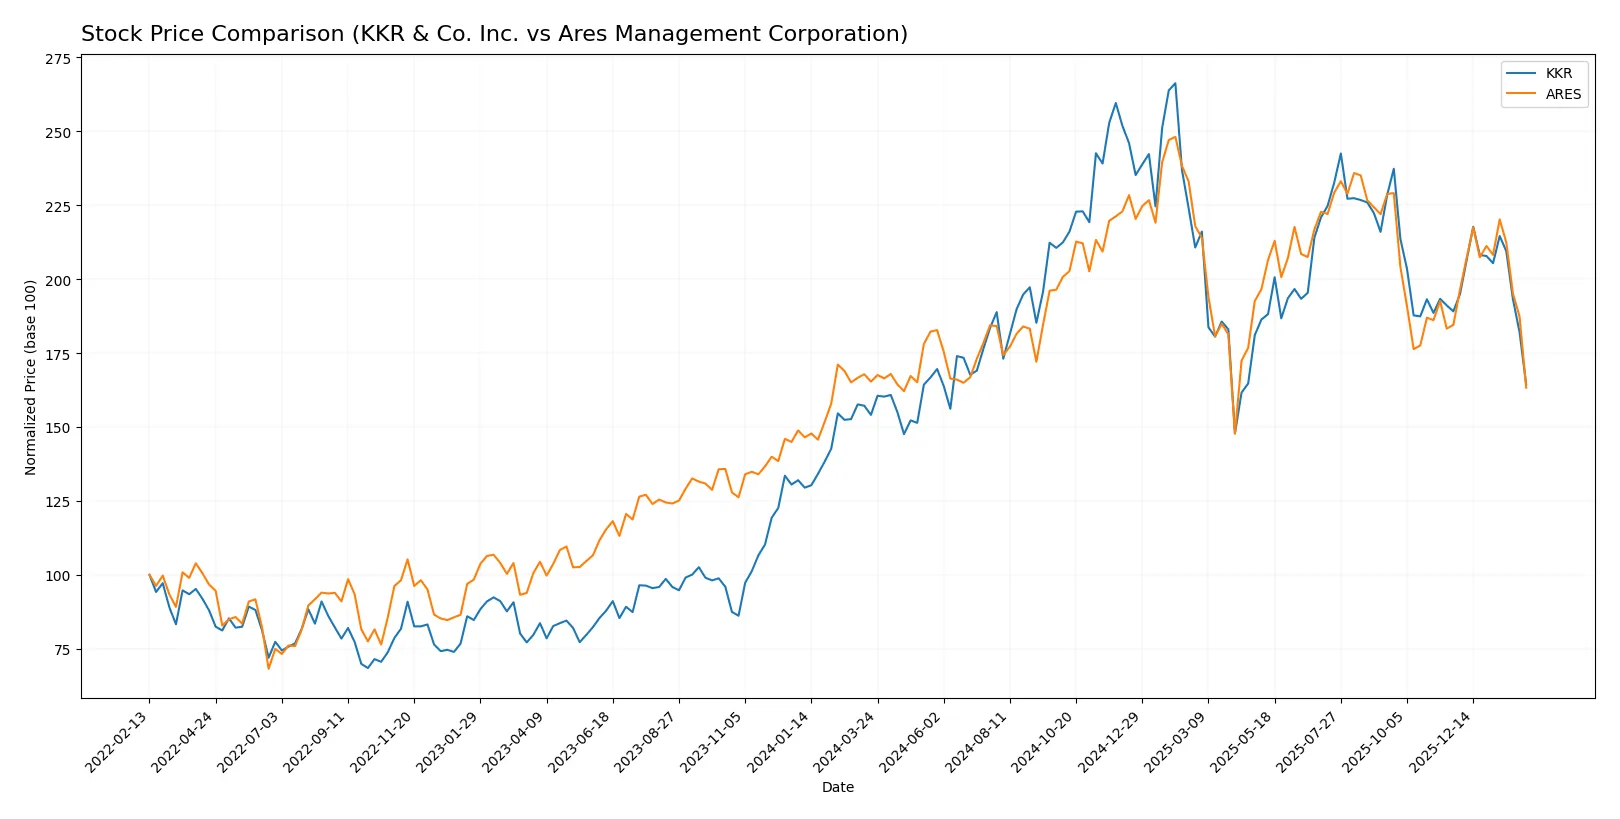
Trend Comparison
KKR’s stock rose 6.72% over the last 12 months, marking a bullish trend with decelerating momentum. The price ranged between 92.62 and 167.07, showing high volatility (std dev 18.23).
ARES experienced a -1.25% price decline in the same period, reflecting a bearish trend with deceleration. Price fluctuated from 118.04 up to 198.22, maintaining similar volatility (std dev 18.74).
KKR outperformed ARES by delivering positive returns despite recent short-term weakness, while ARES’s trend stayed negative with slight buyer dominance in volume.
Target Prices
Analysts present a bullish consensus for both KKR & Co. Inc. and Ares Management Corporation, signaling substantial upside potential.
| Company | Target Low | Target High | Consensus |
|---|---|---|---|
| KKR & Co. Inc. | 125 | 187 | 156 |
| Ares Management Corporation | 155 | 215 | 187.29 |
KKR’s target consensus of $156 stands about 51% above its current $103 price, indicating strong expected growth. Ares’s $187 consensus price implies a 43% premium to its current $130, reflecting optimistic market sentiment.

Don’t Let Luck Decide Your Entry Point
Optimize your entry points with our advanced ProRealTime indicators. You’ll get efficient buy signals with precise price targets for maximum performance. Start outperforming now!
How do institutions grade them?
Here is a summary of recent institutional grades for KKR & Co. Inc. and Ares Management Corporation:
KKR & Co. Inc. Grades
The table below shows recent grades from established financial institutions for KKR & Co. Inc.:
| Grading Company | Action | New Grade | Date |
|---|---|---|---|
| Oppenheimer | Maintain | Outperform | 2026-02-06 |
| Barclays | Maintain | Overweight | 2026-02-06 |
| TD Cowen | Downgrade | Hold | 2026-01-14 |
| UBS | Maintain | Buy | 2026-01-13 |
| Barclays | Maintain | Overweight | 2026-01-09 |
| Barclays | Maintain | Overweight | 2025-12-12 |
| Barclays | Maintain | Overweight | 2025-11-11 |
| Oppenheimer | Maintain | Outperform | 2025-11-10 |
| TD Cowen | Maintain | Buy | 2025-11-10 |
| Morgan Stanley | Maintain | Overweight | 2025-10-21 |
Ares Management Corporation Grades
The table below summarizes recent grades from recognized financial firms for Ares Management Corporation:
| Grading Company | Action | New Grade | Date |
|---|---|---|---|
| Oppenheimer | Maintain | Outperform | 2026-02-06 |
| Barclays | Maintain | Overweight | 2026-02-06 |
| TD Cowen | Maintain | Buy | 2026-01-14 |
| UBS | Maintain | Neutral | 2026-01-13 |
| Barclays | Maintain | Overweight | 2026-01-09 |
| Barclays | Maintain | Overweight | 2025-12-12 |
| Keefe, Bruyette & Woods | Maintain | Outperform | 2025-11-04 |
| TD Cowen | Maintain | Buy | 2025-11-04 |
| Morgan Stanley | Maintain | Equal Weight | 2025-10-21 |
| Oppenheimer | Upgrade | Outperform | 2025-10-14 |
Which company has the best grades?
KKR has consistently received mostly “Overweight” and “Outperform” ratings, with a recent downgrade by TD Cowen. Ares shows a similar pattern but includes a “Neutral” from UBS and an “Equal Weight” from Morgan Stanley. Overall, KKR’s grades slightly outperform Ares, suggesting stronger institutional confidence that may influence investor perception positively.
Risks specific to each company
The following categories identify the critical pressure points and systemic threats facing both firms in the 2026 market environment:
1. Market & Competition
KKR & Co. Inc.
- Faces fierce competition in private equity and diversified asset management globally.
Ares Management Corporation
- Competes in alternative asset management with focus on credit and direct lending markets.
2. Capital Structure & Debt
KKR & Co. Inc.
- High debt-to-equity ratio of 2.15 signals elevated financial leverage risk.
Ares Management Corporation
- Exhibits favorable debt metrics with low leverage and strong interest coverage.
3. Stock Volatility
KKR & Co. Inc.
- Beta near 1.99 indicates high stock price volatility relative to market.
Ares Management Corporation
- Lower beta of 1.54 denotes moderate market sensitivity and volatility risk.
4. Regulatory & Legal
KKR & Co. Inc.
- Global operations expose KKR to diverse regulatory environments and compliance complexity.
Ares Management Corporation
- Also faces multinational regulatory scrutiny, particularly in credit and real estate finance sectors.
5. Supply Chain & Operations
KKR & Co. Inc.
- Operational risks arise from complex investments across industries and geographies.
Ares Management Corporation
- Operational focus on credit and real estate limits supply chain complexity but concentration risk remains.
6. ESG & Climate Transition
KKR & Co. Inc.
- Invests in impact and renewable energy sectors but must manage transition risks in traditional assets.
Ares Management Corporation
- ESG integration is evolving; exposure to real estate and credit markets requires active climate risk management.
7. Geopolitical Exposure
KKR & Co. Inc.
- Significant exposure to Asia, Europe, and Middle East increases geopolitical uncertainty risk.
Ares Management Corporation
- Global footprint including Asia and Europe subjects Ares to similar geopolitical tensions and market disruptions.
Which company shows a better risk-adjusted profile?
KKR’s most impactful risk lies in its elevated financial leverage and stock volatility, stressing capital structure and market stability. Ares’ key risk is lower profitability and absent liquidity ratios, creating valuation and operational uncertainty. Despite KKR’s higher leverage, its diversified portfolio and strong operational scale give it a marginally better risk-adjusted profile. Ares’ limited liquidity data and zero leverage metrics raise red flags about financial transparency and resilience in a tightening credit environment.
Final Verdict: Which stock to choose?
KKR & Co. Inc. stands out for its resilient cash generation ability despite recent revenue headwinds. Its superpower lies in strong operating margins and a robust current ratio, signaling liquidity strength. However, its high leverage and declining ROIC warrant caution. KKR suits investors seeking aggressive growth with tolerance for operational volatility.
Ares Management Corporation’s strategic moat centers on its diversified asset management platform and steady recurring revenue streams. It offers a comparatively safer profile with lower financial risk and a healthier interest coverage ratio. Ares fits well in Growth at a Reasonable Price (GARP) portfolios that value stability alongside growth potential.
If you prioritize aggressive cash flow growth and can weather leverage risks, KKR is the compelling choice due to its operational efficiency and liquidity cushion. However, if you seek better stability and a more balanced risk-reward profile, Ares offers superior financial resilience and recurring revenue advantages. Both require vigilance given their recent ROIC declines and market pressures.
Disclaimer: Investment carries a risk of loss of initial capital. The past performance is not a reliable indicator of future results. Be sure to understand risks before making an investment decision.
Go Further
I encourage you to read the complete analyses of KKR & Co. Inc. and Ares Management Corporation to enhance your investment decisions: