Home > Comparison > Financial Services > ARES vs IVZ
The strategic rivalry between Ares Management Corporation and Invesco Ltd. shapes the asset management sector’s evolution. Ares leverages a diversified alternative asset model focusing on credit, private equity, and real estate. Invesco operates as a broad-based investment manager covering global equities, fixed income, and multi-asset strategies. This analysis contrasts their operational approaches to identify which offers superior risk-adjusted returns for diversified portfolios in today’s complex financial landscape.
Table of contents
Companies Overview
Ares Management and Invesco Ltd. hold key roles in the evolving asset management landscape.
Ares Management Corporation: Alternative Asset Specialist
Ares Management Corporation dominates the alternative asset management sector with a focus on credit, private equity, and real estate. It generates revenue through managing specialized investment funds and providing financing solutions to mid-sized companies. In 2026, Ares sharpens its strategy on majority-control investments and direct lending, leveraging its global presence across the US, Europe, and Asia.
Invesco Ltd.: Diversified Investment Manager
Invesco Ltd. stands as a broad-spectrum investment manager catering to retail and institutional clients worldwide. Its core revenue derives from managing equity, fixed income, and multi-asset portfolios, alongside mutual and exchange-traded funds. In 2026, Invesco prioritizes quantitative strategies and absolute return approaches, expanding its footprint in public markets across multiple asset classes.
Strategic Collision: Similarities & Divergences
Both firms compete in asset management but diverge sharply in approach. Ares focuses on alternative, control-oriented investments, while Invesco embraces a broad, diversified portfolio emphasizing public markets and quantitative methods. Their primary battleground lies in attracting institutional capital seeking either specialized private market exposure or diversified public market solutions. This contrast defines their distinct investment profiles—Ares as a niche private market powerhouse, Invesco as a versatile, scale-driven manager.
Income Statement Comparison
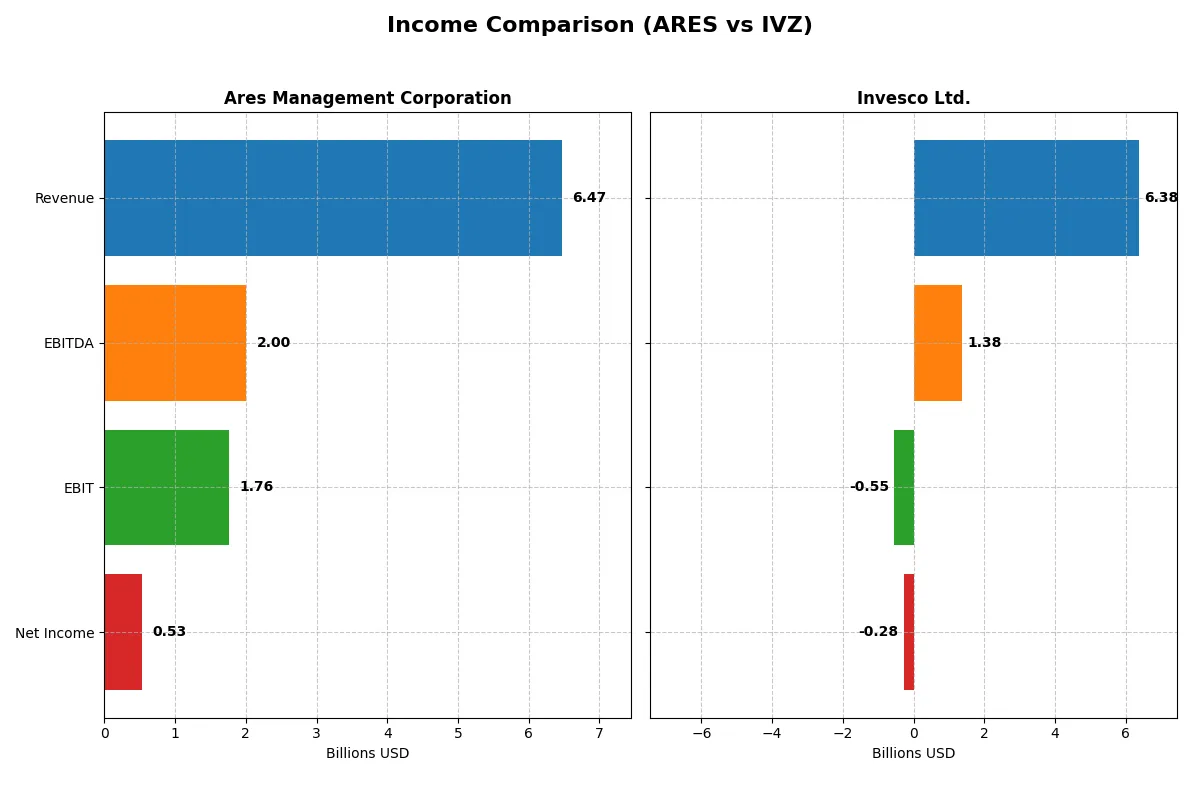
This data dissects the core profitability and scalability of both corporate engines to reveal who dominates the bottom line:
| Metric | Ares Management Corporation (ARES) | Invesco Ltd. (IVZ) |
|---|---|---|
| Revenue | 6.47B | 6.38B |
| Cost of Revenue | 1.39B | 3.62B |
| Operating Expenses | 1.05B | 3.45B |
| Gross Profit | 1.94B | 2.75B |
| EBITDA | 2.00B | 1.38B |
| EBIT | 1.76B | -547M |
| Interest Expense | 0 | 83M |
| Net Income | 527M | -282M |
| EPS | 1.96 | -1.61 |
| Fiscal Year | 2025 | 2025 |
Income Statement Analysis: The Bottom-Line Duel
This income statement comparison exposes the true efficiency and profitability of Ares Management Corporation and Invesco Ltd.’s corporate engines.
Ares Management Corporation Analysis
Ares exhibits strong revenue growth, surging 66.6% year-over-year to $6.47B in 2025. Despite a 9.8% decline in gross profit, its gross margin remains stable at 30%, with a solid 8.2% net margin. The latest year shows efficiency challenges as EBIT fell 21.8%, yet net income still grew 29% over five years, signaling resilient core operations.
Invesco Ltd. Analysis
Invesco posted modest revenue growth of 5.1% to $6.38B in 2025 but suffered a sharp deterioration in profitability. Its gross margin of 43.2% stands out, yet EBIT turned negative at -8.6%, dragging net margin to -4.4%. Over five years, revenue and net income declined significantly, reflecting persistent operational and margin pressures.
Steady Growth vs. Profitability Struggles
Ares outperforms Invesco with superior revenue growth and consistently positive net margins, despite some margin contractions. Invesco’s higher gross margin is offset by escalating expenses and losses at the EBIT and net income levels. For investors prioritizing sustainable profitability, Ares presents a more attractive profile with a fundamentally favorable income statement.
Financial Ratios Comparison
These vital ratios act as a diagnostic tool to expose the underlying fiscal health, valuation premiums, and capital efficiency of the companies compared below:
| Ratios | Ares Management Corporation (ARES) | Invesco Ltd. (IVZ) |
|---|---|---|
| ROE | 13.09% (2024) | -2.30% (2025) |
| ROIC | 3.96% (2024) | -3.16% (2025) |
| P/E | 75.61 (2024) | -42.08 (2025) |
| P/B | 9.89 (2024) | 0.97 (2025) |
| Current Ratio | 0.98 (2024) | 0.31 (2025) |
| Quick Ratio | 0.98 (2024) | 0.31 (2025) |
| D/E (Debt-to-Equity) | 3.71 (2024) | 0.88 (2025) |
| Debt-to-Assets | 52.84% (2024) | 39.83% (2025) |
| Interest Coverage | 0.97 (2024) | -8.43 (2025) |
| Asset Turnover | 0.16 (2024) | 0.24 (2025) |
| Fixed Asset Turnover | 5.64 (2024) | 0 (2025) |
| Payout Ratio | 283% (2024) | -134% (2025) |
| Dividend Yield | 3.74% (2024) | 3.18% (2025) |
| Fiscal Year | 2024 | 2025 |
Efficiency & Valuation Duel: The Vital Signs
Financial ratios act as the company’s DNA, revealing hidden risks and operational excellence that numbers alone can’t capture.
Ares Management Corporation
Ares shows moderate profitability with an 8.15% net margin but lacks return on equity and invested capital, signaling operational challenges. The stock trades at a stretched P/E of 66.62, indicating expensive valuation. Shareholders benefit from a 2.77% dividend yield, suggesting steady income amid limited reinvestment in R&D or growth.
Invesco Ltd.
Invesco posts negative profitability and returns, reflecting operational weaknesses and a net margin of -4.42%. Its negative P/E ratio signals losses but a favorable price-to-book of 0.97 suggests undervaluation. The company yields 3.18% in dividends, offsetting poor returns with income, despite a weak current ratio and interest coverage.
Premium Valuation vs. Operational Safety
Ares offers better profitability but at a stretched valuation, while Invesco trades cheaply with operational risks. Ares suits investors prioritizing income and steady margins. Invesco fits those seeking value with a tolerance for financial instability.
Which one offers the Superior Shareholder Reward?
I compare Ares Management Corporation (ARES) and Invesco Ltd. (IVZ) on shareholder distributions, focusing on dividends and buybacks. Ares yields 3.74% with a payout ratio around 283%, signaling aggressive but risky dividends. Invesco yields 3.18%, with a modest payout and positive free cash flow supporting sustainability. Both deploy buybacks, but Ares shows higher leverage and payout strain, raising concerns. Invesco’s conservative payout and healthier capital allocation promise steadier long-term returns. I conclude Invesco offers a more sustainable and attractive total shareholder reward in 2026.
Comparative Score Analysis: The Strategic Profile
The radar chart reveals the fundamental DNA and trade-offs of Ares Management Corporation and Invesco Ltd., highlighting their distinct financial strengths and weaknesses:
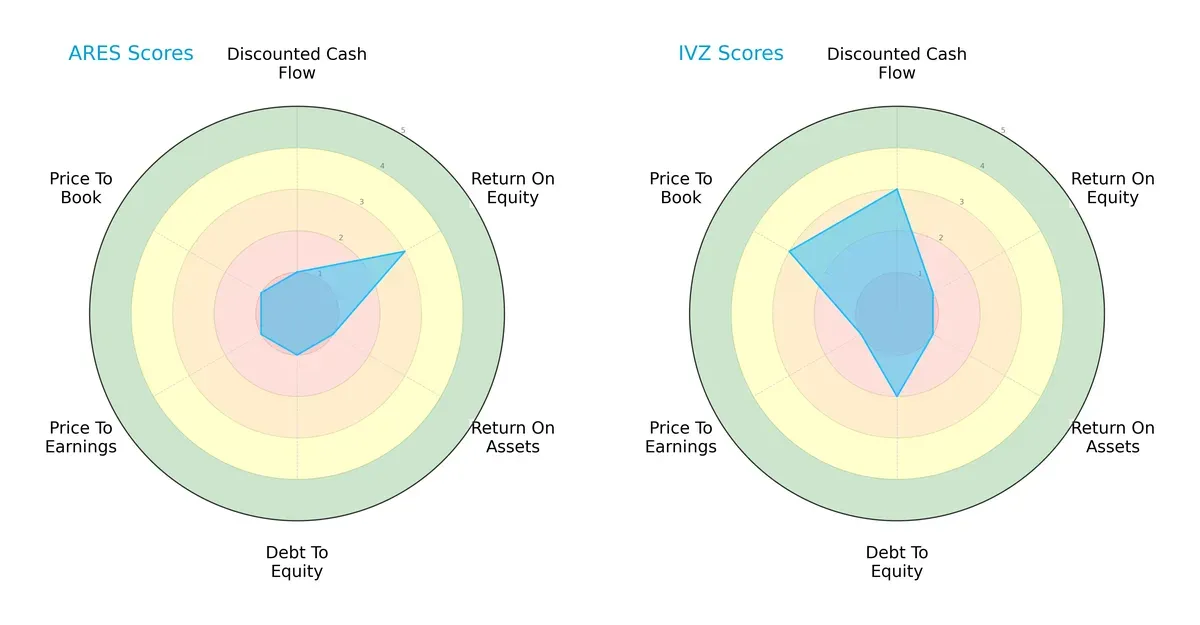
Ares shows moderate efficiency in generating equity returns (ROE score 3) but suffers across the board with poor asset use, high leverage, and expensive valuation metrics (all scores 1). In contrast, Invesco leverages a stronger discounted cash flow profile (score 3) and better price-to-book valuation (score 3), though it struggles with equity returns (ROE 1) and maintains a slightly better debt position (score 2). Overall, Invesco presents a more balanced financial profile, while Ares relies heavily on moderate equity returns amid weak fundamentals.
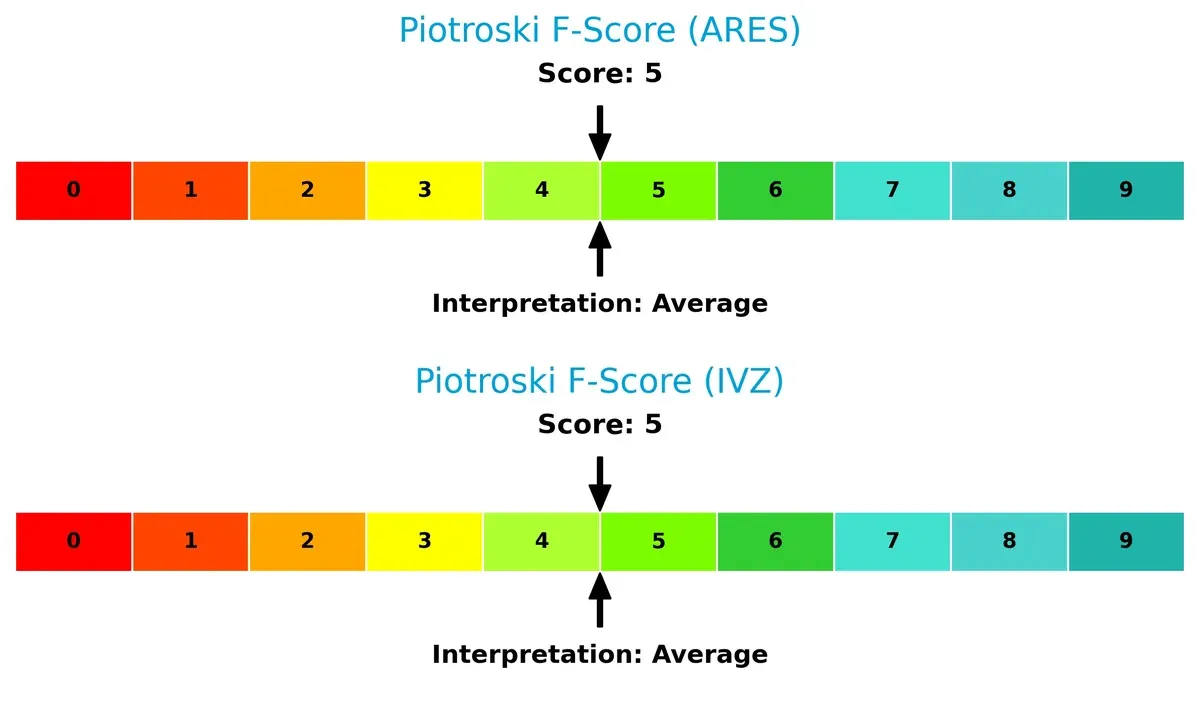
Financial Health: Quality of Operations
Both companies post an identical Piotroski F-Score of 5, indicating average financial health with no glaring red flags. This score suggests moderate operational quality and financial stability, but neither firm demonstrates peak internal metrics or robust value signals:
How are the two companies positioned?
This section dissects Ares and Invesco’s operational DNA by comparing their revenue segments and internal dynamics. The goal is to confront their economic moats and identify which model offers a more resilient, sustainable advantage today.
Revenue Segmentation: The Strategic Mix
This visual comparison dissects how Ares Management Corporation and Invesco Ltd. diversify their income streams and reveals their primary sector bets:
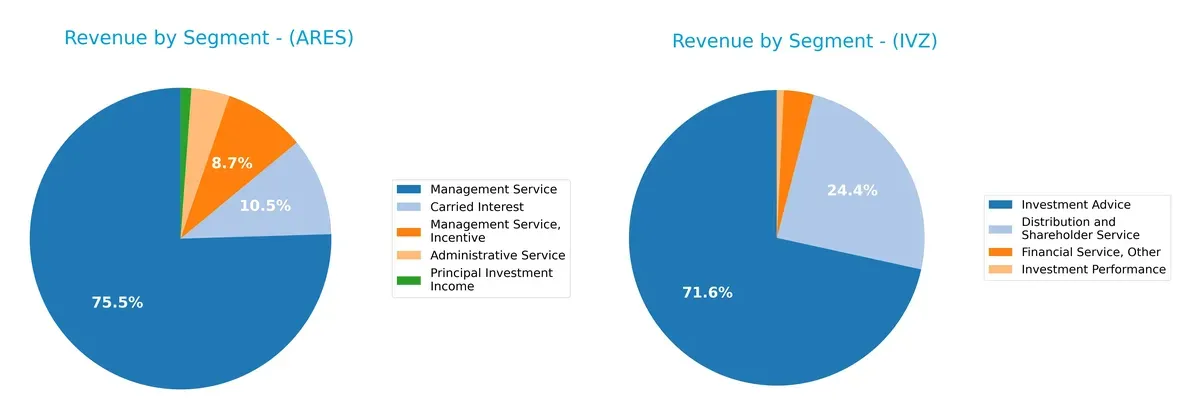
Ares Management anchors its revenue in Management Service at $3B, with significant Carried Interest at $417M, showing a strong focus on asset management fees and performance incentives. Invesco Ltd. pivots sharply on Investment Advice, generating $4.3B, dwarfing other segments like Distribution at $1.5B. Ares displays moderate diversification across fee types, while Invesco relies heavily on advisory services, indicating concentration risk but strong market positioning in investment management.
Strengths and Weaknesses Comparison
This table compares the Strengths and Weaknesses of Ares Management Corporation and Invesco Ltd.:
Ares Strengths
- Diversified revenue streams across Administrative, Management, and Principal Investment Income
- Favorable debt-to-equity and debt-to-assets ratios indicate solid financial structure
- Positive dividend yield of 2.77% supports shareholder returns
Invesco Strengths
- Strong geographic diversification with significant Americas, EMEA, and Asia presence
- Favorable weighted average cost of capital (7.32%) suggests efficient capital use
- Dividend yield of 3.18% adds income appeal to investors
Ares Weaknesses
- Unfavorable ROE and ROIC highlight inefficient capital returns
- Zero current and quick ratios raise liquidity concerns
- High PE ratio (66.62) suggests potential overvaluation
- Low asset turnover indicates weak operational efficiency
Invesco Weaknesses
- Negative net margin, ROE, and ROIC reflect poor profitability and capital returns
- Low current and quick ratios indicate liquidity risks
- Negative interest coverage ratio signals difficulty meeting debt costs
- Unfavorable asset turnover points to operational inefficiency
Ares benefits from a robust capital structure and diversified income but struggles with capital efficiency and liquidity. Invesco shows geographic breadth and capital cost strengths but faces profitability and liquidity challenges. These factors have important implications for each company’s strategic focus and risk management.
The Moat Duel: Analyzing Competitive Defensibility
A structural moat is the sole shield protecting long-term profits from relentless competitive erosion. Let’s dissect the competitive moats of two asset managers:
Ares Management Corporation: Diverse Asset Control Moat
Ares leverages control investments and direct lending to build switching costs and intangible asset moats. Its stable 27% EBIT margin reflects operational efficiency. New product launches in alternative assets could reinforce its competitive edge in 2026.
Invesco Ltd.: Scale and Product Breadth Moat
Invesco relies on scale and global diversification, contrasting Ares’ control focus. Despite a wider geographic reach, its declining ROIC and negative margins signal value erosion. Expansion in multi-asset ETFs might offer a growth lever but risks are evident.
Control-Driven Moat vs. Scale-Driven Moat: Who Defends Better?
Ares’ control-based moat appears deeper, demonstrated by robust margin stability despite some growth headwinds. Invesco’s scale advantage falters amid value destruction and declining profitability. Ares is better positioned to defend market share long term.
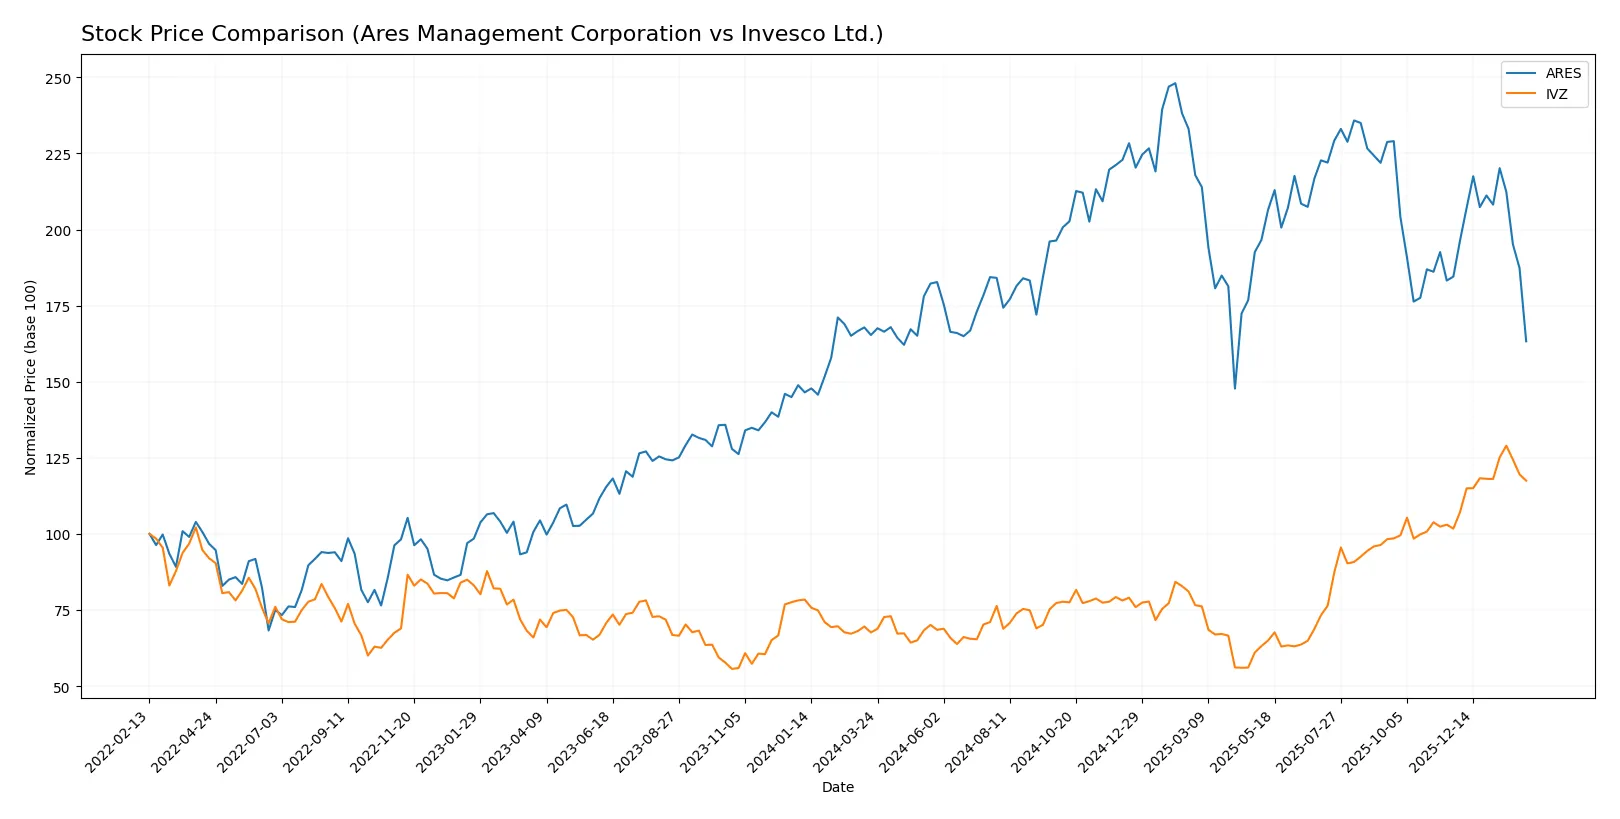
Which stock offers better returns?
The past year reveals contrasting price dynamics: Ares Management Corporation exhibits a mild bearish trend with decelerating losses, while Invesco Ltd. shows strong bullish momentum and accelerating gains.
Trend Comparison
Ares Management Corporation’s stock declined by 1.25% over the past year, signaling a bearish trend with deceleration in losses, despite high volatility and a peak price of 198.22.
Invesco Ltd. gained 73.82% in the same period, reflecting a clear bullish trend with accelerating momentum, low volatility, and a highest price near 29.44.
Comparing both, Invesco Ltd. outperformed Ares Management significantly, delivering the highest market returns and more stable upward price movement.
Target Prices
Analysts present a clear consensus on the target prices for Ares Management Corporation and Invesco Ltd.
| Company | Target Low | Target High | Consensus |
|---|---|---|---|
| Ares Management Corporation | 155 | 215 | 187.29 |
| Invesco Ltd. | 24 | 34.5 | 29.8 |
The target consensus for Ares suggests a potential upside of roughly 43% from its current 130.46 price. Invesco’s targets imply a more modest upside near 11%, reflecting differing market expectations.

Don’t Let Luck Decide Your Entry Point
Optimize your entry points with our advanced ProRealTime indicators. You’ll get efficient buy signals with precise price targets for maximum performance. Start outperforming now!
How do institutions grade them?
Ares Management Corporation Grades
The following table summarizes recent analyst grades for Ares Management Corporation:
| Grading Company | Action | New Grade | Date |
|---|---|---|---|
| Oppenheimer | maintain | Outperform | 2026-02-06 |
| Barclays | maintain | Overweight | 2026-02-06 |
| TD Cowen | maintain | Buy | 2026-01-14 |
| UBS | maintain | Neutral | 2026-01-13 |
| Barclays | maintain | Overweight | 2026-01-09 |
| Barclays | maintain | Overweight | 2025-12-12 |
| Keefe, Bruyette & Woods | maintain | Outperform | 2025-11-04 |
| TD Cowen | maintain | Buy | 2025-11-04 |
| Morgan Stanley | maintain | Equal Weight | 2025-10-21 |
| Oppenheimer | upgrade | Outperform | 2025-10-14 |
Invesco Ltd. Grades
The following table summarizes recent analyst grades for Invesco Ltd.:
| Grading Company | Action | New Grade | Date |
|---|---|---|---|
| Goldman Sachs | maintain | Neutral | 2026-01-28 |
| Argus Research | maintain | Buy | 2026-01-28 |
| Barclays | maintain | Equal Weight | 2026-01-28 |
| RBC Capital | maintain | Outperform | 2026-01-28 |
| RBC Capital | upgrade | Outperform | 2026-01-21 |
| JP Morgan | maintain | Neutral | 2026-01-20 |
| Barclays | maintain | Equal Weight | 2026-01-15 |
| Deutsche Bank | upgrade | Buy | 2025-12-17 |
| Morgan Stanley | maintain | Equal Weight | 2025-12-17 |
| Barclays | maintain | Equal Weight | 2025-12-12 |
Which company has the best grades?
Ares Management shows consistently stronger ratings, with multiple Outperform and Overweight grades. Invesco holds more Neutral and Equal Weight ratings. This difference may influence investor confidence and portfolio allocation decisions.
Risks specific to each company
The following categories identify critical pressure points and systemic threats facing Ares Management Corporation and Invesco Ltd. in the 2026 market environment:
1. Market & Competition
Ares Management Corporation
- Operates in alternative asset management with diverse segments, facing pressure from specialized competitors in credit and private equity markets.
Invesco Ltd.
- Provides broad investment management services with intense competition in retail and institutional segments, struggling with declining margins.
2. Capital Structure & Debt
Ares Management Corporation
- Shows favorable debt metrics with low debt to equity and strong interest coverage, indicating prudent leverage management.
Invesco Ltd.
- Neutral debt levels with moderate debt to assets; interest coverage is negative, signaling risk in servicing debt obligations.
3. Stock Volatility
Ares Management Corporation
- Beta around 1.54 suggests moderately higher volatility than the market, typical for financial services in growth phase.
Invesco Ltd.
- Beta at 1.66 indicates higher stock price volatility, reflecting market concerns over profitability and operational risks.
4. Regulatory & Legal
Ares Management Corporation
- Operates globally with exposure to multi-jurisdictional regulations; alternative asset strategies face evolving regulatory scrutiny.
Invesco Ltd.
- Faces complex regulatory environments across asset classes and geographies, with increased risk from compliance failures.
5. Supply Chain & Operations
Ares Management Corporation
- Relies heavily on operational efficiency in fund management and credit origination; risks from market liquidity and capital availability.
Invesco Ltd.
- Operational risks stem from managing diverse investment products and integrating quantitative strategies amid market turbulence.
6. ESG & Climate Transition
Ares Management Corporation
- Increasing pressure to integrate ESG in private equity and real estate investments; transition risks impact asset valuations.
Invesco Ltd.
- Faces demands for ESG compliance in public markets and alternative investments; climate policies influence portfolio construction.
7. Geopolitical Exposure
Ares Management Corporation
- Global presence in U.S., Europe, Asia exposes firm to geopolitical tensions affecting capital flows and investment valuations.
Invesco Ltd.
- Also globally diversified, with sensitivity to trade policies and regional conflicts affecting fund performance and client allocations.
Which company shows a better risk-adjusted profile?
Ares Management’s strongest risk lies in market competition amid evolving asset classes, but superior capital structure cushions financial distress. Invesco’s largest risk is financial instability, highlighted by negative profitability metrics and distress-level Altman Z-Score. Ares exhibits a better risk-adjusted profile, supported by stronger debt metrics and more stable dividend yield. The stark contrast in interest coverage and debt management underscores my concern over Invesco’s financial health in 2026.
Final Verdict: Which stock to choose?
Ares Management Corporation’s superpower lies in its ability to generate consistent free cash flow, making it a reliable cash machine in the asset management space. The point of vigilance is its elevated leverage and stretched liquidity ratios, which could amplify risks in a tightening credit environment. It fits well in an aggressive growth portfolio willing to tolerate short-term volatility for long-term cash generation.
Invesco Ltd. boasts a strategic moat through its diversified fee-based revenue streams and a strong balance sheet compared to Ares. This recurring revenue safety cushions against market downturns and supports stability. Its safety profile makes it more suitable for a GARP (Growth at a Reasonable Price) portfolio seeking moderate growth with downside protection.
If you prioritize free cash flow strength and are comfortable with leverage risks, Ares outshines as the compelling choice due to its cash generation prowess. However, if you seek better stability and a cleaner balance sheet, Invesco offers superior resilience, making it more appropriate for risk-conscious investors. Both carry distinct profiles, demanding careful alignment with your investment strategy.
Disclaimer: Investment carries a risk of loss of initial capital. The past performance is not a reliable indicator of future results. Be sure to understand risks before making an investment decision.
Go Further
I encourage you to read the complete analyses of Ares Management Corporation and Invesco Ltd. to enhance your investment decisions: