Home > Comparison > Financial Services > BX vs ARES
The strategic rivalry between Blackstone Inc. and Ares Management Corporation shapes the financial services asset management sector. Blackstone operates as a diversified alternative asset manager with a vast global footprint and multi-asset strategies. In contrast, Ares focuses on credit, direct lending, and under-capitalized private equity investments, emphasizing control in middle-market assets. This analysis explores which firm’s operational model offers the superior risk-adjusted return potential for a diversified portfolio in today’s evolving market environment.

Table of contents
Companies Overview
Blackstone Inc. and Ares Management Corporation stand as titans in alternative asset management, shaping global financial markets.
Blackstone Inc.: Global Alternative Asset Powerhouse
Blackstone Inc. dominates alternative asset management, generating revenue through real estate, private equity, hedge funds, and credit strategies. Its core strength lies in opportunistic real estate and diverse private equity holdings worldwide. In 2026, Blackstone sharpened its focus on multi-asset class strategies and growth equity, expanding in Asia and Latin America.
Ares Management Corporation: Diversified Credit and Private Equity Specialist
Ares Management Corporation excels in alternative asset management with strong emphasis on tradable credit and direct lending. It drives revenue via financing solutions for mid-sized companies and control investments in under-capitalized firms. The firm prioritizes middle-market commercial real estate and self-originated financing opportunities in 2026, enhancing its foothold in global credit markets.
Strategic Collision: Similarities & Divergences
Both firms pursue alternative asset management but differ sharply in philosophy. Blackstone embraces a broad, multi-asset approach with a global opportunistic stance. Ares focuses on credit-intensive, middle-market control investments. Their primary battleground is private equity and real estate sectors. Investors face contrasting profiles: Blackstone offers scale and diversification, while Ares delivers niche credit expertise with targeted control strategies.
Income Statement Comparison
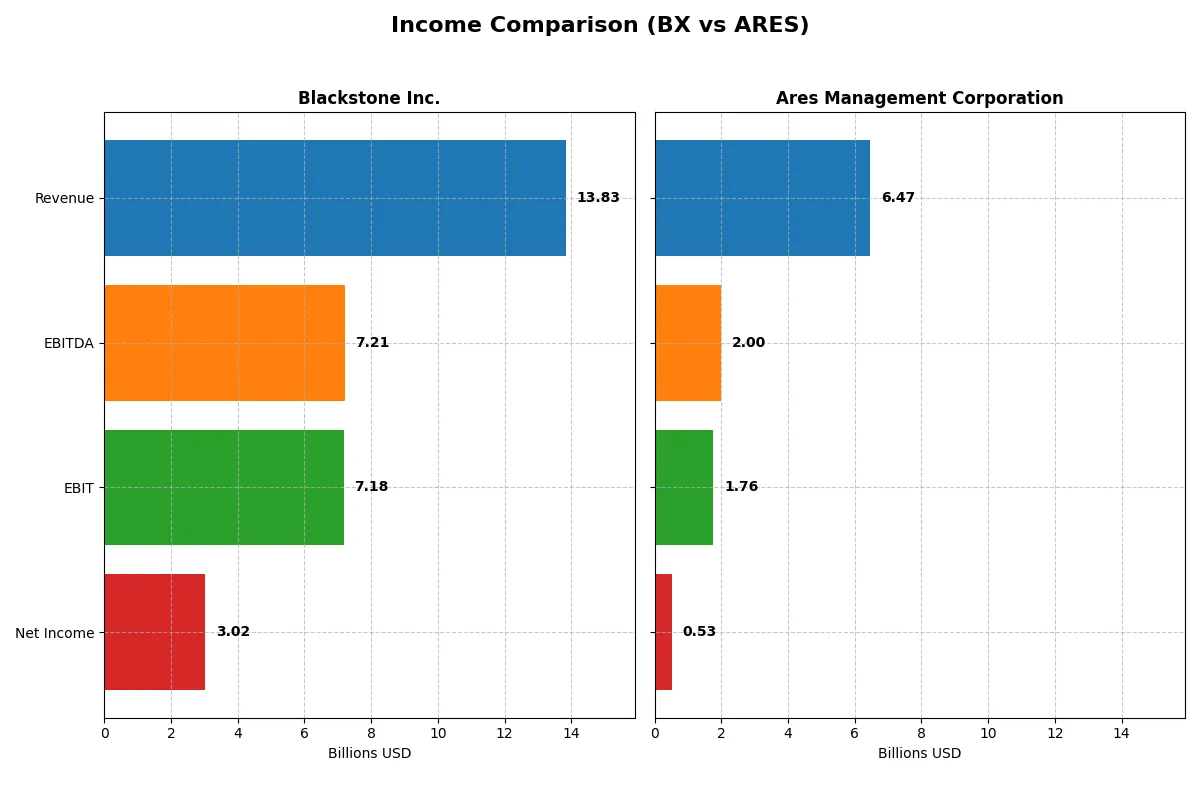
This data dissects the core profitability and scalability of both corporate engines to reveal who dominates the bottom line:
| Metric | Blackstone Inc. (BX) | Ares Management Corporation (ARES) |
|---|---|---|
| Revenue | 13.8B | 6.5B |
| Cost of Revenue | 1.9B | 1.4B |
| Operating Expenses | 4.7B | 1.0B |
| Gross Profit | 11.9B | 1.9B |
| EBITDA | 7.2B | 2.0B |
| EBIT | 7.2B | 1.8B |
| Interest Expense | 508M | 0 |
| Net Income | 3.0B | 527M |
| EPS | 3.88 | 1.96 |
| Fiscal Year | 2025 | 2025 |
Income Statement Analysis: The Bottom-Line Duel
This income statement comparison exposes how each company converts revenue into profits, revealing their operational efficiency and financial momentum.
Blackstone Inc. Analysis
Blackstone’s revenue rose from 7.4B in 2023 to 13.8B in 2025, showing strong top-line growth. Its gross margin stays robust at 86%, reflecting tight cost control. Despite a dip in net margin growth recently, Blackstone’s 2025 net income hit 3B, fueling EPS growth and signaling solid operational momentum.
Ares Management Corporation Analysis
Ares expanded revenue sharply from 3.6B in 2023 to 6.5B in 2025, but gross profit declined slightly, pressuring margins. The firm’s gross margin hovers near 30%, less efficient than Blackstone’s. Its 2025 net income is 0.5B, with net margin shrinking; EPS declined, indicating margin headwinds despite good revenue gains.
Margin Dominance vs. Growth Trajectory
Blackstone dominates with superior margins and higher net income, showcasing strong profitability and operational efficiency. Ares boasts faster revenue growth but struggles with compressing margins and lower net income. For investors prioritizing profit quality, Blackstone’s profile is more attractive, while Ares appeals to those seeking top-line expansion despite margin risks.
Financial Ratios Comparison
These vital ratios act as a diagnostic tool to expose the underlying fiscal health, valuation premiums, and capital efficiency of the companies compared below:
| Ratios | Blackstone Inc. (BX) | Ares Management Corporation (ARES) |
|---|---|---|
| ROE | 34.8% | 0% |
| ROIC | 17.2% | 0% |
| P/E | 39.9 | 66.6 |
| P/B | 13.9 | 0 |
| Current Ratio | 0.85 | 0 |
| Quick Ratio | 0.85 | 0 |
| D/E (Debt-to-Equity) | 1.44 | 0 |
| Debt-to-Assets | 26.1% | 0% |
| Interest Coverage | 14.1 | 0 |
| Asset Turnover | 0.29 | 0 |
| Fixed Asset Turnover | 18.3 | 0 |
| Payout ratio | 121.3% | 184.7% |
| Dividend yield | 3.04% | 2.77% |
| Fiscal Year | 2025 | 2025 |
Efficiency & Valuation Duel: The Vital Signs
Financial ratios act as the company’s DNA, uncovering hidden risks and highlighting operational excellence beneath the surface.
Blackstone Inc.
Blackstone posts a strong ROE of 34.8% and a net margin of 21.8%, signaling robust profitability. Its P/E ratio near 40 marks the stock as expensive compared to market averages. The company supports shareholders with a 3% dividend yield, balancing growth with steady income despite a stretched current ratio of 0.85.
Ares Management Corporation
Ares shows a weak profitability profile with zero ROE and ROIC, while its P/E ratio at 66.6 signals a highly stretched valuation. The firm maintains a modest 2.8% dividend yield but suffers from unfavorable liquidity ratios. Its operational efficiency and asset turnover metrics remain unreported or poor, raising red flags.
Premium Valuation vs. Operational Safety
Blackstone offers higher profitability and a healthier dividend yield but trades at a premium with some liquidity concerns. Ares faces profitability and valuation challenges, reflected in weaker ratio scores. Investors prioritizing operational strength may lean towards Blackstone’s profile, while Ares’s riskier profile suits those seeking speculative growth.
Which one offers the Superior Shareholder Reward?
I see Blackstone (BX) delivers a higher dividend yield around 3.0%–4.4%, but with payout ratios exceeding 100%, signaling potential sustainability risk. Ares (ARES) yields roughly 2.8%–4.7%, with similar payout ratios above 100%, yet Ares leans more on reinvestment, shown by solid free cash flow per share (up to 13.6). Blackstone’s payout is supported by substantial buybacks, boosting total returns despite higher leverage. Ares shows volatile operating cash flow and heavier debt, which could pressure future distributions. Given BX’s more consistent cash flow and disciplined buybacks, I judge Blackstone offers a more attractive and sustainable shareholder reward in 2026.
Comparative Score Analysis: The Strategic Profile
The radar chart reveals the fundamental DNA and trade-offs of Blackstone Inc. and Ares Management Corporation:
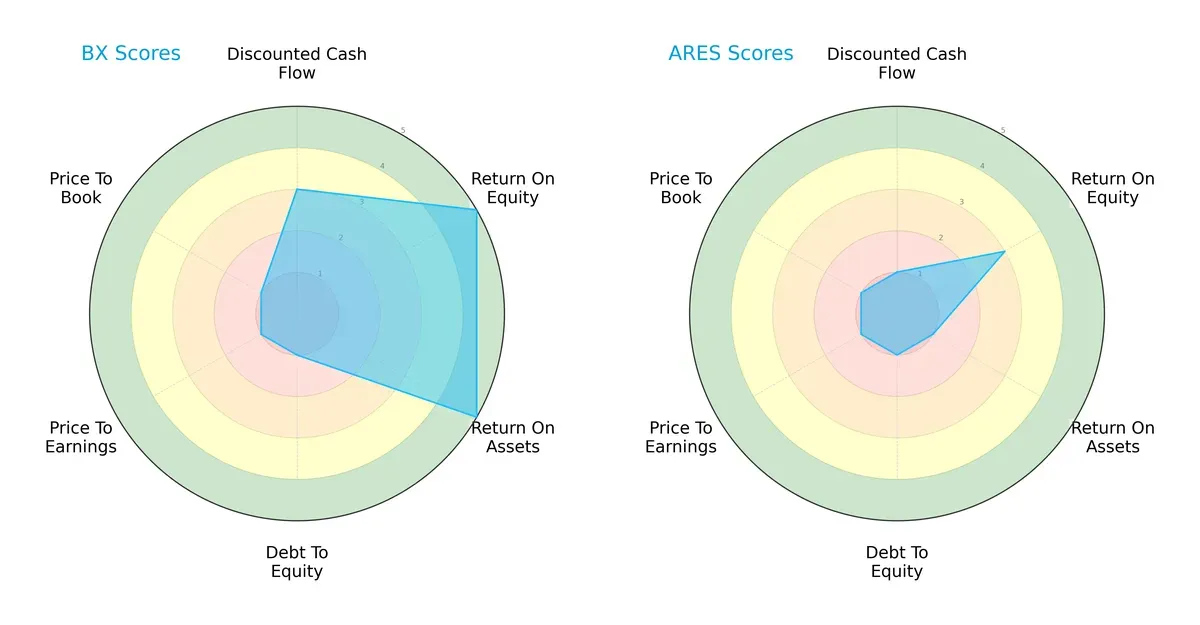
Blackstone Inc. dominates in returns, scoring very favorable 5s on ROE and ROA, reflecting strong asset efficiency and equity profitability. However, it carries significant financial risk, with very unfavorable 1s in debt-to-equity and valuation metrics (P/E and P/B). Ares Management shows a weaker overall score and less operational efficiency, with moderate ROE but very unfavorable scores elsewhere. Blackstone’s profile is more balanced on operational performance but risks valuation and leverage challenges, while Ares lacks a clear competitive edge.
Bankruptcy Risk: Solvency Showdown
Blackstone’s Altman Z-Score of 4.44 places it firmly in the safe zone, signaling robust long-term solvency and low bankruptcy risk in this market cycle. Ares Management’s score is unavailable for comparison:

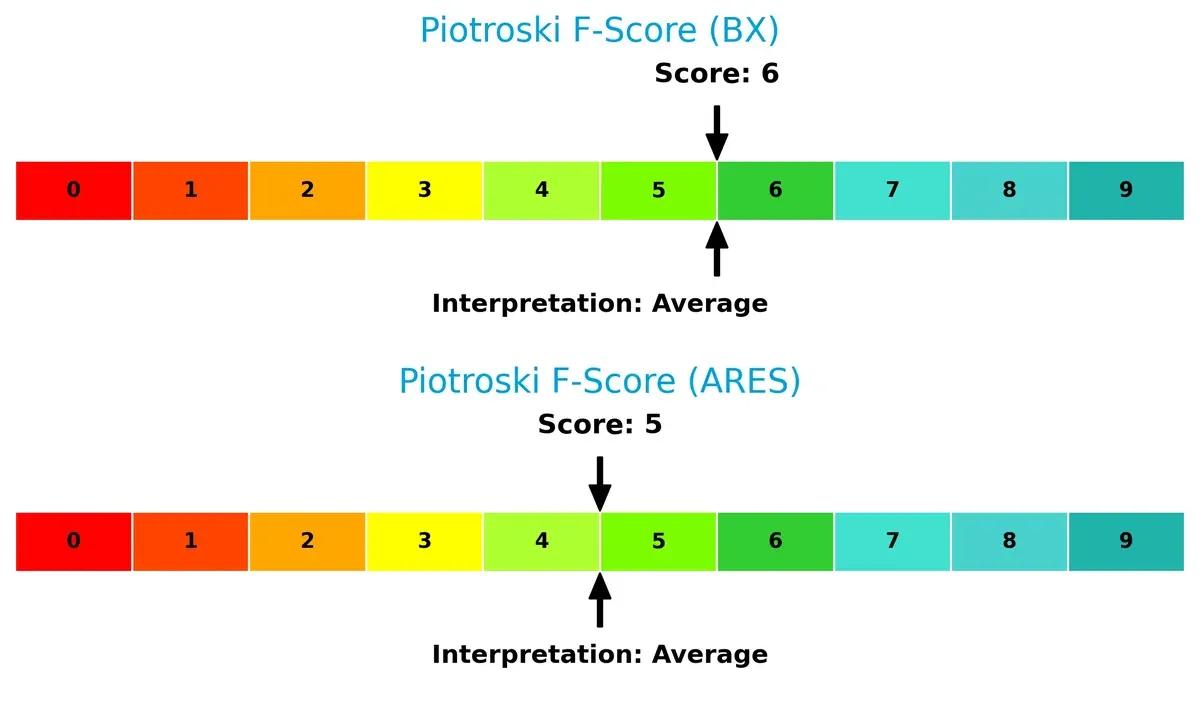
Financial Health: Quality of Operations
Blackstone posts a Piotroski F-Score of 6, indicating average but solid financial health with no immediate red flags. Ares Management scores slightly lower at 5, also average, suggesting slightly weaker internal financial signals but not alarming:
How are the two companies positioned?
This section dissects the operational DNA of BX and ARES by comparing their revenue distribution by segment and internal dynamics. The goal is to confront their economic moats to identify which model offers the most resilient competitive advantage today.
Revenue Segmentation: The Strategic Mix
This visual comparison dissects how Blackstone Inc. and Ares Management Corporation diversify their income streams and where their primary sector bets lie:
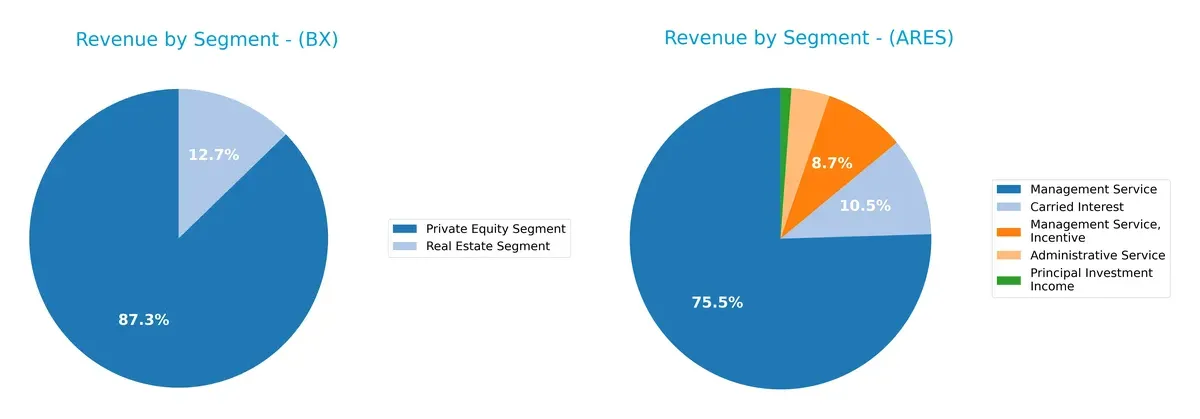
Blackstone leans heavily on its Private Equity Segment, generating $1.39B in 2024, with Real Estate trailing at $203M, showing moderate diversification. Ares Management, by contrast, spreads revenue across Management Service ($2.99B), Carried Interest ($417M), and Administrative Service ($163M), illustrating a more diversified model. Blackstone’s concentration signals a strong private equity moat but exposes it to segment risk. Ares pivots on fee-based services, reducing volatility and enhancing ecosystem lock-in.
Strengths and Weaknesses Comparison
This table compares the strengths and weaknesses of Blackstone Inc. and Ares Management Corporation based on diversification, profitability, financials, innovation, global presence, and market share:
Blackstone Inc. Strengths
- Diverse revenue from Private Equity, Real Estate, Hedge Funds, Credit segments
- Strong profitability with 21.8% net margin and 34.8% ROE
- Favorable ROIC at 17.2% above WACC
- Solid interest coverage at 14.1x
- Consistent dividend yield of 3.04%
Ares Management Corporation Strengths
- Revenue diversified across Administrative Service, Carried Interest, Management Service
- Favorable debt to equity and debt to assets ratios indicating conservative leverage
- Infinite interest coverage ratio
- Positive dividend yield at 2.77%
- Favorable price-to-book ratio indicating potential undervaluation
Blackstone Inc. Weaknesses
- Low current ratio at 0.85 signals liquidity risk
- High price-to-earnings and price-to-book ratios suggest overvaluation
- Elevated debt-to-equity ratio of 1.44 increases financial risk
- Asset turnover is low at 0.29 indicating less efficient asset use
Ares Management Corporation Weaknesses
- ROE and ROIC are zero, showing weak profitability
- Unavailable WACC complicates cost of capital assessment
- Poor liquidity with zero current and quick ratios
- High price-to-earnings ratio at 66.6 signals expensive valuation
- Low asset and fixed asset turnover ratios indicate inefficiency
Blackstone’s strengths lie in superior profitability and diversified revenue streams, but liquidity and valuation raise concerns. Ares shows conservative leverage and decent dividend yield but suffers from weak profitability and liquidity metrics. Both companies face valuation challenges relative to their fundamentals.
The Moat Duel: Analyzing Competitive Defensibility
A structural moat protects long-term profits from relentless competition erosion by sustaining superior returns and market positioning:
Blackstone Inc.: Diversified Alternative Asset Moat
Blackstone’s moat stems from its diversified asset management platform and scale, driving a strong ROIC 6.4% above WACC. Its margin stability and broad product suite position it well, though declining ROIC signals emerging pressure in 2026.
Ares Management Corporation: Focused Credit and Direct Lending Moat
Ares relies on niche credit and direct lending expertise, contrasting Blackstone’s breadth. Despite unavailable ROIC data, its expanding revenues and market focus suggest a growing moat, though profitability trends warn of operational challenges ahead.
The Moat Contest: Diversification vs. Niche Specialization
Blackstone holds a wider, more established moat supported by solid value creation despite recent ROIC decline. Ares shows promise in niche credit but lacks clear ROIC advantage. Blackstone is better equipped to defend market share in 2026.
Which stock offers better returns?
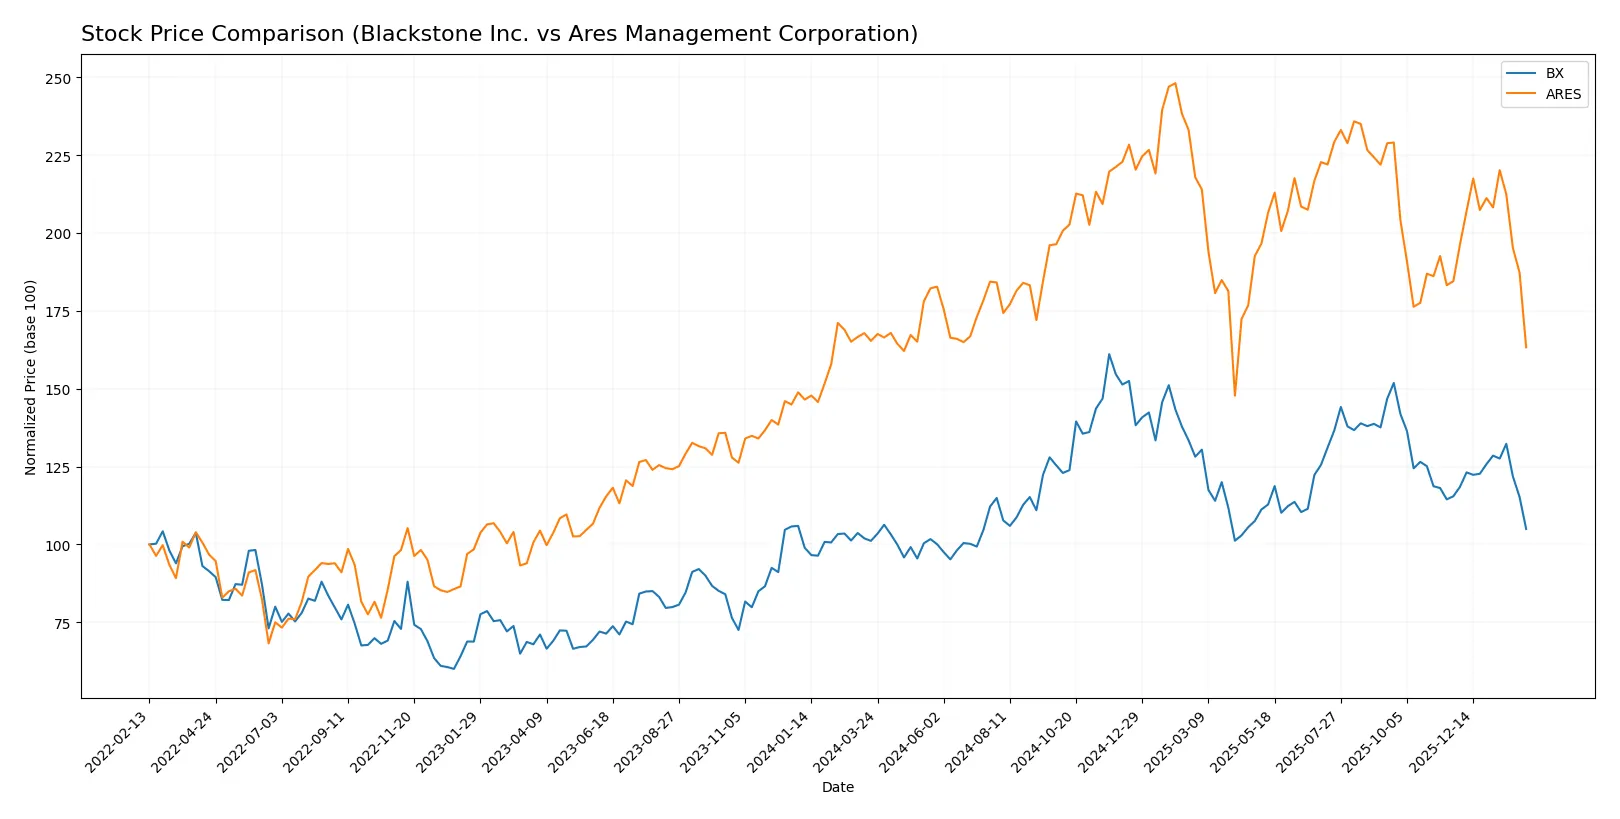
The past year shows Blackstone Inc. gaining 3.78%, marking a bullish but decelerating trend, while Ares Management Corporation declined 1.25%, indicating a bearish and slowing momentum.
Trend Comparison
Blackstone Inc. achieved a 3.78% price increase over 12 months, confirming a bullish trend with decelerating momentum. It peaked at 199.05 and bottomed at 117.62 during this period.
Ares Management Corporation fell 1.25% over the same timeframe, reflecting a bearish trend with deceleration. Its highest price reached 198.22, and lowest was 118.04.
Comparing both, Blackstone delivered superior market performance with a positive return, while Ares showed a mild decline. Blackstone’s trend outperformed Ares in the analyzed year.
Target Prices
Analysts present a bullish consensus for Blackstone Inc. and Ares Management Corporation with targets well above current prices.
| Company | Target Low | Target High | Consensus |
|---|---|---|---|
| Blackstone Inc. | 158 | 215 | 178.17 |
| Ares Management Corporation | 155 | 215 | 187.29 |
The consensus targets for both firms imply significant upside from current prices near 130. Analysts expect robust growth in alternative asset management despite market volatility.

Don’t Let Luck Decide Your Entry Point
Optimize your entry points with our advanced ProRealTime indicators. You’ll get efficient buy signals with precise price targets for maximum performance. Start outperforming now!
How do institutions grade them?
Blackstone Inc. Grades
The following table summarizes recent grades from established grading companies for Blackstone Inc.:
| Grading Company | Action | New Grade | Date |
|---|---|---|---|
| Piper Sandler | Maintain | Neutral | 2026-02-02 |
| TD Cowen | Maintain | Buy | 2026-01-30 |
| JP Morgan | Maintain | Neutral | 2026-01-30 |
| Citizens | Maintain | Market Outperform | 2026-01-30 |
| Barclays | Maintain | Equal Weight | 2026-01-30 |
| TD Cowen | Maintain | Buy | 2026-01-14 |
| UBS | Maintain | Neutral | 2026-01-13 |
| Barclays | Maintain | Equal Weight | 2026-01-09 |
| Barclays | Maintain | Equal Weight | 2025-12-12 |
| JP Morgan | Maintain | Neutral | 2025-10-24 |
Ares Management Corporation Grades
Below are recent grades from credible institutions for Ares Management Corporation:
| Grading Company | Action | New Grade | Date |
|---|---|---|---|
| Oppenheimer | Maintain | Outperform | 2026-02-06 |
| Barclays | Maintain | Overweight | 2026-02-06 |
| TD Cowen | Maintain | Buy | 2026-01-14 |
| UBS | Maintain | Neutral | 2026-01-13 |
| Barclays | Maintain | Overweight | 2026-01-09 |
| Barclays | Maintain | Overweight | 2025-12-12 |
| Keefe, Bruyette & Woods | Maintain | Outperform | 2025-11-04 |
| TD Cowen | Maintain | Buy | 2025-11-04 |
| Morgan Stanley | Maintain | Equal Weight | 2025-10-21 |
| Oppenheimer | Upgrade | Outperform | 2025-10-14 |
Which company has the best grades?
Ares Management receives consistently higher grades such as Outperform and Overweight compared to Blackstone’s Neutral and Equal Weight. This typically signals stronger institutional confidence in Ares, which may influence investor sentiment and portfolio considerations.
Risks specific to each company
The following categories identify the critical pressure points and systemic threats facing both firms in the 2026 market environment:
1. Market & Competition
Blackstone Inc.
- Dominates alternative asset management with a $156B market cap and diverse global investments.
Ares Management Corporation
- Smaller $43B firm with focused market segments but faces intense competition in credit and real estate.
2. Capital Structure & Debt
Blackstone Inc.
- High debt-to-equity ratio (1.44) signals leverage risk despite favorable debt-to-assets (26%).
Ares Management Corporation
- Debt metrics unavailable, but reported zero debt-to-equity implies conservative leverage or data gap.
3. Stock Volatility
Blackstone Inc.
- Beta of 1.76 indicates higher volatility than market, reflecting sensitivity to economic cycles.
Ares Management Corporation
- Lower beta at 1.54 shows relatively less volatility but still above market average.
4. Regulatory & Legal
Blackstone Inc.
- Operates globally with exposure to complex regulatory environments in multiple jurisdictions.
Ares Management Corporation
- Similar global presence but smaller scale may reduce regulatory complexity.
5. Supply Chain & Operations
Blackstone Inc.
- Diverse operations in real estate and private equity create operational complexity and integration risk.
Ares Management Corporation
- Focus on middle-market lending and real estate development involves operational execution risks.
6. ESG & Climate Transition
Blackstone Inc.
- Invests in alternative energy and greenfield projects, signaling active climate transition strategy.
Ares Management Corporation
- ESG efforts less highlighted, potential risk if market demands stronger sustainability focus.
7. Geopolitical Exposure
Blackstone Inc.
- Significant investments in Asia, Europe, and Latin America increase exposure to geopolitical risks.
Ares Management Corporation
- Also globally diversified but smaller footprint may limit geopolitical impact.
Which company shows a better risk-adjusted profile?
Blackstone’s biggest risk is its high leverage, which could strain the firm in tightening credit markets. Ares struggles with weaker profitability and unclear debt levels, raising financial stability concerns. Blackstone’s superior profitability and Altman Z-score in the safe zone give it a better risk-adjusted profile. Notably, Blackstone’s interest coverage ratio of 14.1 signals strong debt servicing ability despite leverage.
Final Verdict: Which stock to choose?
Blackstone Inc. (BX) stands out with its superpower of generating strong returns on capital, reflecting efficient capital allocation and a resilient business model. Its key point of vigilance is a relatively high valuation and leverage, which could pressure returns in volatile markets. BX suits portfolios targeting aggressive growth with a tolerance for cyclical risks.
Ares Management Corporation (ARES) builds its moat on niche specialization and recurring fee structures, offering a defensive profile compared to BX. While it lacks the same scale and has shown weaker profitability trends, its lower leverage and steadier income streams align well with investors seeking growth at a reasonable price and moderate volatility.
If you prioritize high return on invested capital and are comfortable with cyclicality, Blackstone outshines as the compelling choice due to its proven value creation and strong profitability. However, if you seek portfolio stability with moderate growth, Ares offers better stability through its more conservative financial structure and recurring revenue base despite its current operational challenges.
Disclaimer: Investment carries a risk of loss of initial capital. The past performance is not a reliable indicator of future results. Be sure to understand risks before making an investment decision.
Go Further
I encourage you to read the complete analyses of Blackstone Inc. and Ares Management Corporation to enhance your investment decisions: