Home > Comparison > Financial Services > BLK vs ARES
The strategic rivalry between BlackRock, Inc. and Ares Management Corporation shapes the asset management landscape. BlackRock operates as a global investment manager with a broad, diversified portfolio across asset classes. In contrast, Ares focuses on alternative investments, including private equity, credit, and real estate, targeting niche markets. This analysis evaluates which company’s operational model offers superior risk-adjusted returns for a diversified portfolio amid evolving financial sector dynamics.

Table of contents
Companies Overview
BlackRock and Ares Management dominate distinct niches within asset management, shaping global investment landscapes.
BlackRock, Inc.: Global Investment Powerhouse
BlackRock commands a leading position in institutional and retail asset management. Its core revenue arises from managing equity, fixed income, and alternative investment portfolios worldwide. In 2026, BlackRock sharpens its strategy on multi-asset and real estate investments, emphasizing global diversification and risk management across public and private markets.
Ares Management Corporation: Alternative Asset Specialist
Ares Management excels in alternative asset management across credit, private equity, and real estate sectors. It generates revenue through specialized credit funds, direct lending, and control investments in under-capitalized companies. Its 2026 focus targets expanding middle-market financing solutions and real estate repositioning, leveraging majority-control investments to unlock value.
Strategic Collision: Similarities & Divergences
Both firms prioritize asset growth but diverge in philosophy—BlackRock champions broad market exposure and open investment vehicles, while Ares pursues a control-driven, niche alternative strategy. They compete primarily in real estate and credit markets. BlackRock offers scale and diversification; Ares delivers targeted, high-conviction investments, presenting distinct risk-return profiles for investors.
Income Statement Comparison
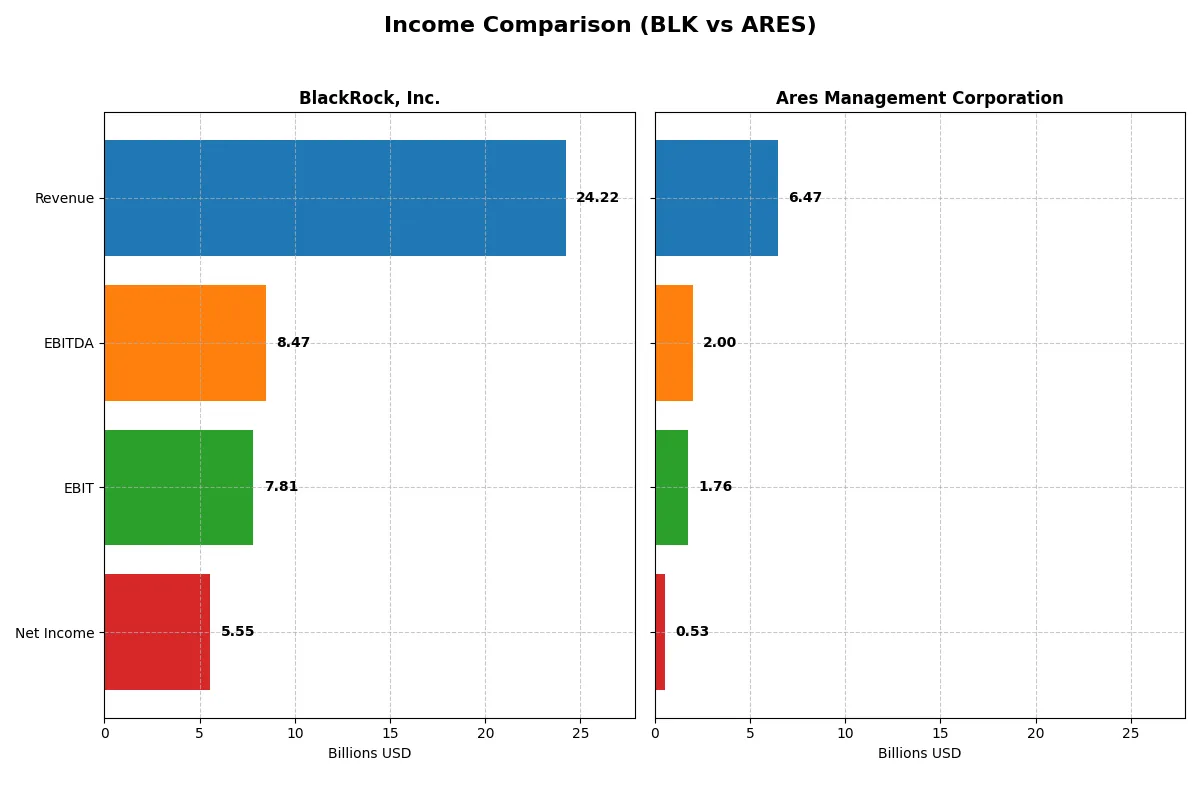
This data dissects the core profitability and scalability of both corporate engines to reveal who dominates the bottom line:
| Metric | BlackRock, Inc. (BLK) | Ares Management Corporation (ARES) |
|---|---|---|
| Revenue | 24.2B | 6.5B |
| Cost of Revenue | 10.8B | 1.4B |
| Operating Expenses | 6.4B | 1.0B |
| Gross Profit | 13.4B | 1.9B |
| EBITDA | 8.5B | 2.0B |
| EBIT | 7.8B | 1.8B |
| Interest Expense | 706M | 0 |
| Net Income | 5.6B | 427M |
| EPS | 35.84 | 1.96 |
| Fiscal Year | 2025 | 2025 |
Income Statement Analysis: The Bottom-Line Duel
This income statement comparison reveals which company operates with superior efficiency and profit conversion over recent years.
BlackRock, Inc. Analysis
BlackRock’s revenue climbed steadily from 19.4B in 2021 to 24.2B in 2025, reflecting strong top-line growth. Its net income, however, slipped from 5.9B in 2021 to 5.5B in 2025, signaling pressure on profitability. The company maintains robust gross (55.5%) and net margins (22.9%), though net margin and EPS declined recently, indicating margin compression despite higher revenues.
Ares Management Corporation Analysis
Ares posted rapid revenue expansion, surging from 4.2B in 2021 to 6.5B in 2025, a 54% increase overall. Net income grew 29% over the period, reaching 527M in 2025, but margins remain thinner, with a 30% gross and 8.2% net margin. The recent year saw a sharp revenue jump but margin deterioration and EPS decline, pointing to growing pains amid scale gains.
Margin Strength vs. Growth Velocity
BlackRock delivers stronger profitability with superior margins and stable earnings, while Ares exhibits faster revenue and net income growth but at thinner margins. BlackRock’s efficiency and margin resilience make it fundamentally stronger today. Investors seeking steady profitability will find BlackRock’s profile more compelling than Ares’ high-growth yet margin-challenged trajectory.
Financial Ratios Comparison
These vital ratios act as a diagnostic tool to expose the underlying fiscal health, valuation premiums, and capital efficiency of the companies compared:
| Ratios | BlackRock, Inc. (BLK) | Ares Management Corporation (ARES) |
|---|---|---|
| ROE | 13.41% (2024) | 13.09% (2024) |
| ROIC | 4.34% (2024) | 3.96% (2024) |
| P/E | 24.15 (2024) | 75.61 (2024) |
| P/B | 3.24 (2024) | 9.89 (2024) |
| Current Ratio | 16.40 (2024) | 0.98 (2024) |
| Quick Ratio | 16.40 (2024) | 0.98 (2024) |
| D/E (Debt-to-Equity) | 0.30 (2024) | 3.71 (2024) |
| Debt-to-Assets | 10.26% (2024) | 52.84% (2024) |
| Interest Coverage | 14.08 (2024) | 0.97 (2024) |
| Asset Turnover | 0.15 (2024) | 0.16 (2024) |
| Fixed Asset Turnover | 7.78 (2024) | 5.64 (2024) |
| Payout ratio | 48.69% (2024) | 282.68% (2024) |
| Dividend yield | 2.02% (2024) | 3.74% (2024) |
| Fiscal Year | 2024 | 2024 |
Efficiency & Valuation Duel: The Vital Signs
Financial ratios act as a company’s DNA, uncovering hidden risks and revealing operational strengths and weaknesses.
BlackRock, Inc.
BlackRock shows a strong net margin of 22.93%, signaling solid profitability despite an unfavorable ROE and ROIC. The stock trades at a stretched P/E of 29.9, reflecting premium valuation. Dividend yield stands neutral at 1.95%, balancing shareholder returns with reinvestment in growth and stability.
Ares Management Corporation
Ares displays a modest net margin of 8.15%, indicating moderate profitability. Its P/E ratio is highly stretched at 66.62, suggesting expensive valuation. The company offers a favorable dividend yield of 2.77%, emphasizing shareholder returns despite weaker core profitability metrics and operational inefficiencies.
Premium Valuation vs. Operational Safety
BlackRock balances solid profitability with a premium valuation, while Ares trades at a higher valuation with weaker margins. BlackRock suits investors prioritizing operational safety; Ares fits those seeking income amid higher risk.
Which one offers the Superior Shareholder Reward?
BlackRock, Inc. (BLK) offers a more balanced and sustainable shareholder reward than Ares Management Corporation (ARES). BLK pays a steady dividend with a 2.0% yield and a moderate 49% payout ratio, supported by strong free cash flow. It also maintains consistent buybacks, enhancing total return. ARES delivers a higher 3.7% dividend yield but with an unsustainably high payout ratio above 180%, relying heavily on debt and facing weak free cash flow coverage. ARES’s aggressive leverage and inconsistent buyback activity elevate risk. I conclude BLK’s disciplined capital allocation and sustainable distributions provide superior long-term value for investors in 2026.
Comparative Score Analysis: The Strategic Profile
The radar chart reveals the fundamental DNA and trade-offs of both firms, highlighting their relative strengths and weaknesses across key financial dimensions:
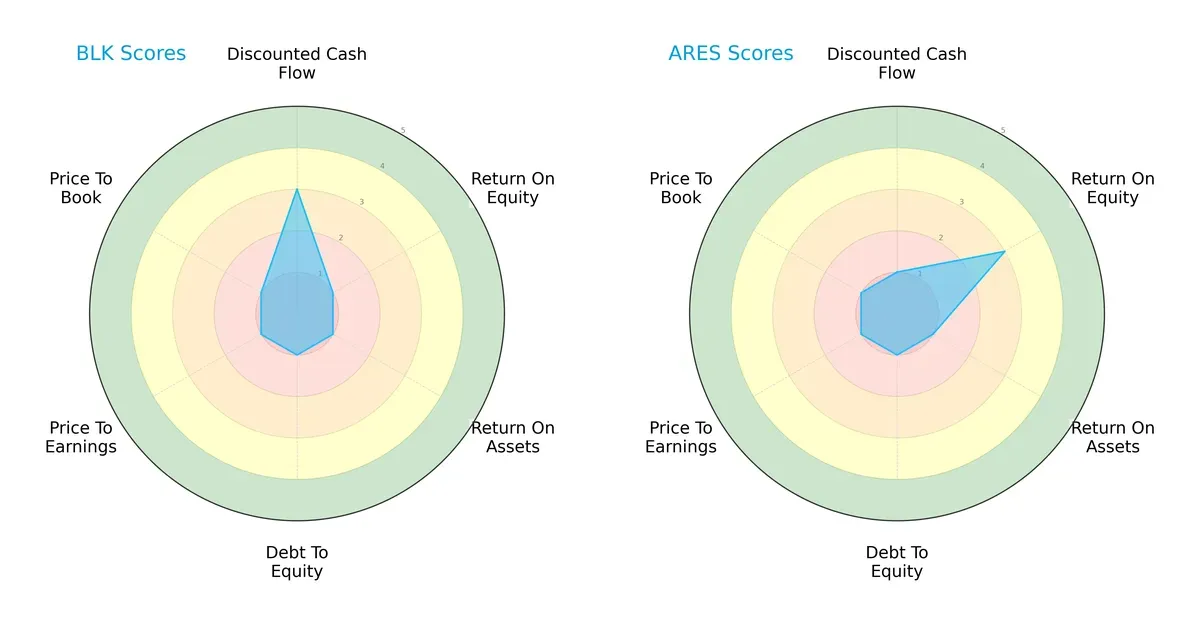
BlackRock posts a moderate edge in discounted cash flow with a score of 3, but it suffers from very unfavorable returns on equity and assets, as well as weak leverage and valuation metrics. Ares Management shows a stronger return on equity at 3, signaling better profitability, but lags in discounted cash flow and matches BlackRock’s low marks on leverage and valuation. Overall, BlackRock’s profile is more balanced around cash flow, while Ares leans heavily on its profitability edge.
Bankruptcy Risk: Solvency Showdown
BlackRock’s Altman Z-Score of 1.78 places it precariously in the distress zone, signaling significant bankruptcy risk in this cycle compared to Ares, whose score is unavailable for direct comparison:

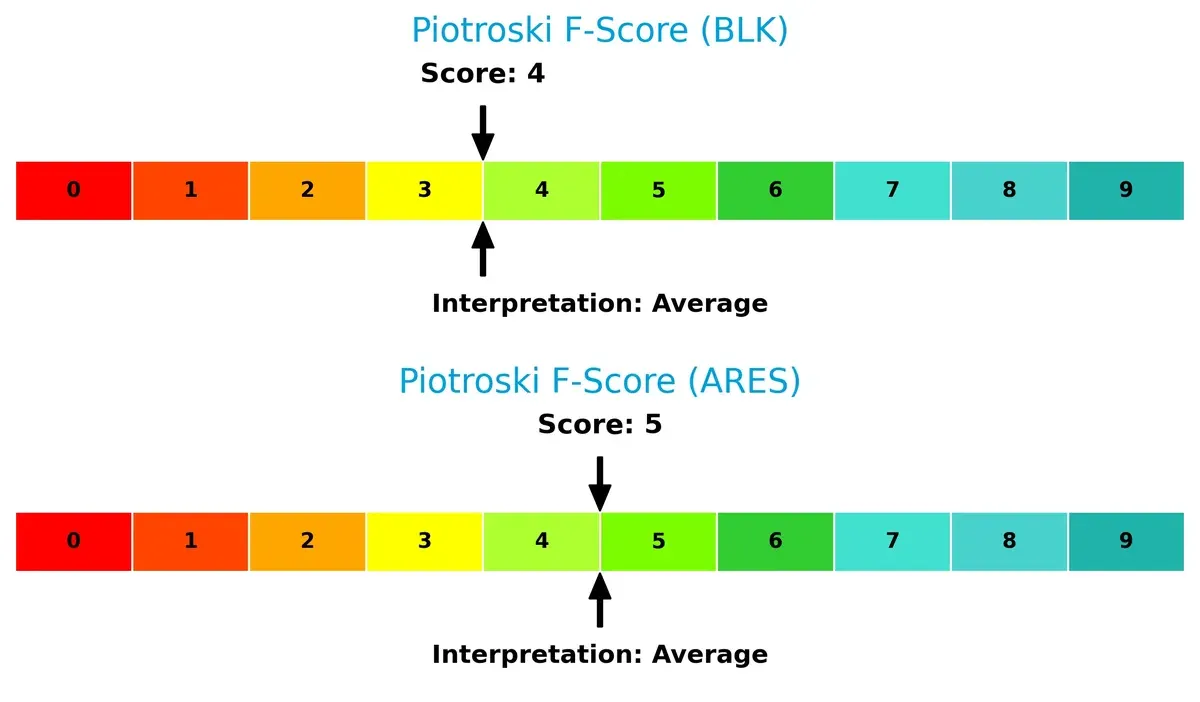
Financial Health: Quality of Operations
Both companies exhibit average Piotroski F-Scores, with BlackRock at 4 and Ares slightly better at 5, indicating moderate financial health but no clear leader. Neither shows red flags, but both have room for improvement to reach peak operational quality:
How are the two companies positioned?
This section dissects BlackRock and Ares Management’s operational DNA by comparing revenue distribution and internal strengths and weaknesses. The goal is to confront their economic moats and identify which model offers the most resilient competitive advantage today.
Revenue Segmentation: The Strategic Mix
This visual comparison dissects how BlackRock, Inc. and Ares Management Corporation diversify their income streams and where each places its primary sector bets:
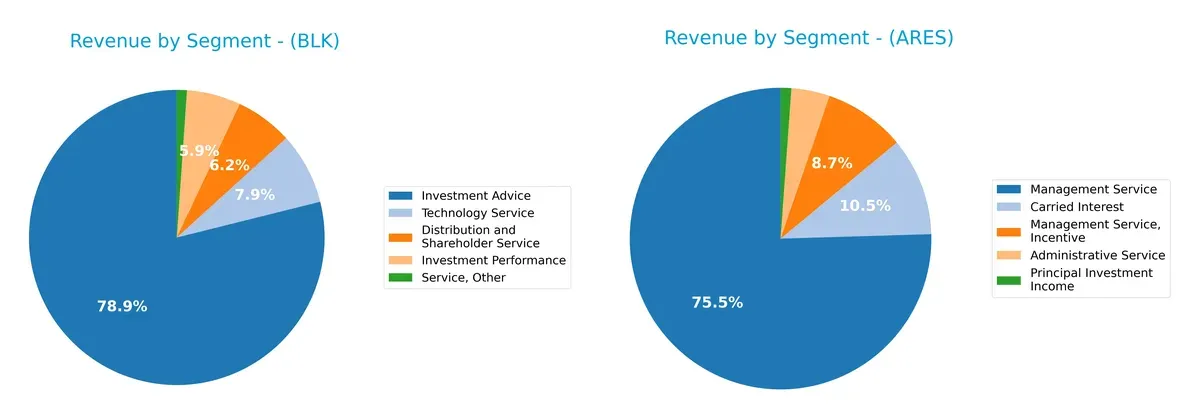
BlackRock anchors its revenue heavily in Investment Advice at $16.1B, dwarfing other segments like Technology Service ($1.6B). Ares Management shows a more balanced mix, with Management Service at $3B and Carried Interest at $417M, reflecting diversified fee and incentive income. BlackRock’s concentration signals ecosystem lock-in risk, while Ares’s spread suggests flexible exposure across asset classes, reducing sector concentration risk.
Strengths and Weaknesses Comparison
This table compares the strengths and weaknesses of BlackRock, Inc. and Ares Management Corporation:
BlackRock Strengths
- Diverse revenue streams including Investment Advice and Technology Services
- Strong global presence with significant revenues in Americas and Europe
- Favorable net margin at 22.93%
- Low debt-to-assets ratio and strong interest coverage
Ares Strengths
- Favorable interest coverage with infinite ratio
- Favorable debt-to-assets ratio and low leverage
- Dividend yield at 2.77% is attractive
- Favorable price-to-book ratio
BlackRock Weaknesses
- Unfavorable ROE and ROIC at 0%
- Unfavorable liquidity ratios with current and quick ratios at 0
- High P/E ratio of 29.9 is a valuation concern
- Unfavorable asset turnover metrics
Ares Weaknesses
- Unfavorable ROE and ROIC at 0%
- Unfavorable liquidity ratios with current and quick ratios at 0
- Very high P/E ratio of 66.62 signals overvaluation
- Unfavorable asset turnover metrics
BlackRock shows strong global diversification and profitability but faces challenges in return metrics and liquidity. Ares benefits from solid leverage and dividend metrics but contends with valuation and profitability deficits. Both companies share similar weaknesses in liquidity and operational efficiency.
The Moat Duel: Analyzing Competitive Defensibility
A structural moat shields long-term profits from relentless competitive pressures. Without it, market share and margins erode swiftly:
BlackRock, Inc.: Network Effects Powerhouse
BlackRock’s moat stems from powerful network effects via its extensive asset management platform. This manifests in stable margins near 23% net and resilient revenue growth of 25% over five years. Its global footprint, especially in Americas and Europe, deepens this advantage. In 2026, expanding real estate and ESG products could further entrench its dominance.
Ares Management Corporation: Niche Alternative Asset Specialist
Ares relies on specialized alternative asset management, focusing on control investments in private equity and credit markets. Compared to BlackRock’s broad scale, Ares commands a narrower but growing moat with 29% revenue growth over five years and improving net income by 29%. Its direct lending and real estate focus offer expansion opportunities but face higher margin volatility.
Moat Strength Showdown: Scale Network vs. Alternative Asset Focus
BlackRock’s vast scale and network effects create a wider moat, driving margin stability and diversified revenue streams. Ares shows a deeper but narrower moat in alternatives, with higher growth yet more margin fluctuation. BlackRock is better positioned to defend market share through unmatched scale and product breadth.
Which stock offers better returns?
Over the past 12 months, BlackRock, Inc. showed strong price appreciation with accelerating gains, while Ares Management Corporation experienced a slight decline with decelerating momentum.
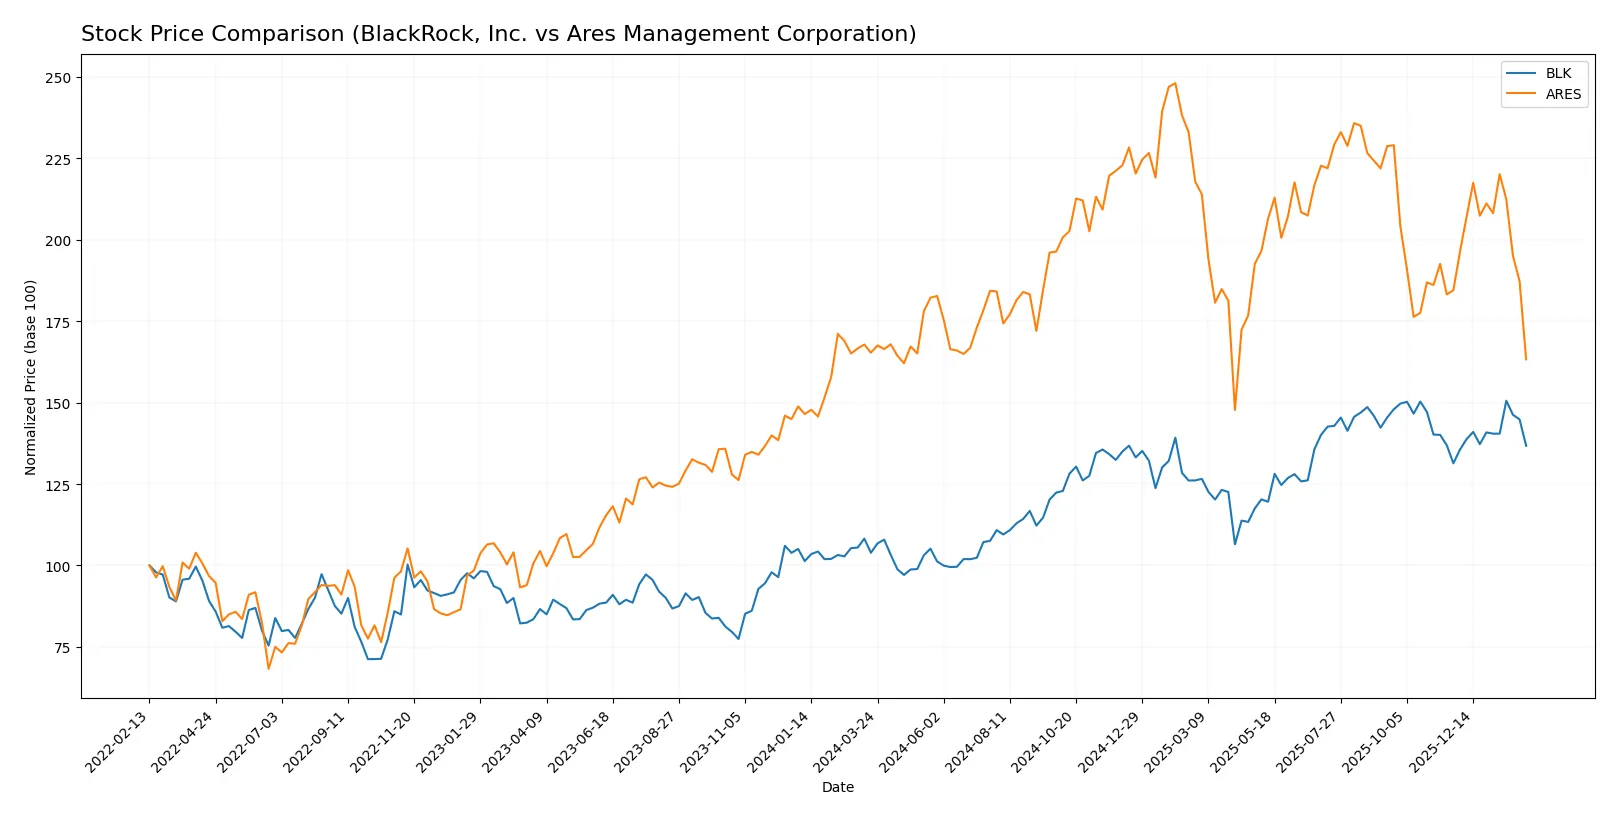
Trend Comparison
BlackRock’s stock rose 31.63% over the last year, reflecting a bullish trend with accelerating price gains and notable volatility indicated by a 120.53 standard deviation. The stock reached a high of 1163.17 and a low of 749.98.
Ares Management’s stock fell 1.25% over the same period, classifying as a bearish trend with decelerating price movement and lower volatility at 18.74 standard deviation. Its highest price was 198.22 and lowest 118.04.
Comparing these trends, BlackRock delivered the highest market performance with clear acceleration, while Ares showed mild depreciation and deceleration throughout the year.
Target Prices
Analysts present a bullish consensus for BlackRock, Inc. and Ares Management Corporation.
| Company | Target Low | Target High | Consensus |
|---|---|---|---|
| BlackRock, Inc. | 1,200 | 1,514 | 1,333.7 |
| Ares Management Corporation | 155 | 215 | 187.29 |
The target consensus for BlackRock suggests a 26% upside from its current 1,056 price. Ares Management shows a more aggressive 43% potential gain versus its 130 price.

Don’t Let Luck Decide Your Entry Point
Optimize your entry points with our advanced ProRealTime indicators. You’ll get efficient buy signals with precise price targets for maximum performance. Start outperforming now!
How do institutions grade them?
BlackRock, Inc. Grades
The following table summarizes recent grades from major institutions for BlackRock, Inc.:
| Grading Company | Action | New Grade | Date |
|---|---|---|---|
| Barclays | maintain | Overweight | 2026-01-16 |
| Keefe, Bruyette & Woods | maintain | Outperform | 2026-01-16 |
| UBS | maintain | Neutral | 2026-01-16 |
| TD Cowen | downgrade | Hold | 2026-01-14 |
| UBS | maintain | Neutral | 2026-01-12 |
| Barclays | maintain | Overweight | 2026-01-08 |
| Keefe, Bruyette & Woods | maintain | Outperform | 2026-01-08 |
| Morgan Stanley | maintain | Overweight | 2025-12-17 |
| Keefe, Bruyette & Woods | maintain | Outperform | 2025-12-17 |
| Barclays | maintain | Overweight | 2025-12-12 |
Ares Management Corporation Grades
The following table summarizes recent grades from major institutions for Ares Management Corporation:
| Grading Company | Action | New Grade | Date |
|---|---|---|---|
| Oppenheimer | maintain | Outperform | 2026-02-06 |
| Barclays | maintain | Overweight | 2026-02-06 |
| TD Cowen | maintain | Buy | 2026-01-14 |
| UBS | maintain | Neutral | 2026-01-13 |
| Barclays | maintain | Overweight | 2026-01-09 |
| Barclays | maintain | Overweight | 2025-12-12 |
| Keefe, Bruyette & Woods | maintain | Outperform | 2025-11-04 |
| TD Cowen | maintain | Buy | 2025-11-04 |
| Morgan Stanley | maintain | Equal Weight | 2025-10-21 |
| Oppenheimer | upgrade | Outperform | 2025-10-14 |
Which company has the best grades?
Ares Management Corporation consistently holds strong ratings with several Outperform and Buy grades, including a recent upgrade by Oppenheimer. BlackRock, Inc. shows mostly Overweight and Outperform grades but includes a downgrade to Hold by TD Cowen. Investors may view Ares as having a marginally more bullish consensus, potentially indicating higher near-term confidence.
Risks specific to each company
The following categories identify the critical pressure points and systemic threats facing both firms in the 2026 market environment:
1. Market & Competition
BlackRock, Inc.
- Dominates global asset management with a broad product range but faces intense competition from fintech and passive funds.
Ares Management Corporation
- Focuses on alternative assets and private equity, competing in niche markets but vulnerable to shifts in credit markets.
2. Capital Structure & Debt
BlackRock, Inc.
- Strong balance sheet with favorable debt ratios and solid interest coverage at 11x.
Ares Management Corporation
- Also shows favorable debt metrics and infinite interest coverage, indicating low debt risk.
3. Stock Volatility
BlackRock, Inc.
- Beta at 1.49 suggests above-market volatility, increasing risk in turbulent markets.
Ares Management Corporation
- Slightly higher beta at 1.54, implying marginally higher sensitivity to market swings.
4. Regulatory & Legal
BlackRock, Inc.
- Faces complex global regulations impacting investment products and fiduciary duties.
Ares Management Corporation
- Subject to regulations in multiple jurisdictions, especially impacting credit and private equity operations.
5. Supply Chain & Operations
BlackRock, Inc.
- Operations depend on technology platforms and data integrity; cyber risks are material.
Ares Management Corporation
- Relies heavily on deal flow and operational execution in private markets, vulnerable to market liquidity.
6. ESG & Climate Transition
BlackRock, Inc.
- ESG integration is a core strategy but exposes firm to transition risks and reputational challenges.
Ares Management Corporation
- Increasing focus on ESG in real assets and credit, yet slower adaptation may pose risks.
7. Geopolitical Exposure
BlackRock, Inc.
- Extensive global footprint exposes it to geopolitical tensions and regulatory fragmentation.
Ares Management Corporation
- Regional focus in US, Europe, and Asia entails geopolitical risks, especially in credit markets.
Which company shows a better risk-adjusted profile?
BlackRock’s most impactful risk is its market volatility combined with regulatory complexity amid global expansion. Ares faces greater exposure from niche credit markets and deal execution risks. Both show slightly unfavorable financial ratios and similar debt strength. However, BlackRock’s scale and diversified product base offer a more balanced risk-adjusted profile. Notably, BlackRock’s high interest coverage ratio (11x) contrasts with Ares’ infinite coverage but smaller market cap, signaling stronger financial flexibility for BlackRock in volatile 2026 markets.
Final Verdict: Which stock to choose?
BlackRock’s superpower lies in its unmatched operational efficiency and strong income quality, making it a reliable cash machine in asset management. Its point of vigilance is the slight decline in profitability growth and elevated valuation multiples. It fits well in an Aggressive Growth portfolio seeking steady market leadership.
Ares Management commands a strategic moat through its niche in alternative investments and recurring fee structures, offering a differentiated revenue base. Relative to BlackRock, it presents a more volatile but potentially rewarding profile with moderate safety. It suits a GARP (Growth at a Reasonable Price) portfolio aiming for selective exposure to private markets.
If you prioritize operational efficiency and market dominance, BlackRock is the compelling choice due to its consistent cash generation and robust income quality. However, if you seek growth backed by a unique alternative asset moat and can tolerate higher volatility, Ares offers better growth potential. Both present analytical scenarios requiring careful risk management.
Disclaimer: Investment carries a risk of loss of initial capital. The past performance is not a reliable indicator of future results. Be sure to understand risks before making an investment decision.
Go Further
I encourage you to read the complete analyses of BlackRock, Inc. and Ares Management Corporation to enhance your investment decisions: