Home > Comparison > Consumer Defensive > ADM vs TSN
The strategic rivalry between Archer-Daniels-Midland Company and Tyson Foods, Inc. defines the current trajectory of the agricultural farm products sector. ADM operates as a diversified processor and merchandiser of agricultural commodities, emphasizing ingredient innovation and global distribution. Tyson focuses on protein-centric food manufacturing, spanning beef, pork, chicken, and prepared foods. This analysis evaluates which corporate model offers superior risk-adjusted returns for diversified portfolios amid evolving consumer and supply chain dynamics.
Table of contents
Companies Overview
Archer-Daniels-Midland and Tyson Foods stand as pillars in the global agricultural and food sectors.
Archer-Daniels-Midland Company: Global Agricultural Commodities Leader
Archer-Daniels-Midland Company dominates the agricultural commodities market by procuring, processing, and merchandising raw materials like oilseeds, corn, and wheat. Its revenue engine centers on three segments: Ag Services and Oilseeds, Carbohydrate Solutions, and Nutrition. In 2026, ADM’s strategic focus remains on expanding its ingredient solutions for food, feed, and industrial customers, emphasizing natural health and nutrition products.
Tyson Foods, Inc.: Diversified Protein and Prepared Foods Powerhouse
Tyson Foods excels in the meat processing industry by fabricating beef, pork, and chicken products and marketing prepared foods under well-known brands. Its core revenue derives from its four segments: Beef, Pork, Chicken, and Prepared Foods. In 2026, Tyson prioritizes broadening its product portfolio and enhancing distribution to grocery retailers, food service operations, and international markets.
Strategic Collision: Similarities & Divergences
Both companies operate within the consumer defensive agricultural sector but adopt contrasting philosophies. ADM leans on a broad commodity-based, ingredient-driven model, while Tyson pursues vertical integration in protein processing and branded foods. Their primary battleground is the evolving food supply chain, where ADM focuses on raw materials and ingredients, and Tyson targets consumer-ready protein products. These differences carve distinct investment profiles centered on commodity exposure versus branded product resilience.
Income Statement Comparison
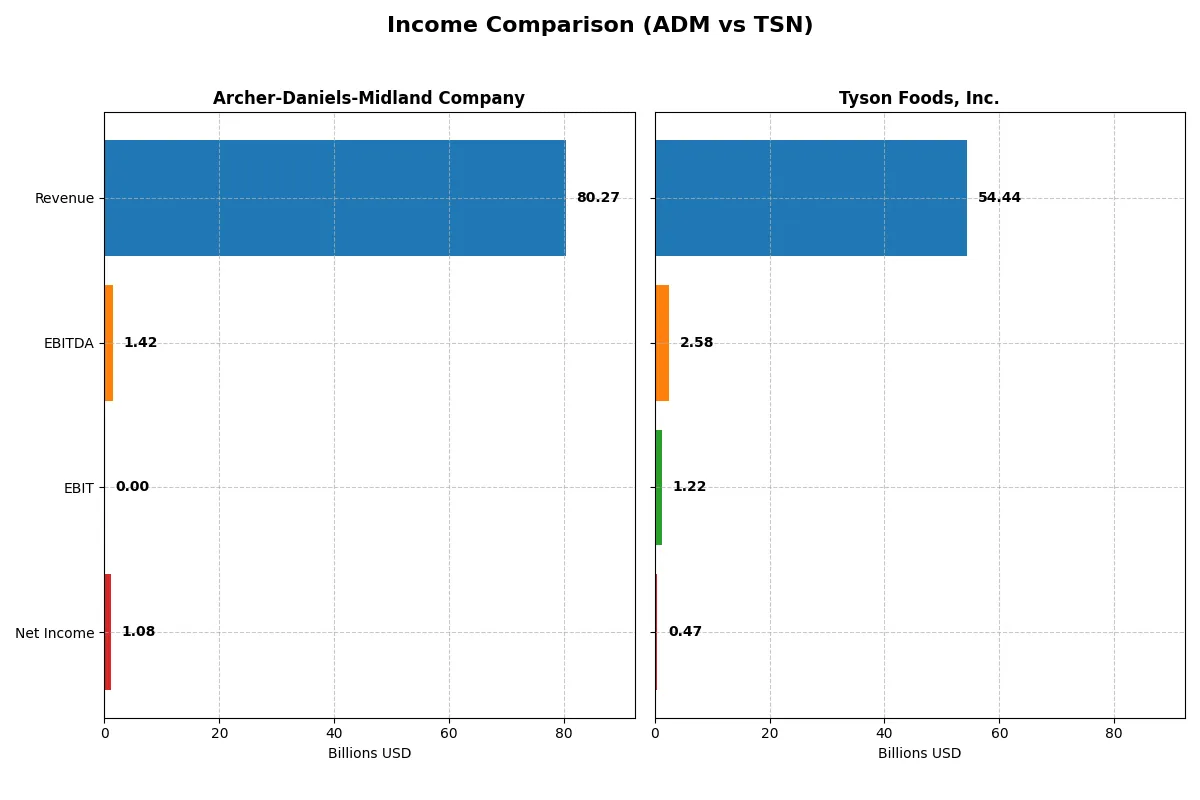
This data dissects the core profitability and scalability of both corporate engines to reveal who dominates the bottom line:
| Metric | Archer-Daniels-Midland Company (ADM) | Tyson Foods, Inc. (TSN) |
|---|---|---|
| Revenue | 80.3B | 54.4B |
| Cost of Revenue | 75.2B | 50.9B |
| Operating Expenses | 3.61B | 2.12B |
| Gross Profit | 5.03B | 3.56B |
| EBITDA | 1.42B | 2.58B |
| EBIT | 1.42B | 1.22B |
| Interest Expense | 118M | 449M |
| Net Income | 1.08B | 474M |
| EPS | 2.23 | 1.36 |
| Fiscal Year | 2025 | 2025 |
Income Statement Analysis: The Bottom-Line Duel
This income statement comparison reveals each company’s operational efficiency and profitability momentum through recent fiscal years.
Archer-Daniels-Midland Company Analysis
ADM’s revenue declined steadily from 102B in 2022 to 80B in 2025, dragging net income from 4.34B to 1.08B. Gross margin contracted to 6.27%, signaling margin pressure. The 2025 net margin stood at a modest 1.34%, reflecting weakened earnings efficiency and a sharp drop in EBIT to zero, highlighting operational challenges.
Tyson Foods, Inc. Analysis
TSN posted modest revenue growth from 47B in 2021 to 54B in 2025, with net income tumbling from 3.05B to 474M. Gross margin held steady around 6.5%, while EBIT margin improved to 2.24%. Despite recent one-year declines in profitability metrics, TSN’s operating income and margin profile remain more resilient than ADM’s.
Verdict: Margin Resilience vs. Revenue Contraction
TSN sustains healthier margins and operating income despite sharp net income declines, while ADM faces severe erosion in profitability amid shrinking revenues. TSN’s profile offers a steadier earnings base, whereas ADM’s steep margin compression signals deeper operational stress. Investors seeking margin resilience may find TSN’s trajectory more compelling.
Financial Ratios Comparison
These vital ratios act as a diagnostic tool to expose the underlying fiscal health, valuation premiums, and capital efficiency of the companies compared below:
| Ratios | Archer-Daniels-Midland Company (ADM) | Tyson Foods, Inc. (TSN) |
|---|---|---|
| ROE | 8.12% (2024) | 2.62% (2025) |
| ROIC | 4.51% (2024) | 3.05% (2025) |
| P/E | 13.42 (2024) | 26.41 (2024) |
| P/B | 1.09 (2024) | 1.15 (2024) |
| Current Ratio | 1.39 (2024) | 2.04 (2024) |
| Quick Ratio | 0.81 (2024) | 0.95 (2024) |
| D/E | 0.52 (2024) | 0.53 (2024) |
| Debt-to-Assets | 21.66% (2024) | 26.38% (2024) |
| Interest Coverage | 2.93 (2024) | 2.93 (2024) |
| Asset Turnover | 1.61 (2024) | 1.44 (2024) |
| Fixed Asset Turnover | 7.01 (2024) | 5.65 (2024) |
| Payout Ratio | 54.7% (2024) | 85.5% (2024) |
| Dividend Yield | 4.08% (2024) | 3.24% (2024) |
| Fiscal Year | 2024 | 2024 |
Efficiency & Valuation Duel: The Vital Signs
Financial ratios act as a company’s DNA, exposing hidden risks and operational strengths vital for precise investment analysis.
Archer-Daniels-Midland Company
ADM struggles with profitability, showing a net margin of just 1.34% and zero return on equity, signaling operational challenges. Its P/E ratio at 25.81 suggests the stock is stretched relative to earnings. The firm supports shareholders with a 3.55% dividend yield, reflecting a preference for income over reinvestment amid weak growth signals.
Tyson Foods, Inc.
TSN posts modest profitability, with a 0.87% net margin and a 2.62% ROE, indicating limited efficiency. Its P/E ratio of 39.79 marks the stock as expensive and possibly overvalued. The company balances risk with a 3.7% dividend yield and maintains a favorable current ratio of 1.55, highlighting liquidity strength amid operational pressures.
Valuation Stretch vs. Operational Resilience
TSN offers better liquidity and more favorable ratio coverage but trades at a premium with limited profitability. ADM, while less profitable and operationally challenged, provides a solid dividend yield at a lower valuation multiple. Risk-tolerant investors may prefer TSN’s resilience; income-focused investors might lean toward ADM’s steady payout.
Which one offers the Superior Shareholder Reward?
I see Tyson Foods (TSN) offers a slightly higher dividend yield near 3.7% versus Archer-Daniels-Midland (ADM) around 3.5%. However, ADM maintains a more conservative payout ratio (~55% in 2024 vs. TSN’s 85%), signaling safer dividends. Both firms buy back shares, but ADM’s free cash flow coverage is stronger, sustaining its distributions better. TSN’s payout ratio near 1.47 in 2025 raises red flags on dividend sustainability despite a decent yield. Historically, ADM’s balanced dividend and buyback approach suggests more durable shareholder value in 2026. I conclude ADM delivers a more attractive total return profile considering yield safety and capital allocation discipline.
Comparative Score Analysis: The Strategic Profile
The radar chart reveals the fundamental DNA and trade-offs of Archer-Daniels-Midland Company (ADM) and Tyson Foods, Inc. (TSN), highlighting their strategic strengths and vulnerabilities:
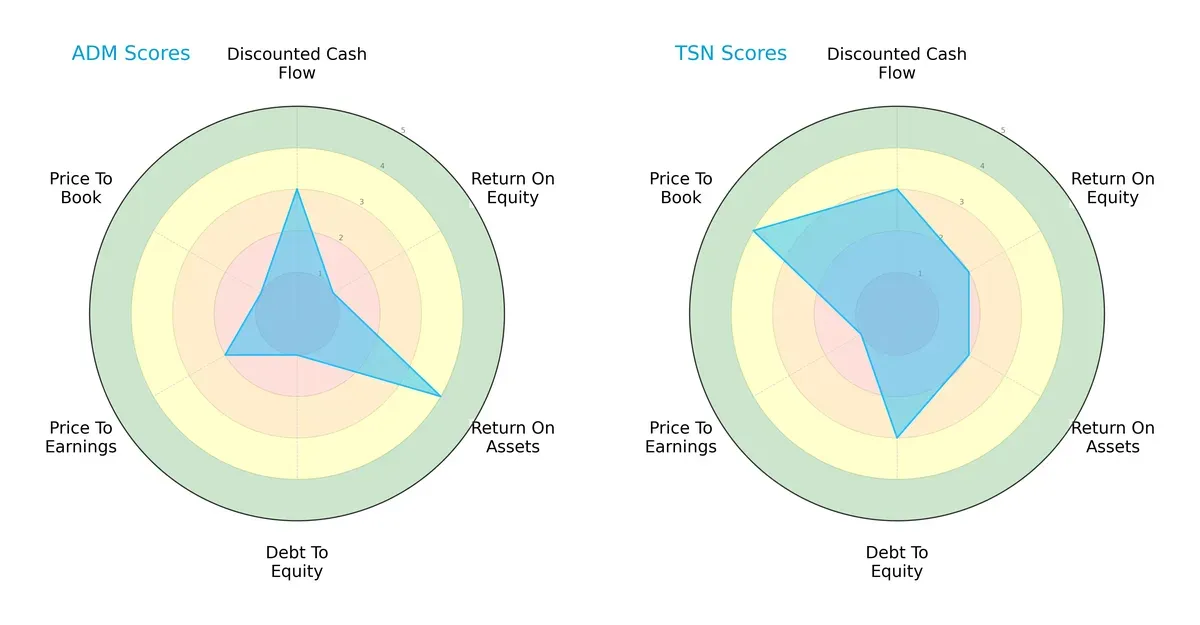
ADM shows strength in return on assets (score 4), indicating efficient asset utilization. However, it struggles with return on equity (score 1) and debt-to-equity (score 1), signaling financial leverage risks. TSN delivers a more balanced profile with moderate scores across ROE (2), ROA (2), and debt-to-equity (3), though it faces valuation challenges, reflected by a low price-to-earnings score (1). TSN’s overall score (3) slightly surpasses ADM’s (2), suggesting a steadier financial footing versus ADM’s reliance on asset efficiency.
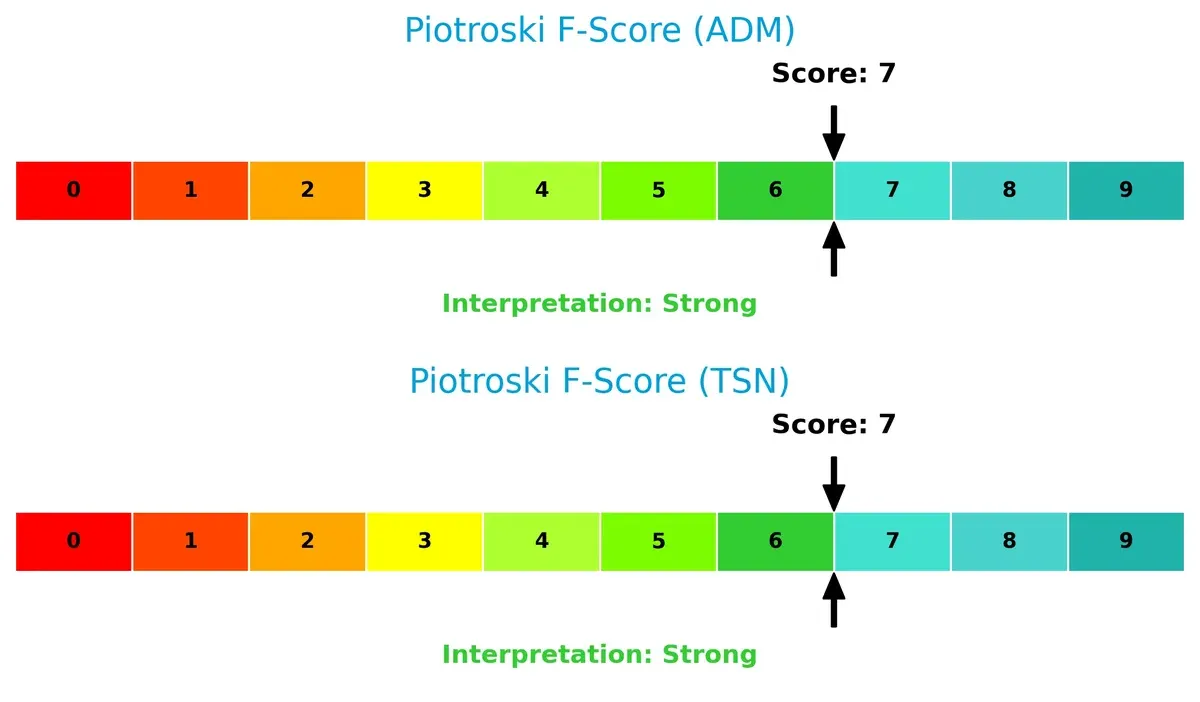
Financial Health: Quality of Operations
Both ADM and TSN score a 7 on the Piotroski F-Score, signaling strong financial health. This indicates robust profitability, liquidity, and operational efficiency without glaring red flags:
How are the two companies positioned?
This section dissects ADM and TSN’s operational DNA by comparing revenue distribution and internal dynamics. It aims to confront their economic moats to identify the most resilient, sustainable competitive advantage.
Revenue Segmentation: The Strategic Mix
The following visual comparison dissects how Archer-Daniels-Midland Company and Tyson Foods diversify their income streams and where their primary sector bets lie:
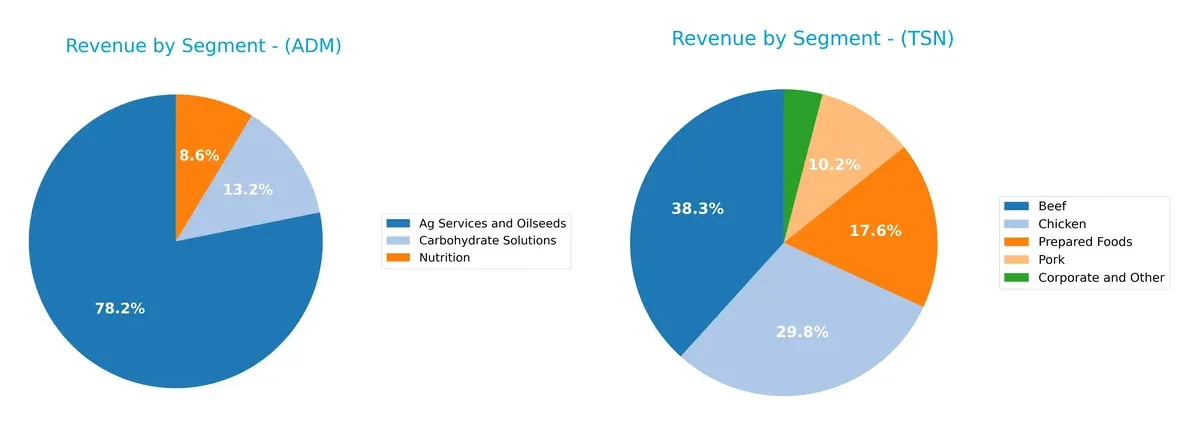
Archer-Daniels-Midland Company anchors its revenue in Ag Services and Oilseeds with $66.5B in 2024, complemented by Carbohydrate Solutions at $11.2B and Nutrition at $7.3B. This mix shows moderate diversification. Tyson Foods leans on Beef at $21.6B and Chicken at $16.8B, but also gains substantial revenue from Prepared Foods ($9.9B) and Pork ($5.8B), revealing a broader protein portfolio. Tyson’s segmentation reduces concentration risk compared to ADM’s commodity-focused dominance.
Strengths and Weaknesses Comparison
This table compares the Strengths and Weaknesses of Archer-Daniels-Midland Company (ADM) and Tyson Foods, Inc. (TSN):
ADM Strengths
- Diverse revenue streams from Ag Services, Carbohydrate Solutions, and Nutrition segments
- Strong global presence with significant US and Switzerland sales
- Favorable debt-to-assets and dividend yield metrics
TSN Strengths
- Wide product diversification across Beef, Chicken, Pork, and Prepared Foods
- Favorable financial ratios including WACC, asset turnover, and debt ratios
- Higher dividend yield and solid current ratio
ADM Weaknesses
- Unfavorable profitability metrics: net margin, ROE, ROIC
- Unfavorable liquidity ratios: current and quick ratio
- High PE ratio and weak interest coverage ratio
- Limited innovation insight from data
TSN Weaknesses
- Unfavorable profitability metrics: net margin, ROE, ROIC
- Elevated PE ratio indicates potential overvaluation
- Quick ratio below 1 signals liquidity concerns
Both companies exhibit diversification and strong global or product reach. However, ADM struggles with profitability and liquidity more severely, while TSN shows better financial health but still faces profitability and valuation challenges. These insights highlight areas for strategic focus on improving operational efficiency and financial stability.
The Moat Duel: Analyzing Competitive Defensibility
A structural moat is the only true defense against competition eroding long-term profits. Let’s examine how ADM and Tyson Foods protect their turf:
Archer-Daniels-Midland Company (ADM): Global Supply Chain and Commodity Scale
ADM’s moat centers on its vast, integrated agricultural supply chain and commodity scale. This manifests in stable gross margins but weak EBIT margins and declining profitability. In 2026, expanding specialty ingredients could deepen its moat but margin pressures remain a threat.
Tyson Foods, Inc. (TSN): Brand Portfolio and Vertical Integration
Tyson’s moat relies on strong brand recognition and vertical integration across meat processing. It achieves slightly better EBIT margins than ADM but suffers from value destruction indicated by ROIC below WACC. New product innovation and international expansion offer upside but face margin headwinds.
Global Supply Chain vs. Brand Power: Who Holds the Moat Stronger?
ADM leverages scale in commodity sourcing, while Tyson banks on brand and integration. Both face profitability declines, but ADM’s global network offers broader reach. I see ADM better positioned to defend market share despite current challenges.
Which stock offers better returns?
Over the past 12 months, Archer-Daniels-Midland Company and Tyson Foods, Inc. showed strong price appreciation with accelerating bullish trends and notable trading volume dynamics.
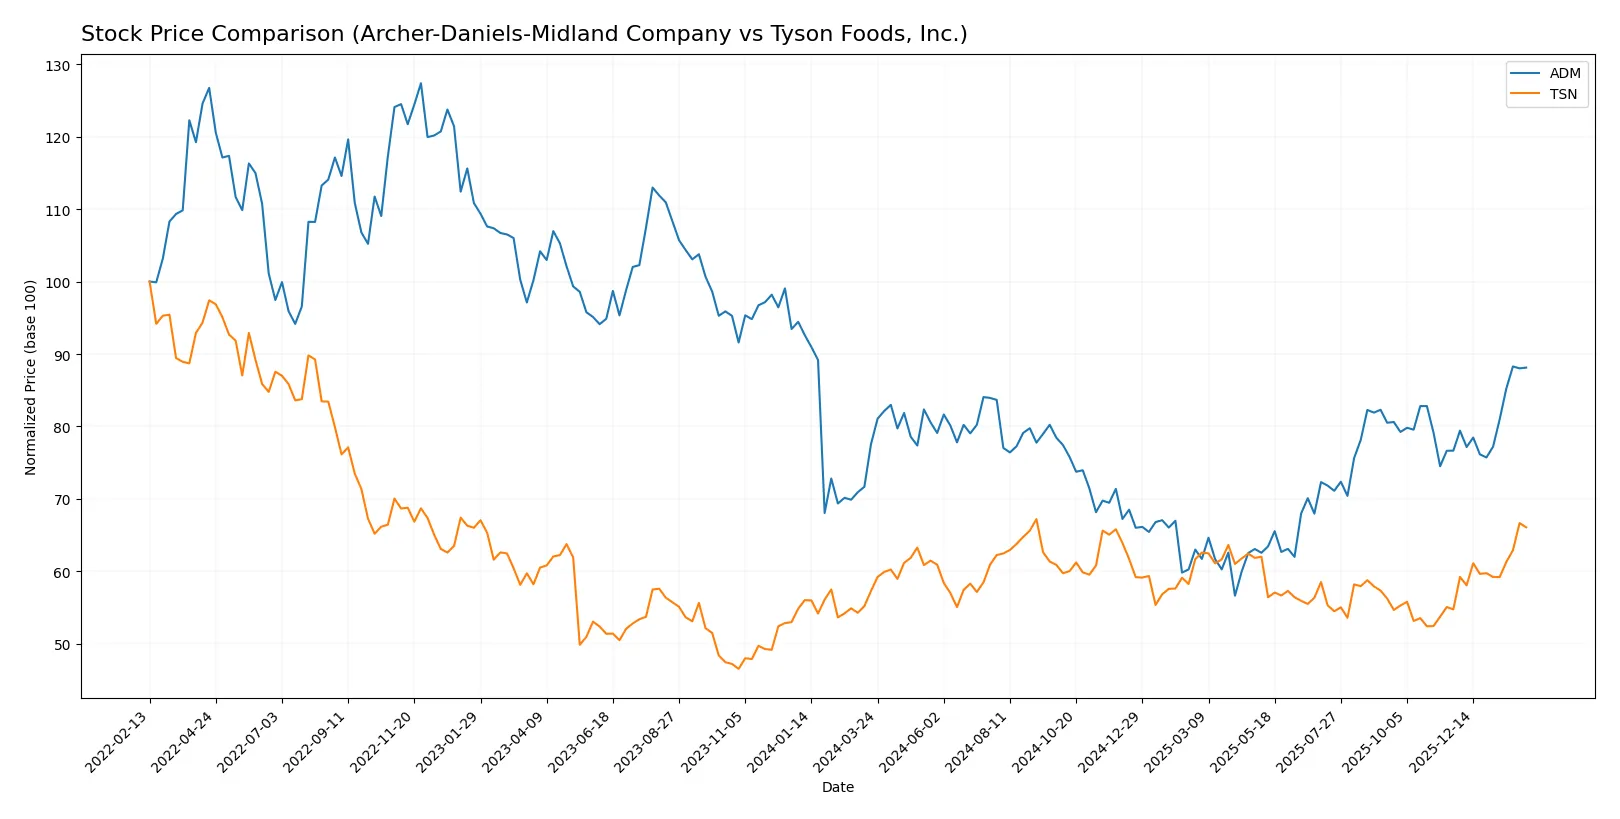
Trend Comparison
Archer-Daniels-Midland’s stock rose 13.62% over the past year, showing an accelerating bullish trend with a 5.92 volatility and a high near 67.51. Recent gains accelerated to nearly 15%.
Tyson Foods gained 15.33% over the same period, also accelerating bullish momentum with lower volatility of 3.29 and a peak price of 65.87. Recent returns surged 20.66%.
Tyson Foods outperformed Archer-Daniels-Midland, delivering the highest price appreciation and more stable upward momentum in the past 12 months.
Target Prices
Analysts present a cautious consensus with target prices below current market levels for both companies.
| Company | Target Low | Target High | Consensus |
|---|---|---|---|
| Archer-Daniels-Midland Company | 50 | 59 | 54.5 |
| Tyson Foods, Inc. | 61 | 78 | 70.25 |
The consensus target prices suggest a downside risk for ADM, trading at 67.39, and moderate upside potential for TSN, trading at 64.76. Analysts expect TSN to outperform ADM relative to current prices.

Don’t Let Luck Decide Your Entry Point
Optimize your entry points with our advanced ProRealTime indicators. You’ll get efficient buy signals with precise price targets for maximum performance. Start outperforming now!
How do institutions grade them?
This section compares institutional grades assigned to Archer-Daniels-Midland Company and Tyson Foods, Inc.:
Archer-Daniels-Midland Company Grades
The following table summarizes recent institutional grades for Archer-Daniels-Midland Company:
| Grading Company | Action | New Grade | Date |
|---|---|---|---|
| JP Morgan | Maintain | Underweight | 2026-01-21 |
| Morgan Stanley | Downgrade | Underweight | 2025-12-16 |
| JP Morgan | Downgrade | Underweight | 2025-11-05 |
| Morgan Stanley | Maintain | Equal Weight | 2025-08-12 |
| UBS | Maintain | Buy | 2025-08-11 |
| Barclays | Upgrade | Equal Weight | 2025-08-06 |
| Barclays | Maintain | Underweight | 2025-07-02 |
| UBS | Upgrade | Buy | 2025-05-19 |
| B of A Securities | Downgrade | Underperform | 2025-05-08 |
| Citigroup | Maintain | Neutral | 2025-04-15 |
Tyson Foods, Inc. Grades
The following table summarizes recent institutional grades for Tyson Foods, Inc.:
| Grading Company | Action | New Grade | Date |
|---|---|---|---|
| JP Morgan | Maintain | Neutral | 2026-02-03 |
| Barclays | Maintain | Overweight | 2026-02-03 |
| BMO Capital | Maintain | Outperform | 2026-02-03 |
| BMO Capital | Upgrade | Outperform | 2026-01-08 |
| Piper Sandler | Maintain | Neutral | 2025-12-12 |
| BMO Capital | Maintain | Market Perform | 2025-11-11 |
| B of A Securities | Maintain | Neutral | 2025-10-08 |
| Bernstein | Downgrade | Market Perform | 2025-07-23 |
| Stephens & Co. | Maintain | Equal Weight | 2025-05-06 |
| JP Morgan | Maintain | Neutral | 2025-05-06 |
Which company has the best grades?
Tyson Foods, Inc. holds higher and more consistent grades, including multiple Outperform and Overweight ratings. Archer-Daniels-Midland Company’s grades trend lower, often Underweight or Neutral. Investors may perceive Tyson as having stronger institutional support and potentially better growth prospects.
Risks specific to each company
The following categories identify the critical pressure points and systemic threats facing Archer-Daniels-Midland Company (ADM) and Tyson Foods, Inc. (TSN) in the 2026 market environment:
1. Market & Competition
Archer-Daniels-Midland Company (ADM)
- Faces intense competition in agricultural commodities with pressure on margins.
Tyson Foods, Inc. (TSN)
- Competes in diversified meat markets with brand strength but faces pricing pressures.
2. Capital Structure & Debt
Archer-Daniels-Midland Company (ADM)
- Maintains a conservative debt profile but struggles with weak interest coverage.
Tyson Foods, Inc. (TSN)
- Moderate debt with manageable leverage and neutral interest coverage ratio.
3. Stock Volatility
Archer-Daniels-Midland Company (ADM)
- Beta of 0.68 indicates moderate stock volatility below market average.
Tyson Foods, Inc. (TSN)
- Lower beta of 0.47 suggests less price fluctuation and defensive characteristics.
4. Regulatory & Legal
Archer-Daniels-Midland Company (ADM)
- Exposed to commodity and trade regulations globally.
Tyson Foods, Inc. (TSN)
- Faces stringent food safety and labor regulations with ongoing litigation risks.
5. Supply Chain & Operations
Archer-Daniels-Midland Company (ADM)
- Complex global supply chain vulnerable to agricultural input volatility.
Tyson Foods, Inc. (TSN)
- Operationally intensive with risks from livestock supply and processing disruptions.
6. ESG & Climate Transition
Archer-Daniels-Midland Company (ADM)
- Pressure to reduce carbon footprint in commodity sourcing and processing.
Tyson Foods, Inc. (TSN)
- High ESG scrutiny due to animal welfare and environmental impact concerns.
7. Geopolitical Exposure
Archer-Daniels-Midland Company (ADM)
- Global operations exposed to trade tensions and currency risks.
Tyson Foods, Inc. (TSN)
- Primarily US-focused but vulnerable to export market fluctuations and tariffs.
Which company shows a better risk-adjusted profile?
Tyson Foods faces significant operational and regulatory risks, but its stronger balance sheet and lower stock volatility improve its risk-adjusted profile. ADM’s exposure to commodity price swings and weak financial ratios raise concerns about its resilience. Notably, ADM’s poor interest coverage contrasts sharply with TSN’s manageable leverage. This difference underpins my view that Tyson offers a more balanced risk-return tradeoff in 2026.
Final Verdict: Which stock to choose?
Archer-Daniels-Midland Company’s superpower lies in its consistent cash generation and dividend yield, appealing to income-focused investors. However, its declining profitability and weak returns on equity require vigilance. It fits a portfolio seeking stable income with moderate growth tolerance.
Tyson Foods, Inc. offers a strategic moat through its operational efficiency and asset utilization, supported by a solid balance sheet relative to ADM. Its moderate growth and value attributes suit investors prioritizing steady expansion with lower financial risk.
If you prioritize income stability and dividend income, Archer-Daniels-Midland commands attention despite recent profitability challenges. However, if you seek operational efficiency and a healthier balance sheet with moderate growth potential, Tyson Foods offers better stability and a more favorable financial profile.
Disclaimer: Investment carries a risk of loss of initial capital. The past performance is not a reliable indicator of future results. Be sure to understand risks before making an investment decision.
Go Further
I encourage you to read the complete analyses of Archer-Daniels-Midland Company and Tyson Foods, Inc. to enhance your investment decisions: