Home > Comparison > Consumer Defensive > ADM vs BG
The strategic rivalry between Archer-Daniels-Midland Company and Bunge Global S.A. shapes the competitive landscape of the agricultural farm products sector. ADM operates a diversified agribusiness with an emphasis on processing and ingredient solutions, while Bunge focuses on integrated agribusiness and specialty oils. This analysis compares their operational models and capital allocation strategies to determine which offers a superior risk-adjusted profile for diversified portfolios in 2026.
Table of contents
Companies Overview
Archer-Daniels-Midland and Bunge Global dominate the global agricultural commodities market with deep industry roots.
Archer-Daniels-Midland Company: Agricultural Commodities Powerhouse
Archer-Daniels-Midland Company excels as a global processor and merchandiser of agricultural commodities such as oilseeds, corn, and wheat. Its core revenue stems from processing and trading raw materials across three segments: Ag Services and Oilseeds, Carbohydrate Solutions, and Nutrition. In 2026, ADM emphasizes expanding its specialty food ingredients and structured trade finance activities to capture value beyond basic commodities.
Bunge Global S.A.: Agribusiness and Food Innovator
Bunge Global operates as a diversified agribusiness and food company with a focus on oilseeds, grains, refined oils, milling, and sugar bioenergy. Its revenue flows from purchasing, processing, and selling commodities plus specialty oils and biofuels. The 2026 strategy prioritizes growth in refined oils and bioenergy segments while enhancing product offerings for food manufacturers and biofuel producers worldwide.
Strategic Collision: Similarities & Divergences
Both companies compete fiercely in commodity procurement and processing but diverge in product breadth and innovation approaches. ADM invests heavily in specialty ingredients and finance services, while Bunge pushes refined oils and bioenergy expansion. The primary battleground is evolving customer demand for value-added products versus bulk commodities. Their distinct profiles reflect ADM’s integrated supply chain advantage against Bunge’s focus on diversified agribusiness innovation.
Income Statement Comparison
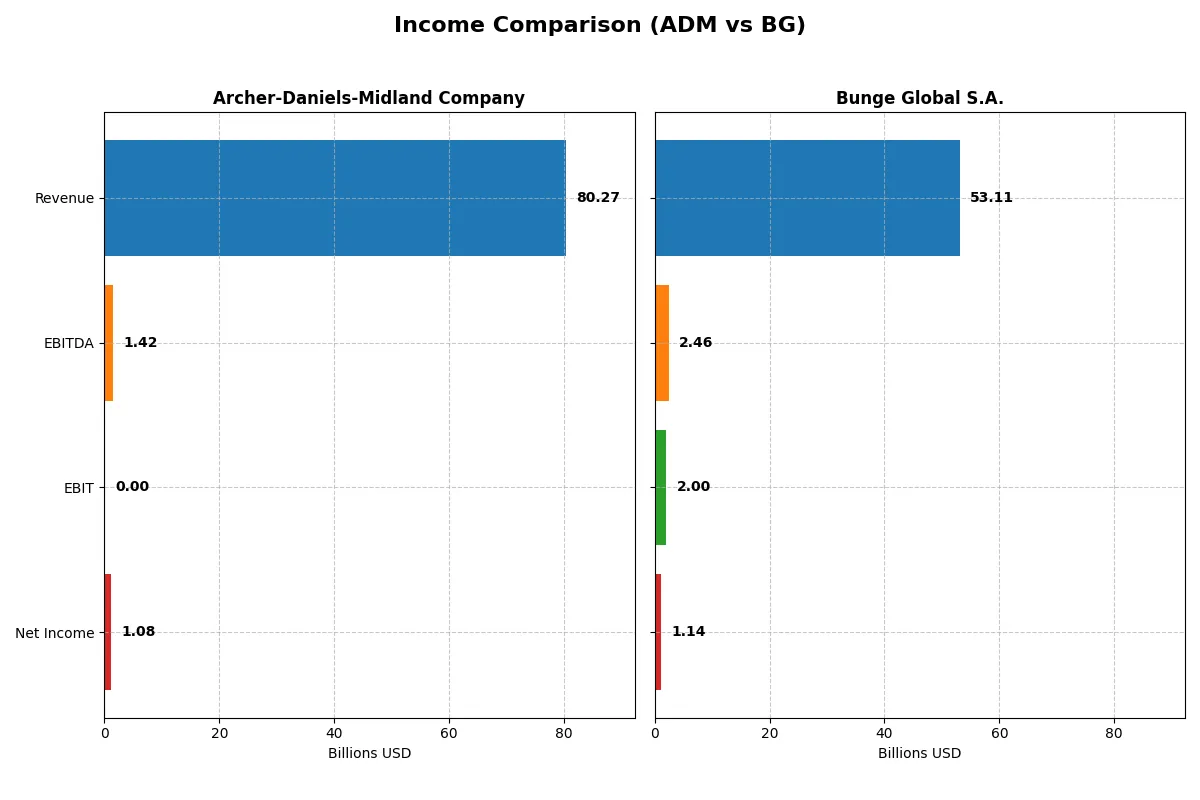
This data dissects the core profitability and scalability of both corporate engines to reveal who dominates the bottom line:
| Metric | Archer-Daniels-Midland Company (ADM) | Bunge Global S.A. (BG) |
|---|---|---|
| Revenue | 80.3B | 53.1B |
| Cost of Revenue | 75.2B | 49.7B |
| Operating Expenses | 3.61B | 1.78B |
| Gross Profit | 5.03B | 3.39B |
| EBITDA | 1.42B | 2.46B |
| EBIT | 1.42B (Operating Income) | 2.00B |
| Interest Expense | 118M | 471M |
| Net Income | 1.08B | 1.14B |
| EPS | 2.23 | 8.09 |
| Fiscal Year | 2025 | 2024 |
Income Statement Analysis: The Bottom-Line Duel
This income statement comparison reveals which company runs a more efficient and profitable corporate engine amid recent market pressures.
Archer-Daniels-Midland Company Analysis
ADM’s revenue slid from 94B in 2023 to 80B in 2025, with net income plunging from 3.5B to 1.1B. Gross margin weakened to 6.3%, while net margin held a modest 1.3%. The 2025 drop in EBITDA to 1.4B signals deteriorating operational efficiency and margin compression, reflecting a challenging period.
Bunge Global S.A. Analysis
BG’s revenue declined from 67B in 2022 to 53B in 2024, with net income shrinking from 1.6B to 1.1B. Gross margin hovered near 6.4%, and net margin improved slightly to 2.1%. Despite a 43% net margin contraction last year, BG maintains stronger EBIT margins (3.8%) and steadier EPS growth over five years, suggesting more resilience.
Margin Pressure vs. Revenue Decline
ADM suffers a sharper revenue and net income decline, with margins collapsing in 2025, undermining profitability. BG also faced margin and income contraction but holds higher net and EBIT margins and better long-term EPS growth. BG’s profile appeals more to investors seeking margin stability amid sector volatility.
Financial Ratios Comparison
These vital ratios act as a diagnostic tool to expose the underlying fiscal health, valuation premiums, and capital efficiency of the companies compared below:
| Ratios | Archer-Daniels-Midland Company (ADM) | Bunge Global S.A. (BG) |
|---|---|---|
| ROE | 8.12% (2024) | 11.47% (2024) |
| ROIC | 4.51% (2024) | 6.53% (2024) |
| P/E | 13.42 (2024) | 9.55 (2024) |
| P/B | 1.09 (2024) | 1.10 (2024) |
| Current Ratio | 1.39 (2024) | 2.15 (2024) |
| Quick Ratio | 0.81 (2024) | 1.27 (2024) |
| D/E | 0.52 (2024) | 0.72 (2024) |
| Debt-to-Assets | 21.66% (2024) | 28.59% (2024) |
| Interest Coverage | 2.93 (2024) | 3.43 (2024) |
| Asset Turnover | 1.61 (2024) | 2.13 (2024) |
| Fixed Asset Turnover | 7.01 (2024) | 8.59 (2024) |
| Payout ratio | 54.72% (2024) | 33.25% (2024) |
| Dividend yield | 4.08% (2024) | 3.48% (2024) |
| Fiscal Year | 2024 | 2024 |
Efficiency & Valuation Duel: The Vital Signs
Financial ratios act as a company’s DNA, revealing hidden risks and operational excellence that shape investment decisions.
Archer-Daniels-Midland Company
ADM shows weak profitability with a 0% ROE and a low net margin of 1.34%, signaling operational challenges. Its P/E at 25.81 appears stretched compared to sector norms. The firm rewards shareholders with a 3.55% dividend yield, reflecting a focus on steady income despite limited reinvestment in growth.
Bunge Global S.A.
Bunge demonstrates better core profitability, with an 11.47% ROE and a 2.14% net margin. Its valuation is attractive, trading at a P/E of 9.55 and a solid P/B of 1.1, indicating efficiency. The company balances dividends at 3.48% with healthy liquidity and operational metrics, supporting sustainable shareholder returns.
Valuation Discipline Meets Profitability Strength
Bunge offers a more favorable ratio profile with stronger profitability and reasonable valuation. ADM’s stretched valuation and weak returns suggest higher risk. Investors seeking operational safety and value might prefer Bunge’s balanced financial health, while ADM suits those prioritizing consistent dividend income.
Which one offers the Superior Shareholder Reward?
I see Archer-Daniels-Midland Company (ADM) yields 4.08% with a payout ratio near 55%, balancing dividends and reinvestment. ADM’s buyback program remains modest but consistent, supporting shareholder value sustainably. Bunge Global (BG) pays a 3.48% yield but carries a higher payout ratio around 33%, with weaker free cash flow coverage and less intense buybacks. ADM’s distribution strategy is more sustainable, combining solid dividends, moderate payout, and disciplined capital allocation. I conclude ADM offers superior total shareholder rewards in 2026, backed by balanced yield, payout, and buyback execution.
Comparative Score Analysis: The Strategic Profile
The radar chart reveals the fundamental DNA and trade-offs of Archer-Daniels-Midland Company and Bunge Global S.A.:
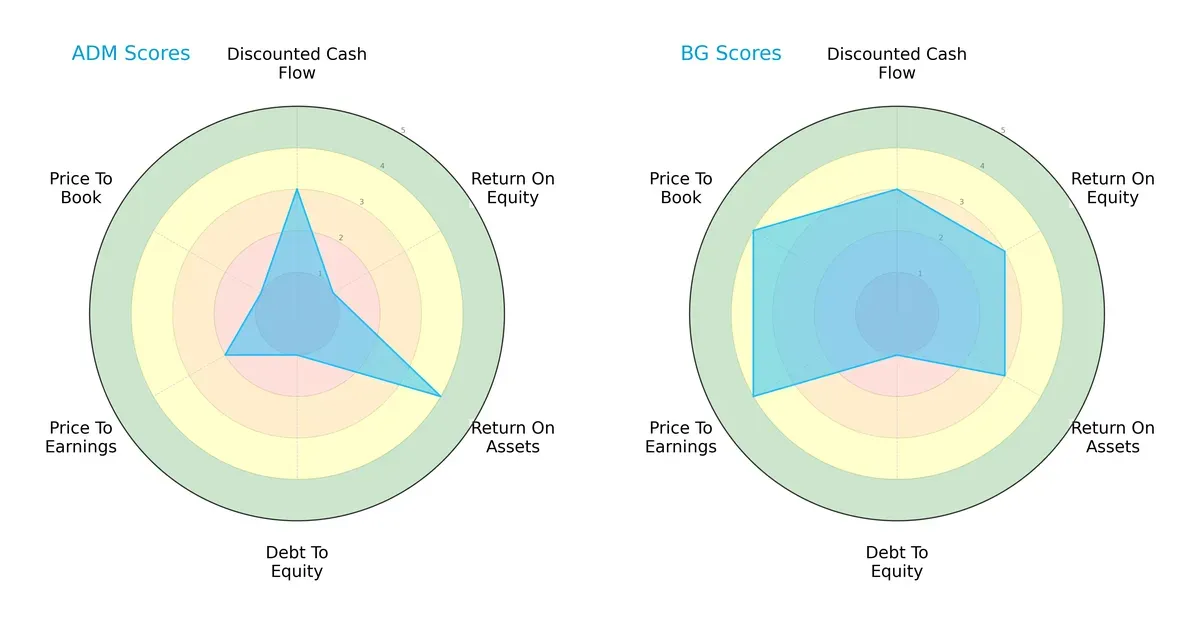
Archer-Daniels-Midland (ADM) excels in asset efficiency (ROA score 4) but suffers from weak equity returns (ROE score 1) and a problematic balance sheet (Debt/Equity score 1). Bunge Global (BG) shows a more balanced profile with moderate scores across ROE, ROA, and DCF, plus superior valuation metrics (P/E 4, P/B 4). BG clearly leverages valuation advantages, while ADM relies heavily on asset utilization but faces financial leverage risks.
—
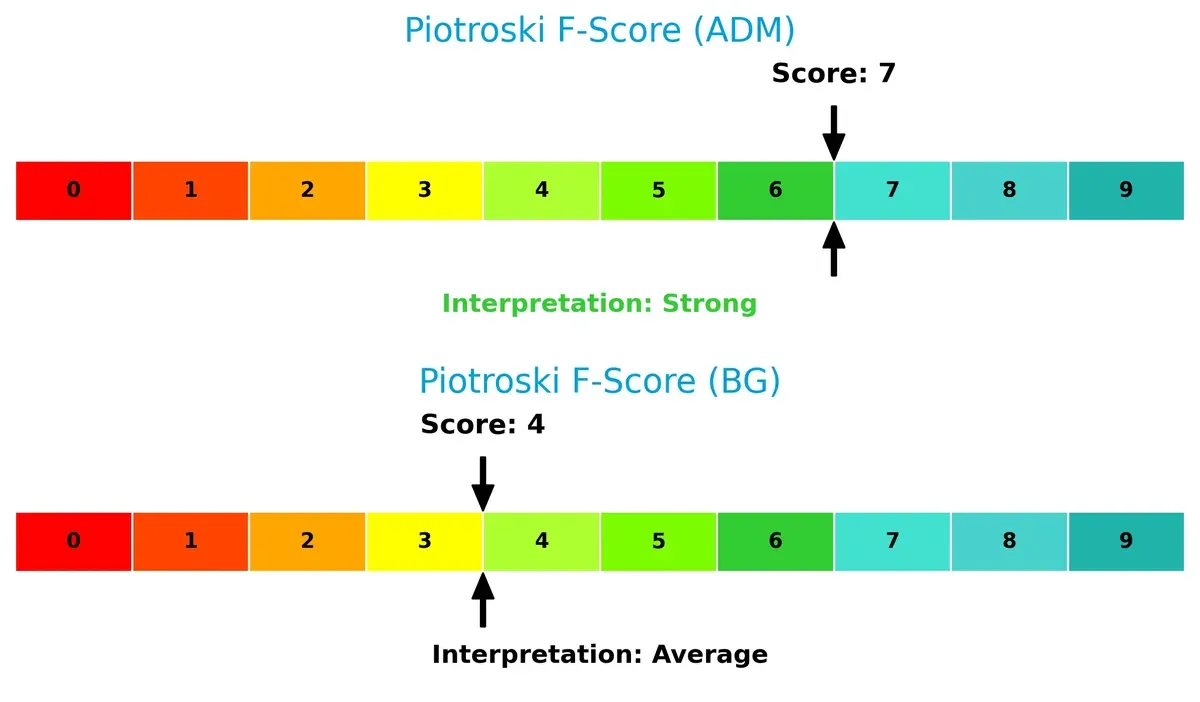
Financial Health: Quality of Operations
ADM’s Piotroski F-Score of 7 signals strong financial health, reflecting solid operational quality and prudent management. BG’s score of 4 indicates average financial strength, suggesting some internal metric weaknesses compared to ADM:
How are the two companies positioned?
This section dissects ADM and BG’s operational DNA by comparing their revenue distribution and internal strengths and weaknesses. The goal is to confront their economic moats and identify which model offers the most resilient, sustainable competitive advantage today.
Revenue Segmentation: The Strategic Mix
The following comparison dissects how Archer-Daniels-Midland Company and Bunge Global diversify their income streams and reveals their primary sector bets:
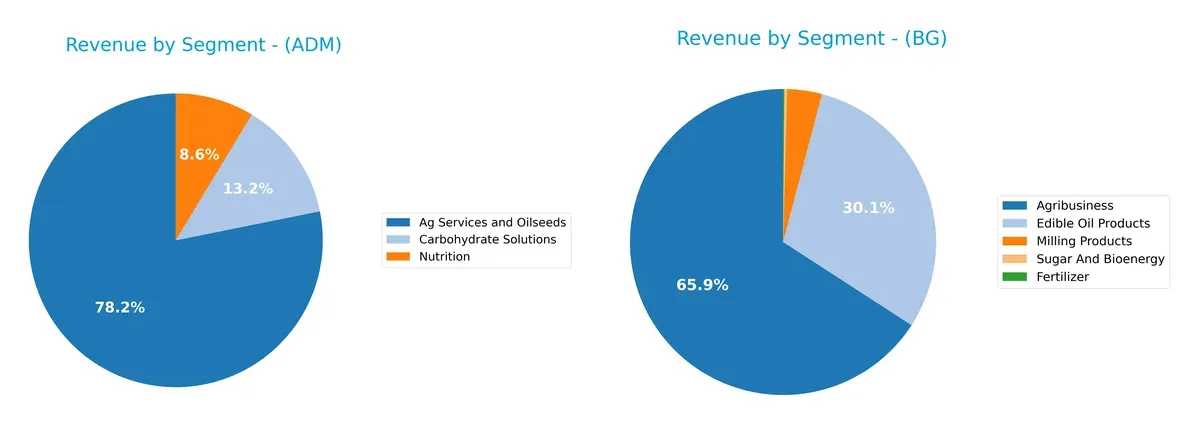
Archer-Daniels-Midland anchors its revenue with $66.5B from Ag Services and Oilseeds, complemented by $11.2B in Carbohydrate Solutions and $7.3B in Nutrition. Bunge Global shows a more diversified mix, with $27.9B from Agribusiness, $12.8B in Edible Oil Products, plus smaller contributions from Milling and Sugar segments. ADM’s concentration in ag services signals infrastructure dominance, while Bunge’s spread reduces concentration risk and leverages multiple agrifood ecosystems.
Strengths and Weaknesses Comparison
This table compares the strengths and weaknesses of Archer-Daniels-Midland Company (ADM) and Bunge Global S.A. (BG):
ADM Strengths
- Diversified revenue from Ag Services, Oilseeds, Carbohydrate Solutions, and Nutrition
- Strong U.S. market presence with $33.5B revenue in 2024
- Favorable debt-to-equity and debt-to-assets ratios
- Dividend yield at 3.55% supports income investors
BG Strengths
- Diversified segments including Agribusiness, Edible Oils, Fertilizer, Milling, and Bioenergy
- Global presence spanning Europe, Asia Pacific, Americas
- Favorable profitability ratios including PE 9.55 and WACC 6.71%
- Strong liquidity with current ratio 2.15 and quick ratio 1.27
- Solid asset turnover metrics indicating operational efficiency
ADM Weaknesses
- Overall unfavorable profitability ratios: net margin 1.34%, ROE and ROIC near zero
- Weak liquidity with current and quick ratios at zero
- Negative interest coverage ratio indicates financial stress
- Unfavorable asset turnover ratios suggest operational inefficiencies
- PE ratio high at 25.81 signals expensive valuation
BG Weaknesses
- Net margin unfavorable at 2.14% despite other strengths
- Moderate debt-to-equity at 0.72 and neutral interest coverage signal cautious leverage use
- ROE and ROIC neutral, indicating average capital returns
ADM shows a broad product base and strong U.S. sales but struggles with profitability and liquidity. BG combines stronger financial health and operational efficiency with global diversification, though its profitability margins remain modest. These differences highlight contrasting strategic and financial profiles.
The Moat Duel: Analyzing Competitive Defensibility
A structural moat is the only thing protecting long-term profits from relentless competitive erosion in commoditized industries like agribusiness:
Archer-Daniels-Midland Company (ADM): Commodity Scale and Global Footprint
ADM’s primary moat lies in its vast global procurement and logistics network, enabling scale advantages. This manifests in stable gross margins around 6.3%, but declining ROIC signals weakening capital efficiency. New nutrition and specialty ingredient innovations in 2026 could deepen its moat if successfully commercialized.
Bunge Global S.A. (BG): Integrated Processing and Market Diversification
Bunge’s moat stems from its integrated processing capabilities and geographic diversification, especially in oils and bioenergy, contrasting ADM’s heavier commodity focus. Despite a modest 3.8% EBIT margin and a shrinking ROIC, Bunge’s expansion into specialty oils and emerging markets offers potential to arrest profitability decline.
Verdict: Scale Network vs. Integrated Diversification
Both firms face declining ROIC trends, but ADM’s unmatched scale creates a wider moat. However, Bunge’s integrated model provides a deeper moat in specialty segments. ADM is better positioned to defend broad market share, but Bunge shows promise in niche growth areas.
Which stock offers better returns?
Over the past 12 months, Archer-Daniels-Midland Company and Bunge Global S.A. both show strong upward price movements with accelerating bullish trends and notable trading volume dynamics.
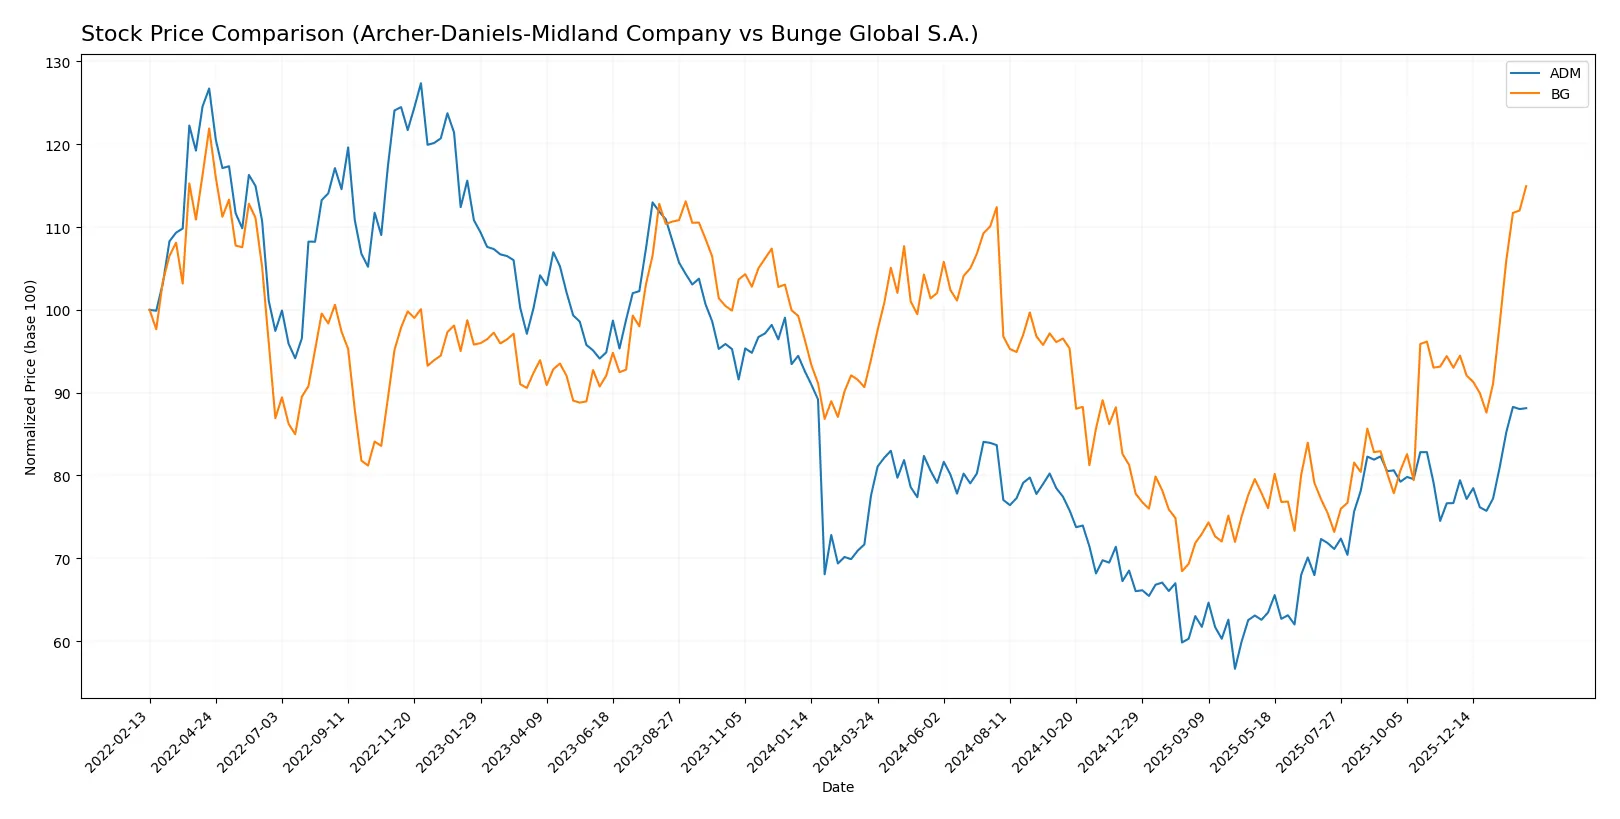
Trend Comparison
Archer-Daniels-Midland Company’s stock rose 13.62% over the past year, showing acceleration and moderate volatility with prices ranging from 43.32 to 67.51.
Bunge Global S.A. outperformed with a 22.31% gain, also accelerating, but with higher volatility and a wider price range between 69.6 and 116.88.
Bunge Global’s stock delivered the highest market performance, outperforming ADM by nearly 9 percentage points in price appreciation.
Target Prices
Analysts present a mixed but clear consensus on target prices for Archer-Daniels-Midland and Bunge Global.
| Company | Target Low | Target High | Consensus |
|---|---|---|---|
| Archer-Daniels-Midland Company | 50 | 59 | 54.5 |
| Bunge Global S.A. | 95 | 117 | 108.4 |
The target consensus for Archer-Daniels-Midland sits well below its current 67.39 price, signaling potential downside risk. Conversely, Bunge’s consensus target slightly exceeds its 116.88 price, suggesting modest upside potential.

Don’t Let Luck Decide Your Entry Point
Optimize your entry points with our advanced ProRealTime indicators. You’ll get efficient buy signals with precise price targets for maximum performance. Start outperforming now!
How do institutions grade them?
Archer-Daniels-Midland Company Grades
The following table summarizes recent grades from major financial institutions for Archer-Daniels-Midland Company:
| Grading Company | Action | New Grade | Date |
|---|---|---|---|
| JP Morgan | Maintain | Underweight | 2026-01-21 |
| Morgan Stanley | Downgrade | Underweight | 2025-12-16 |
| JP Morgan | Downgrade | Underweight | 2025-11-05 |
| Morgan Stanley | Maintain | Equal Weight | 2025-08-12 |
| UBS | Maintain | Buy | 2025-08-11 |
| Barclays | Upgrade | Equal Weight | 2025-08-06 |
| Barclays | Maintain | Underweight | 2025-07-02 |
| UBS | Upgrade | Buy | 2025-05-19 |
| B of A Securities | Downgrade | Underperform | 2025-05-08 |
| Citigroup | Maintain | Neutral | 2025-04-15 |
Bunge Global S.A. Grades
Below are recent grades from notable institutions for Bunge Global S.A.:
| Grading Company | Action | New Grade | Date |
|---|---|---|---|
| JP Morgan | Maintain | Overweight | 2026-01-21 |
| Morgan Stanley | Upgrade | Overweight | 2025-12-16 |
| B of A Securities | Maintain | Buy | 2025-12-02 |
| Barclays | Upgrade | Overweight | 2025-11-06 |
| Barclays | Maintain | Equal Weight | 2025-10-21 |
| Stephens & Co. | Maintain | Overweight | 2025-10-17 |
| BMO Capital | Maintain | Outperform | 2025-10-16 |
| JP Morgan | Maintain | Overweight | 2025-10-16 |
| Morgan Stanley | Maintain | Equal Weight | 2025-08-12 |
| Stephens & Co. | Maintain | Overweight | 2025-05-08 |
Which company has the best grades?
Bunge Global S.A. consistently receives higher grades, mostly Overweight and Buy, compared to Archer-Daniels-Midland’s predominantly Underweight and Equal Weight ratings. This suggests stronger institutional confidence in Bunge’s outlook. Investors may interpret Bunge’s grades as a signal of better near-term performance potential and risk-adjusted returns relative to Archer-Daniels-Midland.
Risks specific to each company
The following categories identify the critical pressure points and systemic threats facing both firms in the 2026 market environment:
1. Market & Competition
Archer-Daniels-Midland Company (ADM)
- Faces intense global agricultural commodity competition, with margin pressure and low profitability.
Bunge Global S.A. (BG)
- Operates in a competitive agribusiness market but shows better margin and efficiency metrics.
2. Capital Structure & Debt
Archer-Daniels-Midland Company (ADM)
- Low debt-to-equity ratio signals conservative leverage but weak interest coverage raises concerns.
Bunge Global S.A. (BG)
- Moderate leverage with manageable debt levels and stronger interest coverage.
3. Stock Volatility
Archer-Daniels-Midland Company (ADM)
- Beta of 0.68 indicates lower volatility than the market, providing relative stability.
Bunge Global S.A. (BG)
- Slightly higher beta at 0.75, showing moderate market sensitivity.
4. Regulatory & Legal
Archer-Daniels-Midland Company (ADM)
- Exposure to complex global trade regulations and commodity market oversight.
Bunge Global S.A. (BG)
- Similar regulatory exposure with additional scrutiny in bioenergy and sugar sectors.
5. Supply Chain & Operations
Archer-Daniels-Midland Company (ADM)
- Extensive global operations present supply chain risks but diversified sourcing mitigates impact.
Bunge Global S.A. (BG)
- Also globally diversified but operational scale smaller, which may limit flexibility.
6. ESG & Climate Transition
Archer-Daniels-Midland Company (ADM)
- Faces pressure to reduce carbon footprint in commodity production and processing.
Bunge Global S.A. (BG)
- Increased focus on sustainable bioenergy and cleaner sugar production offers ESG opportunities.
7. Geopolitical Exposure
Archer-Daniels-Midland Company (ADM)
- Global footprint exposes ADM to trade tensions and export restrictions.
Bunge Global S.A. (BG)
- Similar geopolitical risks but with greater reliance on South American markets.
Which company shows a better risk-adjusted profile?
Bunge Global’s moderate leverage and stronger profitability metrics present a more balanced risk-adjusted profile. ADM’s weakest link is its poor profitability and interest coverage, raising financial stability concerns. BG’s most impactful risk lies in geopolitical exposure, especially in volatile South American regions. ADM’s financial fragility is underscored by its unfavorable return metrics and interest coverage, signaling caution. Overall, BG’s stronger operational efficiency and financial ratios justify a more confident risk stance in 2026.
Final Verdict: Which stock to choose?
Archer-Daniels-Midland (ADM) stands out for its robust cash generation and dividend yield, signaling a reliable income source. However, its declining profitability and weak capital efficiency remain points of vigilance. ADM might suit portfolios seeking steady income but willing to accept growth challenges.
Bunge Global (BG) leverages a strategic moat in operational efficiency and solid asset turnover, delivering better stability amid market volatility. Its healthier balance sheet and attractive valuation metrics position it as a more balanced choice. BG could fit well in a Growth at a Reasonable Price (GARP) strategy.
If you prioritize income generation with some risk tolerance, ADM’s cash machine profile is compelling despite its operational headwinds. However, if you seek better financial stability and operational efficiency backing growth, BG outshines as the more prudent scenario. Both carry risks, but BG offers a safer harbor amid sector uncertainties.
Disclaimer: Investment carries a risk of loss of initial capital. The past performance is not a reliable indicator of future results. Be sure to understand risks before making an investment decision.
Go Further
I encourage you to read the complete analyses of Archer-Daniels-Midland Company and Bunge Global S.A. to enhance your investment decisions: