Home > Comparison > Financial Services > HIG vs ACGL
The competitive dynamic between The Hartford Financial Services Group, Inc. and Arch Capital Group Ltd. shapes the diversified insurance landscape. Hartford, a broad-based insurer with extensive U.S. and international operations, contrasts with Arch, a specialized reinsurer with a global footprint. This analysis probes their differing capital allocations and risk exposures to identify which strategy promises superior risk-adjusted returns. Investors seek clarity on the optimal choice for balanced portfolio growth in the evolving financial services sector.
Table of contents
Companies Overview
The Hartford Financial Services and Arch Capital Group command significant roles in the global diversified insurance market.
The Hartford Financial Services Group, Inc.: Comprehensive U.S.-Focused Insurer
The Hartford dominates the U.S. diversified insurance sector with a broad portfolio spanning commercial lines, personal insurance, and group benefits. Its core revenue engine hinges on underwriting workers’ compensation, property, automobile, and liability coverages. In 2026, it prioritizes expanding direct-to-consumer channels and refining risk management services for sustained growth.
Arch Capital Group Ltd.: Global Specialty Insurance and Reinsurance Leader
Arch Capital operates worldwide, delivering a diverse mix of insurance, reinsurance, and mortgage insurance products. Its core revenue derives from casualty, property, and specialty insurance alongside reinsurance solutions marketed via independent brokers. The company’s 2026 strategy emphasizes broadening reinsurance offerings and enhancing risk management in casualty and catastrophe segments.
Strategic Collision: Similarities & Divergences
Both firms excel in diversified insurance, yet Hartford focuses on a direct consumer relationship, while Arch leans on broker networks and reinsurance specialization. Their battleground centers on casualty and commercial insurance markets. Investors face distinct profiles: Hartford’s integrated U.S. footprint contrasts with Arch’s global reinsurance niche and leaner workforce.
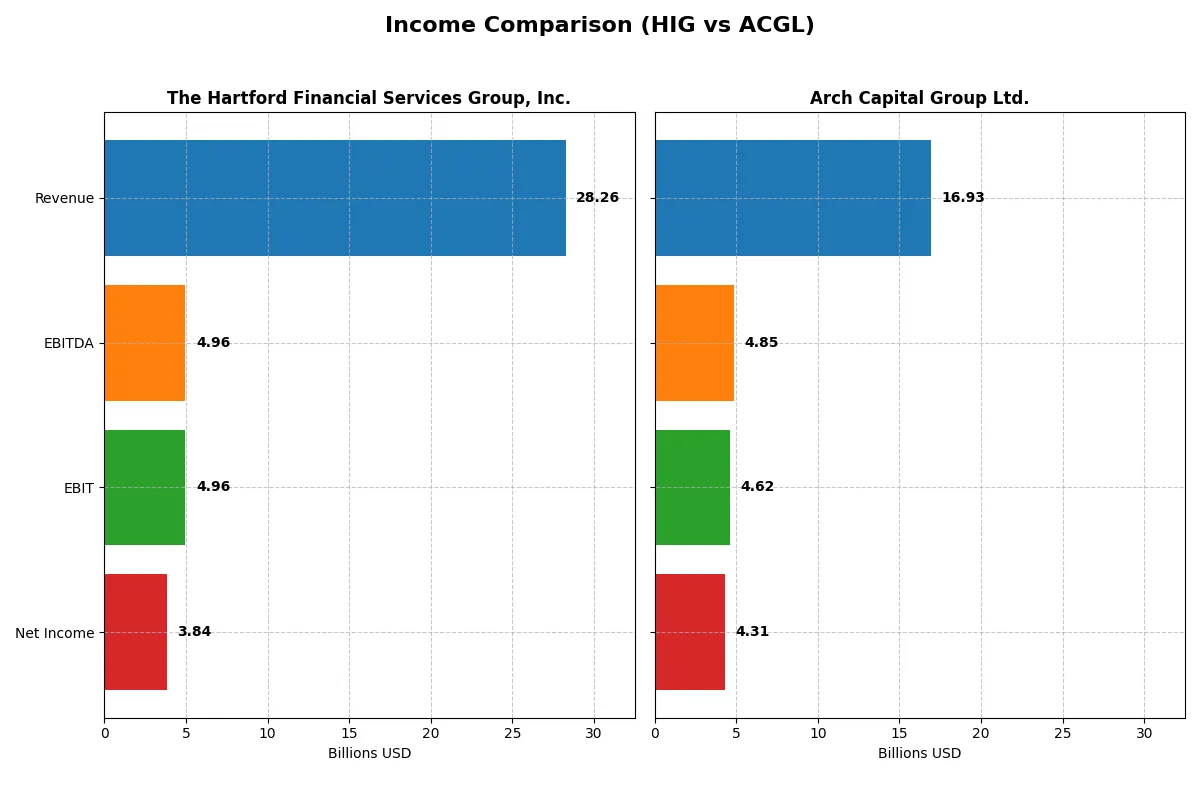
Income Statement Comparison
This data dissects the core profitability and scalability of both corporate engines to reveal who dominates the bottom line:
| Metric | The Hartford Financial Services Group, Inc. (HIG) | Arch Capital Group Ltd. (ACGL) |
|---|---|---|
| Revenue | 28.3B | 16.9B |
| Cost of Revenue | 15.2B | 11.0B |
| Operating Expenses | 8.3B | 1.5B |
| Gross Profit | 13.0B | 5.9B |
| EBITDA | 5.0B | 4.9B |
| EBIT | 5.0B | 4.6B |
| Interest Expense | 199M | 141M |
| Net Income | 3.8B | 4.3B |
| EPS | 13.51 | 11.47 |
| Fiscal Year | 2025 | 2024 |
Income Statement Analysis: The Bottom-Line Duel
This Income Statement comparison reveals which company runs its financial engine more efficiently and delivers stronger profitability.
The Hartford Financial Services Group, Inc. Analysis
The Hartford’s revenue climbed steadily from 21.6B in 2021 to 28.3B in 2025, with net income surging 62% over five years to 3.8B. Its gross margin expanded to a healthy 46%, and net margin reached 13.6%, showing solid profitability. The 2025 results highlight strong momentum with a 7.1% revenue increase and a 15% net margin improvement, despite slight pressure on operating expenses.
Arch Capital Group Ltd. Analysis
Arch Capital’s revenue doubled from 8.3B in 2020 to 16.9B in 2024, with net income growing over 200% to 4.3B. The gross margin at 35% remains robust, while net margin stands notably higher at 25.5%, reflecting efficient cost control. The latest year showed a sharp 27% revenue gain and 31% EBIT growth, although net margin and EPS dipped slightly, signaling some short-term earnings pressure.
Margin Strength vs. Growth Scalability
Arch Capital leads with superior net margins and rapid revenue growth, driven by tight expense management. Hartford shows steadier margin expansion and healthy profitability but lags in top-line acceleration. For investors, Arch’s profile suits those prioritizing high margin and fast growth, while Hartford appeals for consistent margin improvement and sustainable earnings momentum.
Financial Ratios Comparison
These vital ratios act as a diagnostic tool to expose the underlying fiscal health, valuation premiums, and capital efficiency of the companies compared:
| Ratios | The Hartford Financial Services Group, Inc. (HIG) | Arch Capital Group Ltd. (ACGL) |
|---|---|---|
| ROE | 20.2% | 20.7% |
| ROIC | 28.2% | N/A |
| P/E | 10.1 | 8.0 |
| P/B | 2.05 | 1.65 |
| Current Ratio | 17.7 | N/A |
| Quick Ratio | 17.7 | N/A |
| D/E | 0.23 | 0.13 |
| Debt-to-Assets | 5.1% | 3.8% |
| Interest Coverage | 23.9 | 31.7 |
| Asset Turnover | 0.33 | 0.24 |
| Fixed Asset Turnover | 30.4 | N/A |
| Payout ratio | 15.9% | 44.2% |
| Dividend yield | 1.57% | 5.54% |
| Fiscal Year | 2025 | 2024 |
Efficiency & Valuation Duel: The Vital Signs
Financial ratios serve as a company’s DNA, uncovering hidden risks and highlighting operational excellence crucial for investors’ decisions.
The Hartford Financial Services Group, Inc.
The Hartford displays strong profitability with a 20.21% ROE and a solid 13.57% net margin, reflecting efficient operations. Its P/E of 10.14 suggests the stock is reasonably valued, not stretched. Shareholders receive a modest 1.57% dividend yield, balancing income with reinvestment in stable growth.
Arch Capital Group Ltd.
Arch Capital posts a slightly higher ROE at 20.71% and an impressive 25.47% net margin, signaling robust profitability. Its lower P/E of 7.98 indicates the stock trades at a discount, showing value appeal. The 5.54% dividend yield offers attractive income, supporting shareholder returns alongside capital discipline.
Balanced Profitability with Divergent Risk Profiles
The Hartford offers a solid operational base with moderate valuation and stable dividends, while Arch Capital emphasizes higher profitability and income but with more mixed ratio signals. Investors seeking steady efficiency may prefer Hartford’s profile; those favoring income with potential discount valuation might lean toward Arch Capital.
Which one offers the Superior Shareholder Reward?
I see The Hartford Financial Services Group, Inc. (HIG) offers a steady 1.57% dividend yield with a conservative 16% payout ratio, sustainable through solid free cash flow. Its buybacks appear moderate but consistent. Arch Capital Group Ltd. (ACGL) delivers a much higher 5.54% yield with a 44% payout ratio, heavily supported by strong cash flow and an aggressive buyback program. Historically, ACGL’s distribution intensity signals a more rewarding total return, but with higher payout risk. I favor ACGL for superior shareholder reward in 2026, given its blend of yield and buyback vigor, though investors must monitor payout sustainability closely.
Comparative Score Analysis: The Strategic Profile
The radar chart reveals the fundamental DNA and trade-offs of The Hartford Financial Services Group and Arch Capital Group Ltd:
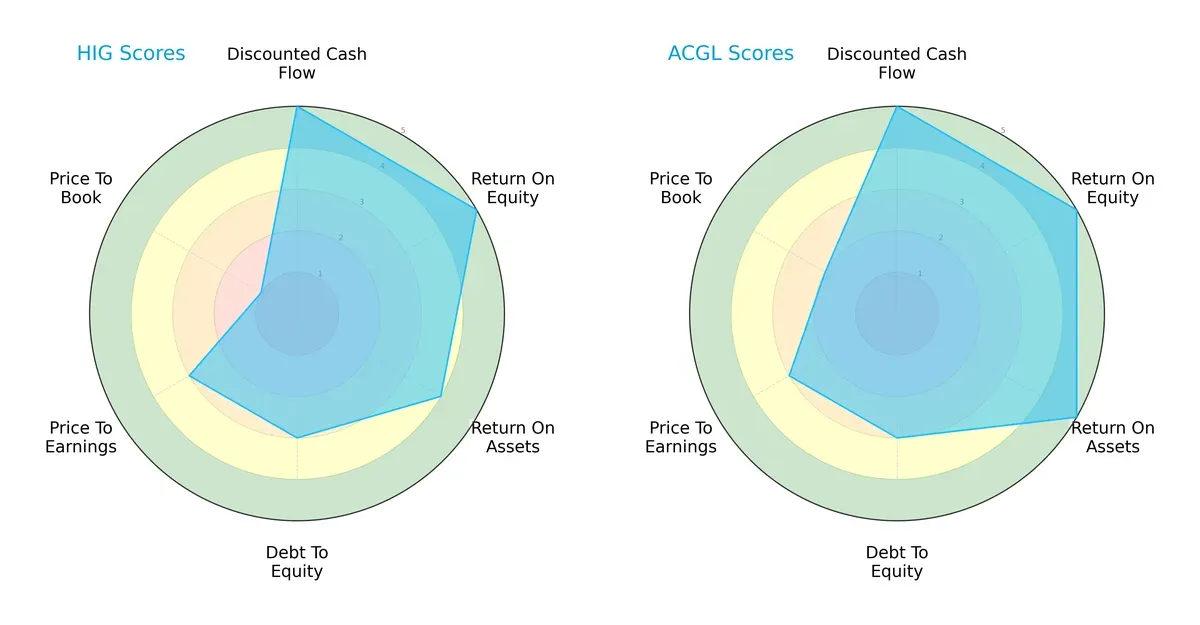
Both firms share strong DCF and ROE scores, signaling robust cash flow and equity returns. Arch Capital edges ahead in ROA with a perfect 5, showing superior asset efficiency. Both maintain moderate debt levels (Debt/Equity score 3) and similar P/E valuations (score 3). However, Hartford lags in Price-to-Book with a very unfavorable 1, suggesting potential undervaluation or balance sheet concerns. Arch Capital presents a more balanced profile, while Hartford leans on equity returns but shows valuation red flags.
Bankruptcy Risk: Solvency Showdown
The Altman Z-Score differential underscores a concerning solvency gap:
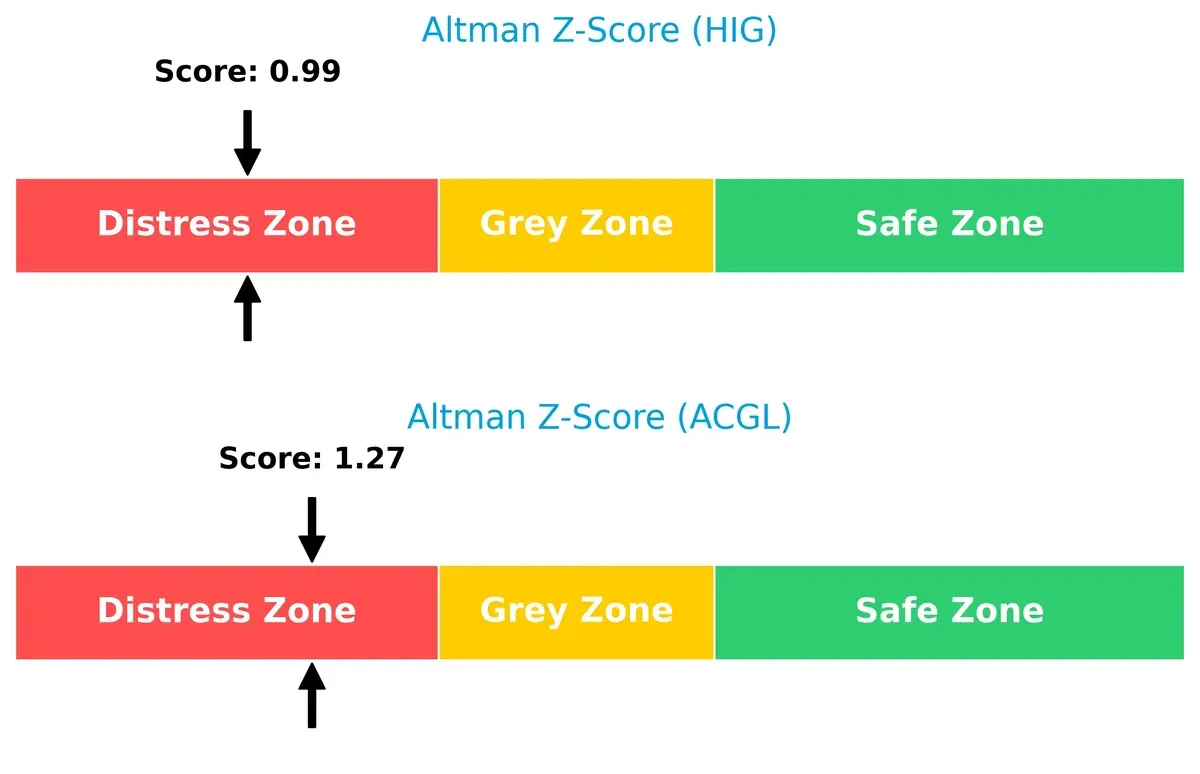
Both companies sit in the distress zone, with Hartford at 0.99 and Arch Capital slightly higher at 1.27. These low scores highlight elevated bankruptcy risks amid current market pressures. Arch Capital’s marginally better score offers limited comfort, signaling that neither firm is firmly in the safe zone for long-term survival.
Financial Health: Quality of Operations
Piotroski F-Scores reveal operational quality and financial robustness:
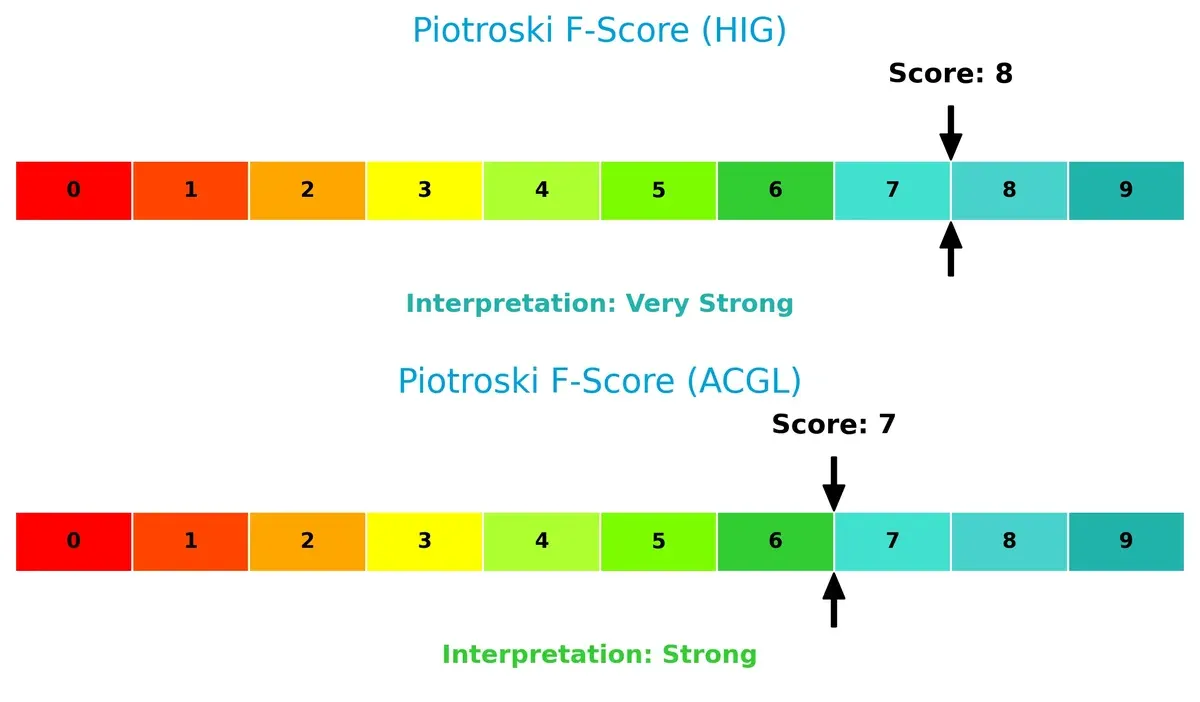
Hartford scores an impressive 8, indicating very strong financial health and operational efficiency. Arch Capital follows close with a strong 7, but this slight gap suggests Hartford currently manages internal metrics better. Neither firm shows red flags, but Hartford’s edge points to a stronger foundation amidst financial challenges.
How are the two companies positioned?
This section dissects the operational DNA of HIG and ACGL by comparing their revenue distribution by segment and internal dynamics. The goal is to confront their economic moats to identify which model offers the most resilient, sustainable competitive advantage today.
Revenue Segmentation: The Strategic Mix
This visual comparison dissects how The Hartford Financial Services Group, Inc. and Arch Capital Group Ltd. diversify their income streams and reveals their primary sector bets:
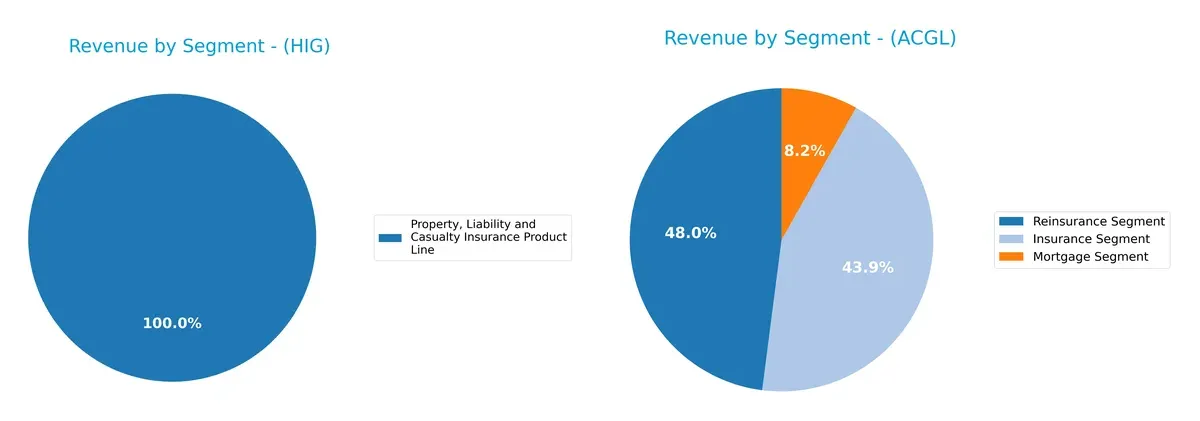
The Hartford leans heavily on its 2013 diversified insurance lines, with Group Life and Accident at $5.2B anchoring its portfolio. In contrast, Arch Capital Group in 2024 shows a more balanced split: $7.2B from Reinsurance, $6.6B Insurance, and $1.2B Mortgage. Hartford’s concentration in life and accident insurance risks sector volatility. Arch’s diversified segments suggest strategic resilience and ecosystem lock-in across insurance and reinsurance markets.
Strengths and Weaknesses Comparison
This table compares the Strengths and Weaknesses of The Hartford Financial Services Group, Inc. (HIG) and Arch Capital Group Ltd. (ACGL):
HIG Strengths
- Favorable profitability metrics with 13.57% net margin and 20.21% ROE
- Strong capital efficiency with 28.21% ROIC well above 6.38% WACC
- Low debt levels with 0.23 debt-to-equity and 5.08% debt-to-assets
- High interest coverage at 24.92 supports financial stability
- Diverse insurance products including commercial, disability, life, and property
- Established US and Japan market presence
ACGL Strengths
- Higher net margin at 25.47% and strong ROE at 20.71%
- Lower WACC at 5.73% supports cost-effective capital use
- Very low leverage with 0.13 debt-to-equity and 3.85% debt-to-assets
- Highest interest coverage of 32.73 ensures robust debt servicing
- Broad segment exposure including insurance, mortgage, and reinsurance
- Growing revenues across three key segments demonstrate diversification
HIG Weaknesses
- Extremely high current and quick ratios at 17.65 may indicate inefficient asset use
- Asset turnover at 0.33 is unfavorable, signaling lower operational efficiency
- Neutral price-to-book at 2.05 suggests moderate valuation support
- Dividend yield low at 1.57%, less attractive for income investors
- Limited recent geographic diversification beyond US and Japan
ACGL Weaknesses
- Zero ROIC signals lack of capital return efficiency
- Unfavorable current and quick ratios at 0 highlight liquidity risks
- Asset and fixed asset turnover are weak or zero, indicating poor asset utilization
- Dividend yield neutral at 5.54%, with no growth visibility
- Lower diversification in geographic footprint based on available data
Both companies show strong profitability and low leverage, but HIG benefits from better capital returns and broader product diversification. ACGL excels in net margin and interest coverage but faces liquidity and capital efficiency challenges. These factors critically shape each firm’s strategic flexibility and risk profile.
The Moat Duel: Analyzing Competitive Defensibility
A durable structural moat is the only shield that protects long-term profits from the relentless erosion of competition:
The Hartford Financial Services Group, Inc.: Intangible Assets-Driven Moat
I identify Hartford’s moat in its trusted brand and risk management expertise, reflected in a robust 21.8% ROIC above WACC. Its rising profitability signals durable value creation. New product lines and geographic expansion in 2026 could deepen this moat further.
Arch Capital Group Ltd.: Cost Advantage Under Pressure
Arch’s moat centers on underwriting efficiency and niche reinsurance, contrasting Hartford’s brand strength. However, its declining ROIC and negative trend reveal weakening capital efficiency. Expansion into mortgage insurance offers growth but risks diluting focus in 2026.
Brand Trust vs. Cost Efficiency in a Shifting Market
Hartford commands a wider and deeper moat, consistently generating excess returns with a growing ROIC. Arch’s deteriorating profitability suggests it struggles to defend market share. Hartford stands better equipped to sustain competitive advantage through 2026.
Which stock offers better returns?
Over the past 12 months, The Hartford Financial Services Group, Inc. and Arch Capital Group Ltd. showed strong price appreciation with distinct acceleration patterns and volume dynamics.
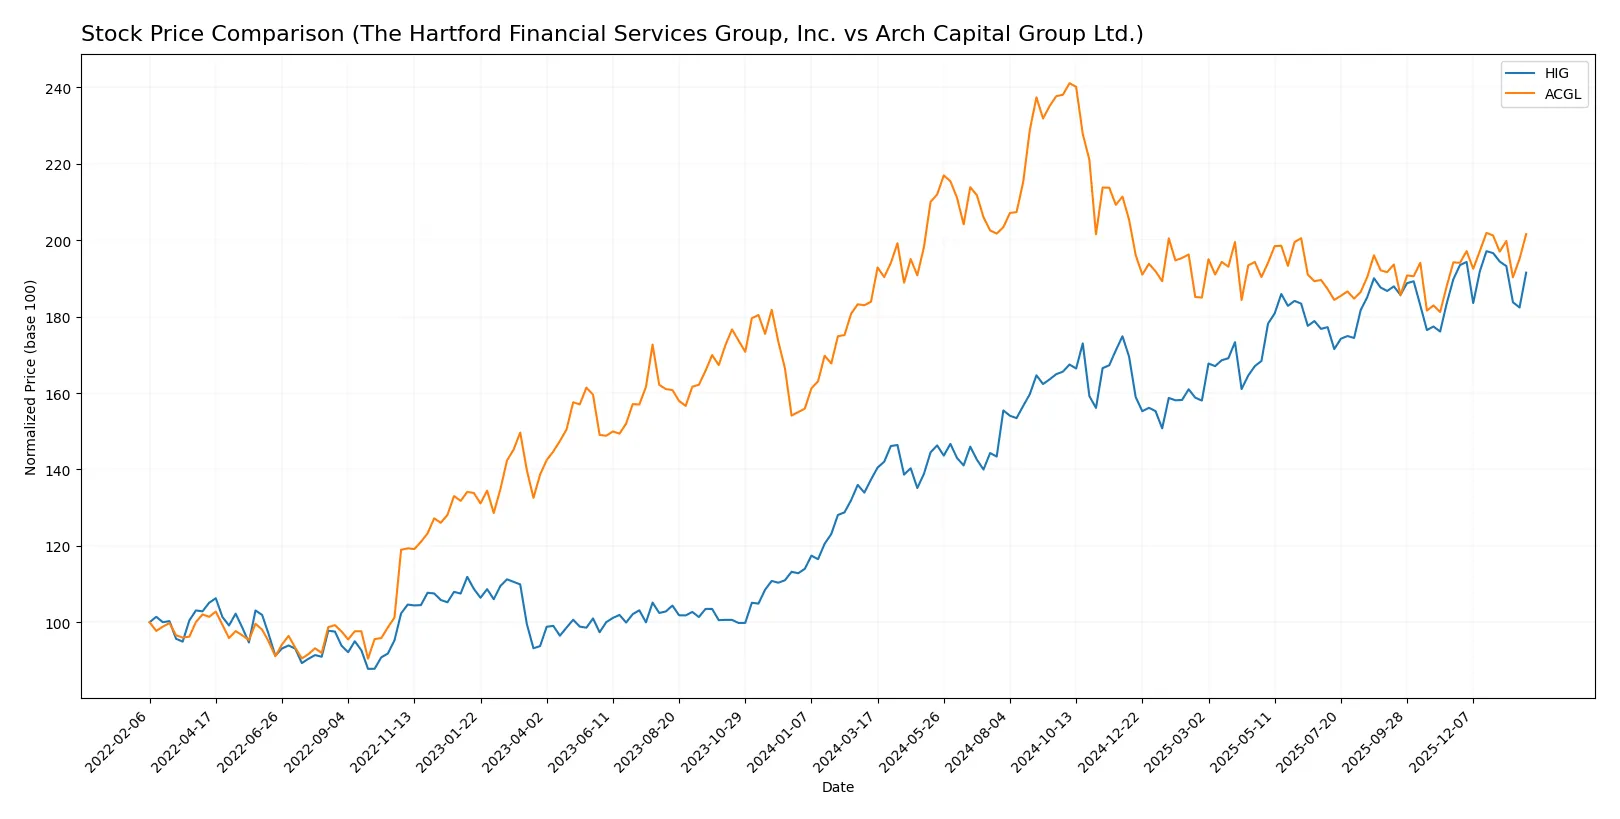
Trend Comparison
The Hartford Financial Services Group, Inc. (HIG) posted a 39.44% price increase over 12 months, indicating a bullish trend with decelerating momentum and a high volatility of 11.88%. Notable highs reached 139.01, lows touched 95.3.
Arch Capital Group Ltd. (ACGL) gained 9.62% in the same period, exhibiting a bullish trend with accelerating momentum and lower volatility at 6.73%. Its price ranged between 86.31 and 114.86.
HIG delivered the strongest market performance with a significantly higher total return than ACGL, despite a recent slowdown in trend acceleration.
Target Prices
Analysts set a constructive target price consensus for these insurers, reflecting moderate upside potential.
| Company | Target Low | Target High | Consensus |
|---|---|---|---|
| The Hartford Financial Services Group, Inc. | 135 | 161 | 152.5 |
| Arch Capital Group Ltd. | 93 | 125 | 104 |
The Hartford’s consensus target of 152.5 suggests roughly 13% upside from its 135 price, signaling confidence in its diversified insurance moat. Arch Capital’s 104 target shows a smaller 8% premium over its 96 price, indicating cautious optimism amid competitive pressures.

Don’t Let Luck Decide Your Entry Point
Optimize your entry points with our advanced ProRealTime indicators. You’ll get efficient buy signals with precise price targets for maximum performance. Start outperforming now!
How do institutions grade them?
Institutional grades for The Hartford Financial Services Group, Inc. and Arch Capital Group Ltd. are as follows:
The Hartford Financial Services Group, Inc. Grades
The table below summarizes recent institutional grades for The Hartford Financial Services Group, Inc.:
| Grading Company | Action | New Grade | Date |
|---|---|---|---|
| Roth Capital | Maintain | Neutral | 2026-01-30 |
| Cantor Fitzgerald | Maintain | Overweight | 2026-01-14 |
| Wells Fargo | Maintain | Overweight | 2026-01-13 |
| JP Morgan | Maintain | Neutral | 2026-01-07 |
| Evercore ISI Group | Maintain | In Line | 2026-01-07 |
| Keefe, Bruyette & Woods | Maintain | Outperform | 2026-01-06 |
| Piper Sandler | Maintain | Overweight | 2025-12-22 |
| UBS | Maintain | Buy | 2025-12-08 |
| Argus Research | Maintain | Buy | 2025-11-25 |
| Morgan Stanley | Maintain | Equal Weight | 2025-11-17 |
Arch Capital Group Ltd. Grades
The table below summarizes recent institutional grades for Arch Capital Group Ltd.:
| Grading Company | Action | New Grade | Date |
|---|---|---|---|
| Cantor Fitzgerald | Maintain | Neutral | 2026-01-14 |
| Goldman Sachs | Maintain | Sell | 2026-01-08 |
| Barclays | Maintain | Equal Weight | 2026-01-08 |
| Evercore ISI Group | Maintain | In Line | 2026-01-07 |
| JP Morgan | Maintain | Neutral | 2026-01-07 |
| Keefe, Bruyette & Woods | Maintain | Market Perform | 2026-01-06 |
| Roth Capital | Maintain | Buy | 2025-12-02 |
| Morgan Stanley | Maintain | Overweight | 2025-11-17 |
| Wells Fargo | Maintain | Overweight | 2025-10-29 |
| JP Morgan | Maintain | Neutral | 2025-10-28 |
Which company has the best grades?
The Hartford Financial Services Group, Inc. has a stronger consensus of positive grades, including multiple “Buy” and “Overweight” ratings. Arch Capital Group Ltd. shows more mixed ratings, including a notable “Sell” from Goldman Sachs. This divergence may influence investor sentiment and portfolio positioning.
Risks specific to each company
The following categories identify the critical pressure points and systemic threats facing both firms in the 2026 market environment:
1. Market & Competition
The Hartford Financial Services Group, Inc. (HIG)
- Faces intense competition in U.S. and international insurance markets with a broad product portfolio.
Arch Capital Group Ltd. (ACGL)
- Competes globally in insurance and reinsurance, with niche strengths but exposure to specialized segments.
2. Capital Structure & Debt
HIG
- Maintains low debt-to-equity at 0.23, supporting a very favorable interest coverage of 24.92.
ACGL
- Holds even lower debt-to-equity at 0.13, and stronger interest coverage at 32.73, indicating sound financial leverage.
3. Stock Volatility
HIG
- Beta of 0.613 suggests moderate volatility, lower than typical industry peers, which favors risk-conscious investors.
ACGL
- Exhibits lower beta of 0.425, indicating reduced stock price volatility and defensive qualities in turbulent markets.
4. Regulatory & Legal
HIG
- Subject to U.S. insurance regulations, with potential exposure in asbestos/environmental claims segment.
ACGL
- Faces complex regulatory regimes globally, including Bermuda’s framework, which may pose jurisdictional compliance challenges.
5. Supply Chain & Operations
HIG
- Operates extensive distribution via agents and brokers, enhancing market reach but increasing operational complexity.
ACGL
- Relies on broker networks worldwide, with operational risk linked to reinsurance and mortgage insurance market cycles.
6. ESG & Climate Transition
HIG
- Increasing focus on underwriting environmental liabilities and climate-related risk management.
ACGL
- Faces challenges in integrating ESG in diverse insurance lines, particularly in catastrophe and political risk coverage.
7. Geopolitical Exposure
HIG
- Primarily U.S.-centric but with international exposure that could be affected by global trade tensions.
ACGL
- Bermuda base and global operations increase exposure to geopolitical risks including regulatory shifts and capital flow restrictions.
Which company shows a better risk-adjusted profile?
The Hartford’s most impactful risk lies in its high current ratio and operational complexity amid regulatory pressures, signaling liquidity management concerns. Arch Capital faces significant challenges in ESG integration and geopolitical exposure due to its global footprint. Despite these risks, ACGL’s lower leverage and lower stock volatility suggest a more balanced risk-adjusted profile. Notably, Hartford’s Altman Z-score in the distress zone (0.99) contrasts with Arch’s slightly better position (1.27), underscoring Hartford’s elevated bankruptcy risk despite strong profitability metrics. I view Arch Capital as having a more resilient risk profile in 2026.
Final Verdict: Which stock to choose?
The Hartford Financial Services Group (HIG) demonstrates unmatched capital efficiency, consistently generating returns well above its cost of capital. Its strong moat is underpinned by a durable competitive advantage and disciplined capital allocation. A point of vigilance remains its extraordinarily high current ratio, which may signal working capital inefficiencies. HIG suits portfolios focused on aggressive growth with a value tilt.
Arch Capital Group Ltd. (ACGL) boasts a strategic moat rooted in robust net margins and recurring revenue streams, delivering superior profitability. Its safety profile appears more moderate than HIG, with a concerning downward ROIC trend that signals weakening capital returns. ACGL fits investors pursuing growth at a reasonable price (GARP) who tolerate moderate operational risks.
If you prioritize durable value creation and high return on invested capital, HIG outshines ACGL due to its proven ability to generate and sustain economic profits. However, if you seek accelerated top-line growth with a stronger immediate cash flow yield and can accept potential volatility in capital efficiency, ACGL offers better stability in earnings growth. Each presents an analytical scenario tailored to different risk-reward preferences.
Disclaimer: Investment carries a risk of loss of initial capital. The past performance is not a reliable indicator of future results. Be sure to understand risks before making an investment decision.
Go Further
I encourage you to read the complete analyses of The Hartford Financial Services Group, Inc. and Arch Capital Group Ltd. to enhance your investment decisions: