Home > Comparison > Financial Services > ACGL vs PFG
The competitive dynamic between Arch Capital Group Ltd. and Principal Financial Group, Inc. shapes the insurance industry’s evolution. Arch Capital operates as a diversified insurer and reinsurer with a global footprint, emphasizing risk management and specialty coverages. Principal Financial focuses on retirement and asset management, blending insurance with wealth solutions. This analysis evaluates their strategic contrasts to identify which company offers superior risk-adjusted returns for a diversified portfolio in the evolving financial services sector.

Table of contents
Companies Overview
Arch Capital Group Ltd. and Principal Financial Group, Inc. are pivotal players in the diversified insurance sector.
Arch Capital Group Ltd.: Global Insurance & Reinsurance Specialist
Arch Capital Group Ltd. dominates as a diversified insurance and reinsurance provider worldwide. Its core revenue engine stems from underwriting casualty, property, and mortgage insurance products, plus risk management and reinsurance services. In 2026, Arch focuses strategically on expanding its reinsurance footprint and enhancing its specialty insurance offerings through broker networks.
Principal Financial Group, Inc.: Retirement & Asset Management Leader
Principal Financial Group, Inc. defines itself as a comprehensive retirement and asset management firm. It generates revenue primarily via retirement solutions, global asset management, and specialty insurance products. The company’s 2026 strategy prioritizes broadening its retirement plan services and international market reach while innovating insurance solutions for individuals and businesses.
Strategic Collision: Similarities & Divergences
Both companies operate in the diversified insurance sector but differ in focus: Arch emphasizes reinsurance and specialty casualty lines, while Principal centers on retirement and asset management. Their competitive battleground lies in risk management and insurance product innovation. Arch offers a more specialized insurance portfolio, whereas Principal presents a broader financial services mix, appealing to distinct investor profiles.
Income Statement Comparison
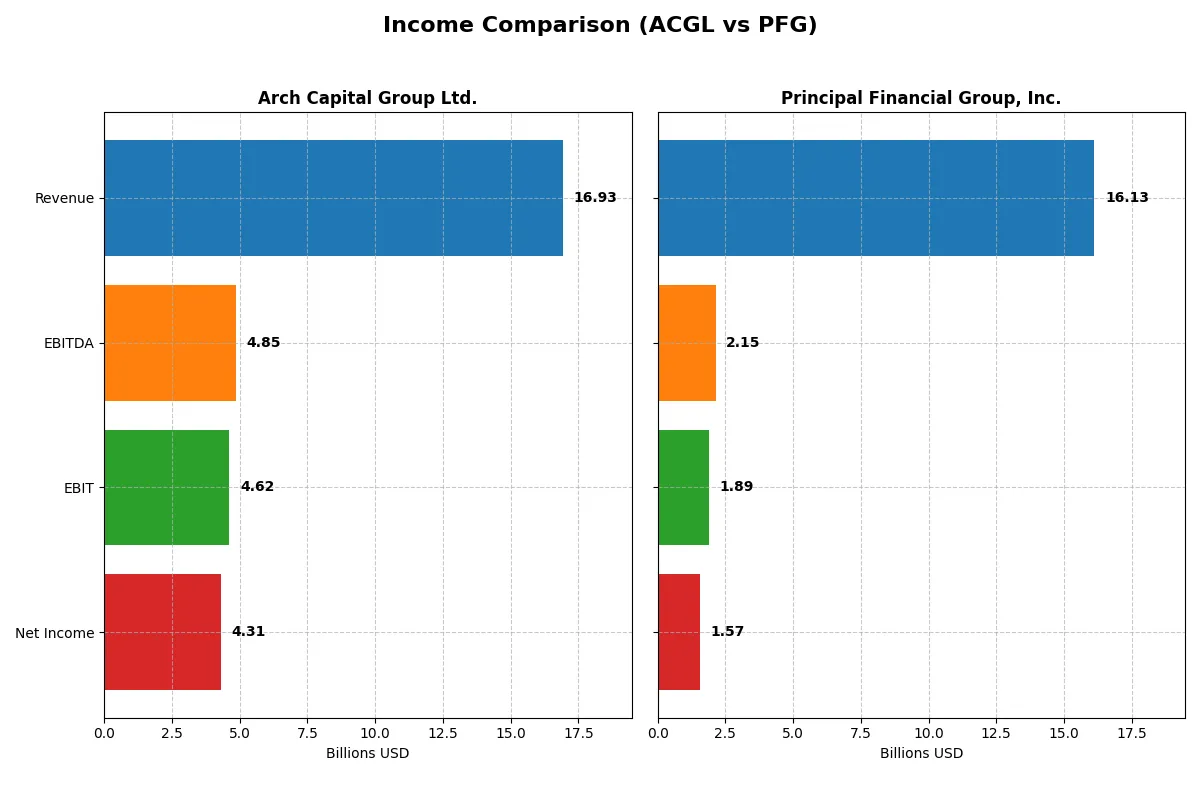
This data dissects the core profitability and scalability of both corporate engines to reveal who dominates the bottom line:
| Metric | Arch Capital Group Ltd. (ACGL) | Principal Financial Group, Inc. (PFG) |
|---|---|---|
| Revenue | 16.93B | 16.13B |
| Cost of Revenue | 10.99B | 8.77B |
| Operating Expenses | 1.46B | 5.46B |
| Gross Profit | 5.94B | 7.35B |
| EBITDA | 4.85B | 2.15B |
| EBIT | 4.62B | 1.89B |
| Interest Expense | 141M | 2.6M |
| Net Income | 4.31B | 1.57B |
| EPS | 11.47 | 6.77 |
| Fiscal Year | 2024 | 2024 |
Income Statement Analysis: The Bottom-Line Duel
This income statement comparison reveals which company delivers stronger efficiency and profitability through their core operations.
Arch Capital Group Ltd. (ACGL) Analysis
ACGL’s revenue doubled from 2020 to 2024, reaching $16.9B in 2024 with net income surging 207% over five years to $4.3B. Its gross margin holds steady at 35%, while net margin remains robust at 25.5%. Despite a slight net margin decline last year, ACGL’s operating efficiency and EBIT margin of 27.3% highlight growing momentum.
Principal Financial Group, Inc. (PFG) Analysis
PFG posted $16.1B revenue in 2024, up 9.4% over five years, with net income rising modestly to $1.57B. Its gross margin impresses at 45.6%, though net margin is lower at 9.7%. Notably, PFG’s EBIT jumped 156% last year, reflecting improved operational control. EPS growth of 162% signals accelerating profitability despite more moderate top-line gains.
Margin Dominance vs. Earnings Momentum
ACGL outpaces PFG in net income scale and margin strength, delivering superior profitability and a wider moat. PFG shows remarkable earnings momentum and gross margin leadership but lags in converting revenue to bottom-line profits. For investors prioritizing sustained profit efficiency, ACGL’s profile offers a more compelling fundamental foundation.
Financial Ratios Comparison
These vital ratios act as a diagnostic tool to expose the underlying fiscal health, valuation premiums, and capital efficiency of the companies compared below:
| Ratios | Arch Capital Group Ltd. (ACGL) | Principal Financial Group, Inc. (PFG) |
|---|---|---|
| ROE | 20.7% | 14.2% |
| ROIC | N/A | 10.5% |
| P/E | 8.0 | 11.1 |
| P/B | 1.65 | 1.58 |
| Current Ratio | 0 | 0 |
| Quick Ratio | 0 | 0 |
| D/E | 0.13 | 0.37 |
| Debt-to-Assets | 3.8% | 1.3% |
| Interest Coverage | 31.7 | 727 |
| Asset Turnover | 0.24 | 0.05 |
| Fixed Asset Turnover | 0 | 20.96 |
| Payout ratio | 44.2% | 41.9% |
| Dividend yield | 5.54% | 3.76% |
| Fiscal Year | 2024 | 2024 |
Efficiency & Valuation Duel: The Vital Signs
Financial ratios serve as a company’s DNA, unveiling hidden risks and spotlighting operational excellence beyond surface numbers.
Arch Capital Group Ltd.
Arch Capital posts a strong 20.7% ROE and a robust 25.5% net margin, demonstrating efficient profitability. Its P/E ratio of 7.98 signals an attractively valued stock, not stretched by the market. Arch Capital offers a 5.54% dividend yield, balancing shareholder returns with measured reinvestment.
Principal Financial Group, Inc.
Principal Financial shows a moderate 14.2% ROE and a 9.7% net margin, reflecting average profitability. The P/E of 11.15 is fair, indicating the stock is reasonably priced. Principal supports shareholders with a 3.76% dividend yield and reinvests efficiently, evidenced by a favorable 1046% ROIC versus WACC.
Operational Efficiency Meets Valuation Discipline
Principal Financial delivers superior capital efficiency with its exceptional ROIC over WACC, while Arch Capital excels in net margin and dividend yield. Arch suits investors prioritizing current income, whereas Principal fits those valuing capital returns and growth balance.
Which one offers the Superior Shareholder Reward?
I see Arch Capital Group Ltd. (ACGL) offers a higher dividend yield at 5.54% with a payout ratio of 44%, well covered by free cash flow. ACGL also executes steady buybacks, enhancing shareholder value. Principal Financial Group, Inc. (PFG) yields 3.76% with a similar payout ratio near 42%, but its buyback intensity is less pronounced. PFG’s higher financial leverage (28x vs. ACGL’s 3.4x) raises risk, questioning payout sustainability. I favor ACGL’s balanced distribution and buyback strategy for superior total return in 2026.
Comparative Score Analysis: The Strategic Profile
The radar chart reveals the fundamental DNA and trade-offs of Arch Capital Group Ltd. and Principal Financial Group, Inc.:
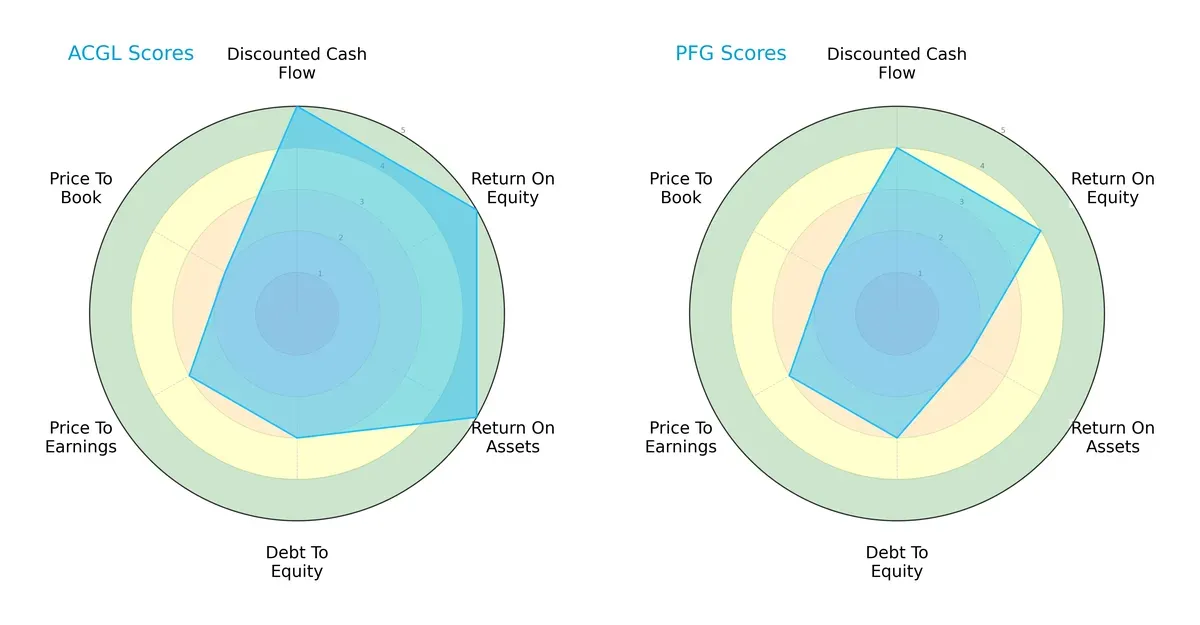
Arch Capital Group Ltd. dominates in cash flow generation, ROE, and ROA, showing operational efficiency. Principal Financial Group, Inc. lags in asset utilization but matches on debt management and valuation metrics. Arch Capital presents a more balanced financial profile, while Principal relies more on moderate leverage control.
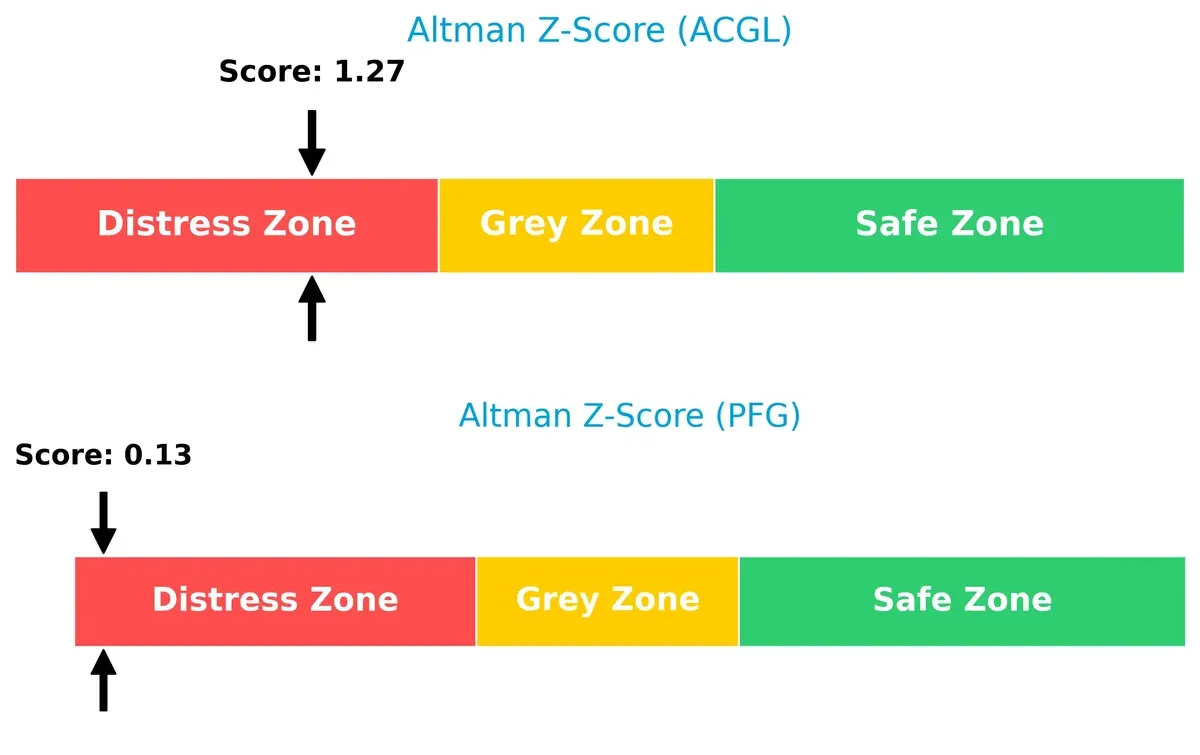
Bankruptcy Risk: Solvency Showdown
The Altman Z-Score gap shows both firms face distress zone risks, but Arch Capital’s score (1.27) suggests marginally better solvency than Principal Financial’s (0.13):
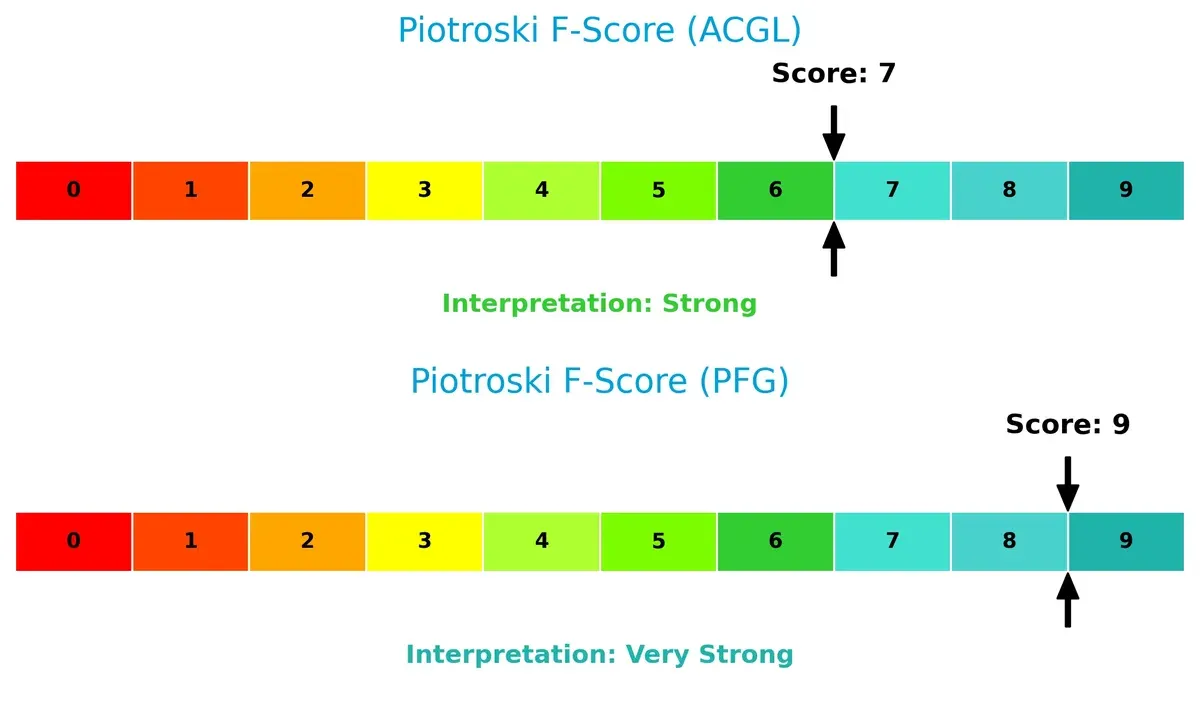
Financial Health: Quality of Operations
Principal Financial Group leads with a very strong Piotroski F-Score of 9, signaling peak financial health. Arch Capital’s 7 is strong but flags slightly weaker internal metrics:
How are the two companies positioned?
This section dissects the operational DNA of ACGL and PFG by comparing their revenue distribution by segment and internal strengths and weaknesses. The final objective confronts their economic moats to identify which model offers the most resilient, sustainable advantage today.
Revenue Segmentation: The Strategic Mix
This visual comparison dissects how Arch Capital Group Ltd. and Principal Financial Group, Inc. diversify their income streams and where their primary sector bets lie:
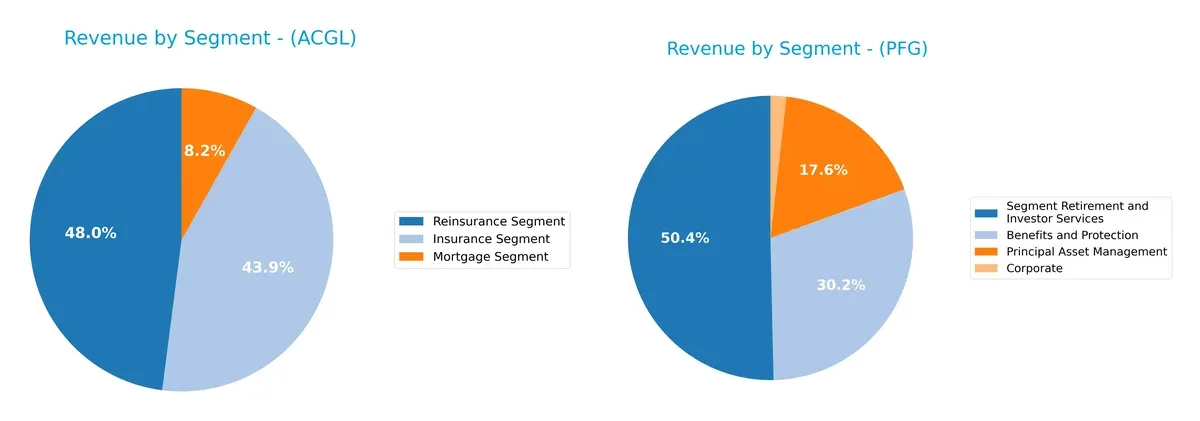
Arch Capital Group Ltd. anchors revenue in Reinsurance ($7.24B) and Insurance ($6.63B), with Mortgage trailing at $1.23B. Principal Financial Group, Inc. pivots around Retirement and Investor Services ($7.98B) and Benefits and Protection ($4.79B), plus Asset Management at $2.79B. Arch Capital’s balanced insurance segments reduce concentration risk. Principal’s heavy reliance on retirement services signals ecosystem lock-in but exposes it to market-driven volatility.
Strengths and Weaknesses Comparison
This table compares the Strengths and Weaknesses of Arch Capital Group Ltd. (ACGL) and Principal Financial Group, Inc. (PFG):
ACGL Strengths
- Strong profitability with 25.47% net margin
- Favorable ROE at 20.71%
- Low debt-to-assets at 3.85%
- High interest coverage ratio (32.73)
- Diversified revenue across insurance, mortgage, and reinsurance
PFG Strengths
- Extremely high ROIC at 1046.43%
- Favorable interest coverage (726.77)
- Favorable fixed asset turnover (20.96)
- Favorable dividend yield (3.76%)
- Diversified revenue with strong retirement and asset management segments
ACGL Weaknesses
- Unfavorable ROIC at 0%
- Poor liquidity ratios (current and quick ratios at 0)
- Low asset turnover (0.24)
- Neutral PB ratio (1.65)
- Moderate PE ratio (7.98)
PFG Weaknesses
- Neutral net margin (9.74%) and ROE (14.17%)
- Poor liquidity ratios (current and quick ratios at 0)
- Low asset turnover (0.05)
- Neutral PB ratio (1.58)
- Higher debt-to-equity (0.37) than ACGL
Both companies show strengths in profitability and diversification but face liquidity concerns with zero current and quick ratios. ACGL excels in net margin and ROE, while PFG leads in ROIC and asset efficiency. These factors shape each firm’s strategic financial management and risk profile.
The Moat Duel: Analyzing Competitive Defensibility
A structural moat shields long-term profits from relentless competitive pressure and market erosion. Let’s dissect the moats of Arch Capital Group and Principal Financial Group:
Arch Capital Group Ltd. (ACGL): Risk Expertise with Margin Stability
Arch Capital leverages intangible assets and underwriting expertise as its moat. This manifests in stable, high EBIT margins near 27%, but its declining ROIC signals weakening capital efficiency. New market risks in 2026 could deepen challenges.
Principal Financial Group, Inc. (PFG): Capital Efficiency and Growth Moat
Principal’s moat stems from strong capital allocation and diversified retirement services, driving ROIC well above WACC with a soaring growth trend. Unlike ACGL, PFG actively expands through asset management and insurance innovation in 2026.
Capital Allocation vs. Underwriting Expertise: The Moat Showdown
Principal Financial Group’s moat is wider and deeper, evidenced by a robust ROIC surpassing cost of capital and accelerating profitability. Arch Capital’s shrinking ROIC warns of eroding value, leaving PFG better positioned to defend and grow its market share.
Which stock offers better returns?
Over the past year, both Arch Capital Group Ltd. and Principal Financial Group, Inc. display strong upward price momentum with accelerating trends and notable gains.
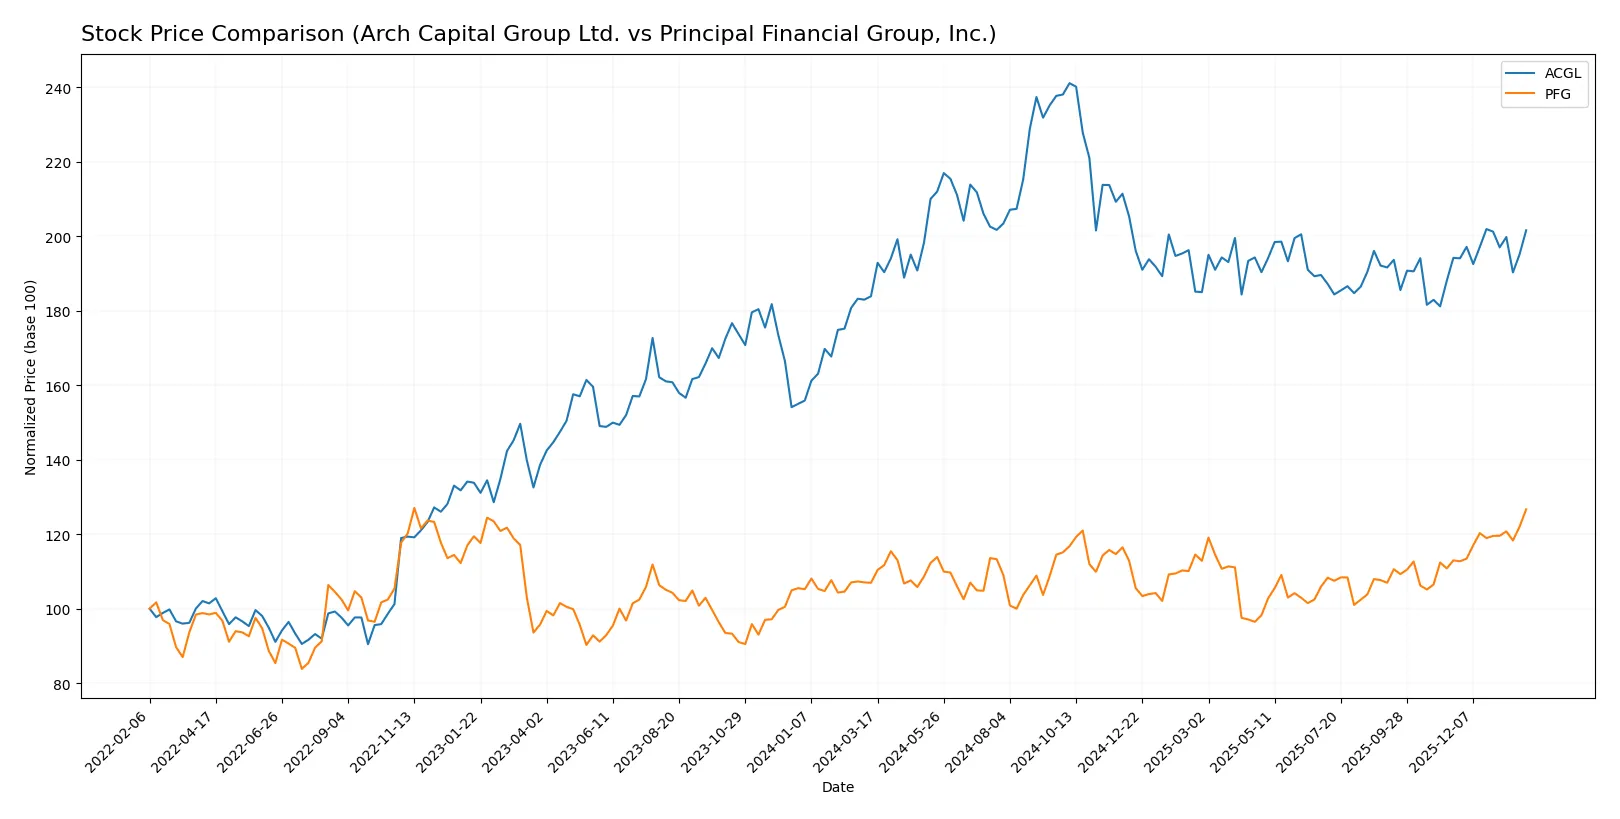
Trend Comparison
Arch Capital Group Ltd. (ACGL) shows a 9.62% price increase over 12 months, marking a bullish trend with accelerating momentum and a high-low range from 86.31 to 114.86.
Principal Financial Group, Inc. (PFG) posts an 18.44% gain over the same period, confirming a bullish trend with acceleration, a tighter volatility profile, and prices ranging between 72.14 and 94.72.
PFG outperforms ACGL with a higher total return and stronger recent price acceleration, delivering the superior market performance over the last year.
Target Prices
Analysts present a moderately bullish consensus for Arch Capital Group Ltd. and Principal Financial Group, Inc.
| Company | Target Low | Target High | Consensus |
|---|---|---|---|
| Arch Capital Group Ltd. | 93 | 125 | 104 |
| Principal Financial Group, Inc. | 85 | 100 | 91.5 |
For Arch Capital Group, the consensus target of 104 suggests a potential 8% upside from the current 96.04 price. Principal Financial Group’s target consensus of 91.5 implies a slight downside from the current 94.72 price, signaling cautious investor expectations.

Don’t Let Luck Decide Your Entry Point
Optimize your entry points with our advanced ProRealTime indicators. You’ll get efficient buy signals with precise price targets for maximum performance. Start outperforming now!
How do institutions grade them?
This section compares the latest institutional grades for Arch Capital Group Ltd. and Principal Financial Group, Inc.:
Arch Capital Group Ltd. Grades
Here are the recent grades issued by reputable financial institutions for Arch Capital Group Ltd.:
| Grading Company | Action | New Grade | Date |
|---|---|---|---|
| Cantor Fitzgerald | maintain | Neutral | 2026-01-14 |
| Goldman Sachs | maintain | Sell | 2026-01-08 |
| Barclays | maintain | Equal Weight | 2026-01-08 |
| Evercore ISI Group | maintain | In Line | 2026-01-07 |
| JP Morgan | maintain | Neutral | 2026-01-07 |
| Keefe, Bruyette & Woods | maintain | Market Perform | 2026-01-06 |
| Roth Capital | maintain | Buy | 2025-12-02 |
| Morgan Stanley | maintain | Overweight | 2025-11-17 |
| Wells Fargo | maintain | Overweight | 2025-10-29 |
| JP Morgan | maintain | Neutral | 2025-10-28 |
Principal Financial Group, Inc. Grades
Below are the latest institutional grades available for Principal Financial Group, Inc.:
| Grading Company | Action | New Grade | Date |
|---|---|---|---|
| Wells Fargo | maintain | Underweight | 2026-01-13 |
| UBS | maintain | Neutral | 2026-01-08 |
| JP Morgan | downgrade | Neutral | 2026-01-05 |
| Piper Sandler | maintain | Overweight | 2025-12-23 |
| Keefe, Bruyette & Woods | maintain | Market Perform | 2025-10-30 |
| Wells Fargo | maintain | Underweight | 2025-10-29 |
| Morgan Stanley | upgrade | Equal Weight | 2025-10-23 |
| Keefe, Bruyette & Woods | maintain | Market Perform | 2025-10-09 |
| Evercore ISI Group | maintain | In Line | 2025-10-09 |
| Barclays | maintain | Underweight | 2025-10-08 |
Which company has the best grades?
Arch Capital Group Ltd. consistently receives neutral to overweight ratings, with some “Buy” and “Overweight” grades from top firms. Principal Financial Group, Inc. shows more mixed ratings, including multiple “Underweight” grades and recent downgrades. Investors may view Arch Capital as more favorably rated, potentially reflecting stronger institutional confidence.
Risks specific to each company
The following categories identify the critical pressure points and systemic threats facing both firms in the 2026 market environment:
1. Market & Competition
Arch Capital Group Ltd. (ACGL)
- Operates globally in diversified insurance and reinsurance, facing intense competition from specialized insurers and reinsurers.
Principal Financial Group, Inc. (PFG)
- Competes in retirement, asset management, and insurance with a broad product range, challenged by fintech and asset managers.
2. Capital Structure & Debt
Arch Capital Group Ltd. (ACGL)
- Maintains low debt-to-equity (0.13) and debt-to-assets (3.85%), signaling conservative leverage and financial flexibility.
Principal Financial Group, Inc. (PFG)
- Higher leverage ratio (debt/equity 0.37) but still favorable, with strong interest coverage (726.77), reducing default risk.
3. Stock Volatility
Arch Capital Group Ltd. (ACGL)
- Exhibits low beta (0.425), indicating lower market volatility and defensive stock behavior.
Principal Financial Group, Inc. (PFG)
- Shows higher beta (0.9), suggesting increased sensitivity to market swings and higher volatility risk.
4. Regulatory & Legal
Arch Capital Group Ltd. (ACGL)
- Faces complex international insurance regulations, with exposure to reinsurance and mortgage insurance compliance challenges.
Principal Financial Group, Inc. (PFG)
- Subject to stringent U.S. and international financial regulations affecting retirement and investment products.
5. Supply Chain & Operations
Arch Capital Group Ltd. (ACGL)
- Relies on brokers worldwide, which may create operational dependencies and distribution risks.
Principal Financial Group, Inc. (PFG)
- Operates with a broad employee base and multiple segments, which may complicate operational efficiency and integration.
6. ESG & Climate Transition
Arch Capital Group Ltd. (ACGL)
- Exposure to property and catastrophe insurance heightens vulnerability to climate risks and transition costs.
Principal Financial Group, Inc. (PFG)
- Faces pressure to integrate ESG in asset management and retirement solutions amid evolving regulatory expectations.
7. Geopolitical Exposure
Arch Capital Group Ltd. (ACGL)
- Bermuda headquarters and global footprint expose it to geopolitical instability and regulatory shifts outside the U.S.
Principal Financial Group, Inc. (PFG)
- Predominantly U.S.-based but with international operations in emerging markets, exposing it to geopolitical and currency risks.
Which company shows a better risk-adjusted profile?
Arch Capital Group’s most impactful risk lies in operational and regulatory complexity across diverse insurance lines and regions. Principal Financial’s key risk centers on higher stock volatility and geopolitical exposure in emerging markets. Despite ACGL’s operational challenges, its lower leverage and beta indicate a more stable risk-adjusted profile. Principal’s impressive profitability metrics come with elevated market sensitivity, which demands cautious position sizing. The stark contrast in beta (0.425 vs. 0.9) and interest coverage ratios (32.7 vs. 726.8) highlights this dynamic clearly.
Final Verdict: Which stock to choose?
Arch Capital Group Ltd. (ACGL) stands out as a cash-generating powerhouse with efficient capital allocation driving strong returns on equity. Its main point of vigilance lies in deteriorating ROIC trends, signaling potential challenges in long-term value creation. ACGL fits investors seeking aggressive growth with a tolerance for operational risks.
Principal Financial Group, Inc. (PFG) offers a durable competitive moat backed by an exceptional ROIC far exceeding its cost of capital. Its robust free cash flow and conservative debt profile provide a safety cushion relative to ACGL. PFG suits a GARP (Growth at a Reasonable Price) portfolio focused on stability and sustainable profitability.
If you prioritize capital efficiency and durable value creation, PFG is the compelling choice due to its growing ROIC and strong moat. However, if you seek higher growth potential with a willingness to accept ROIC volatility, ACGL offers an aggressive growth scenario but demands close monitoring of its capital returns.
Disclaimer: Investment carries a risk of loss of initial capital. The past performance is not a reliable indicator of future results. Be sure to understand risks before making an investment decision.
Go Further
I encourage you to read the complete analyses of Arch Capital Group Ltd. and Principal Financial Group, Inc. to enhance your investment decisions: