Home > Comparison > Financial Services > BRK-B vs ACGL
The strategic rivalry between Berkshire Hathaway Inc. and Arch Capital Group Ltd. shapes the landscape of diversified insurance within financial services. Berkshire Hathaway operates as a sprawling conglomerate with broad industrial and utility interests, while Arch Capital focuses on specialized insurance and reinsurance solutions. This analysis pits conglomerate scale against niche expertise to identify which model offers superior risk-adjusted returns for a balanced portfolio in today’s complex market environment.

Table of contents
Companies Overview
Berkshire Hathaway Inc. and Arch Capital Group Ltd. are pivotal players in the diversified insurance industry.
Berkshire Hathaway Inc.: Diversified Conglomerate with Insurance Core
Berkshire Hathaway dominates through its diversified insurance and reinsurance operations, complemented by freight rail, utilities, and manufacturing. Its vast revenue engine spans property, casualty, life insurance, and energy generation from multiple sources. In 2026, the firm focuses on expanding its industrial and utility segments while maintaining strong capital allocation discipline.
Arch Capital Group Ltd.: Specialty Insurance and Reinsurance Leader
Arch Capital Group concentrates on specialized insurance and reinsurance products, including casualty, mortgage, and commercial coverages. It generates revenue via primary insurance and reinsurance segments, marketed through brokers globally. In 2026, Arch prioritizes growth in casualty reinsurance and tailored risk management solutions, emphasizing broker relationships to deepen market penetration.
Strategic Collision: Similarities & Divergences
Both embrace diversified insurance, but Berkshire operates a broader conglomerate model, while Arch targets niche specialty and reinsurance markets. Their competition centers on casualty risk and reinsurance domains. Berkshire’s massive scale contrasts with Arch’s focused underwriting expertise, creating distinct investment profiles shaped by diversified conglomerate stability versus specialized insurance agility.
Income Statement Comparison
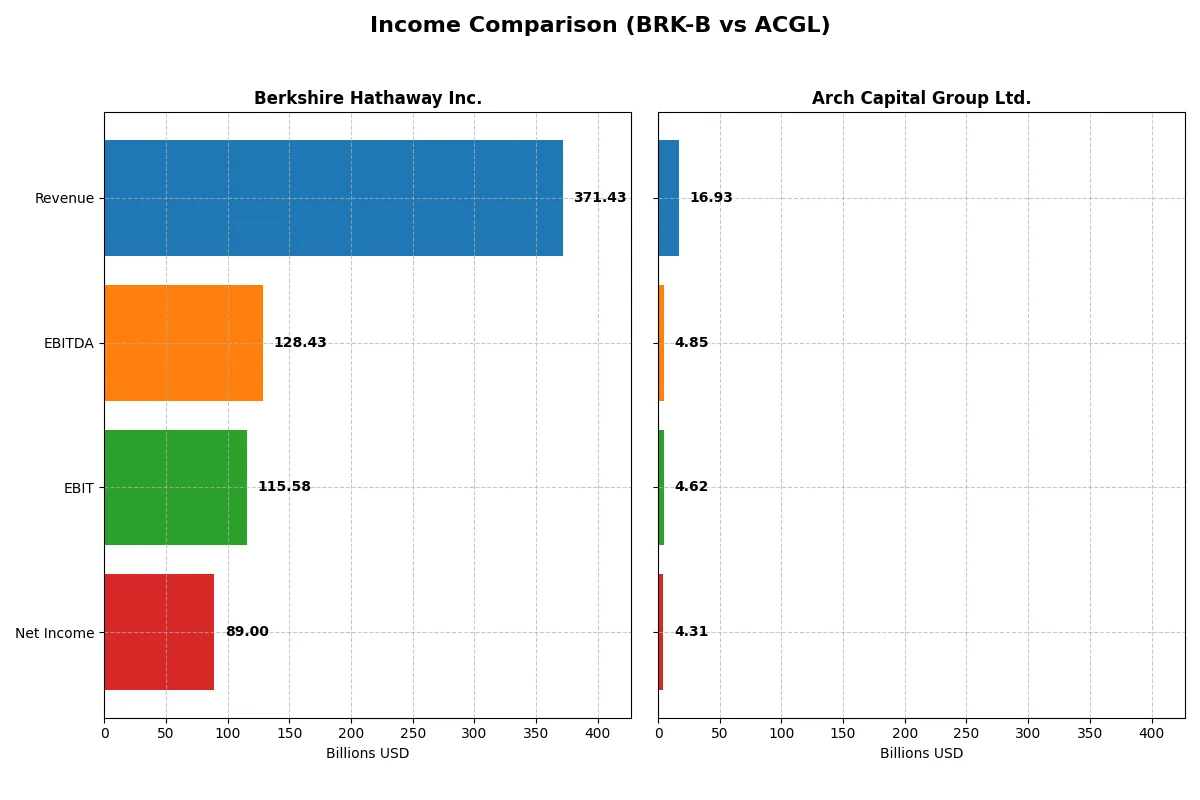
This data dissects the core profitability and scalability of both corporate engines to reveal who dominates the bottom line:
| Metric | Berkshire Hathaway Inc. (BRK-B) | Arch Capital Group Ltd. (ACGL) |
|---|---|---|
| Revenue | 371.4B | 16.9B |
| Cost of Revenue | 284.9B | 11.0B |
| Operating Expenses | 27.1B | 1.46B |
| Gross Profit | 86.6B | 5.94B |
| EBITDA | 128.4B | 4.85B |
| EBIT | 115.6B | 4.62B |
| Interest Expense | 5.20B | 0.14B |
| Net Income | 89.0B | 4.31B |
| EPS | 41.27 | 11.47 |
| Fiscal Year | 2024 | 2024 |
Income Statement Analysis: The Bottom-Line Duel
This income statement comparison reveals which company runs its business most efficiently by dissecting revenue, margins, and net income trends.
Berkshire Hathaway Inc. Analysis
Berkshire Hathaway’s revenue rose 30% from 2020 to 2024 but dropped 15% in the latest year to $371B. Net income more than doubled over five years, reaching $89B in 2024, despite a slight EPS decline. Gross margin at 23.3% and net margin near 24% remain strong, demonstrating resilient profitability even amid revenue volatility.
Arch Capital Group Ltd. Analysis
Arch Capital doubled revenue since 2020, hitting $17B in 2024 with a 27% one-year growth surge. Net income grew over 200% in five years, reaching $4.3B, though net margin slipped slightly to 25.5%. Gross margin at 35% and EBIT margin above 27% highlight operational efficiency and robust earnings momentum in recent periods.
Margin Strength vs. Growth Momentum
Berkshire Hathaway exhibits superior scale with a larger absolute bottom line and stable margins, reflecting steady profit generation. Arch Capital impresses with faster revenue and net income growth, paired with higher gross margins but slight margin compression recently. Investors seeking large-scale stability may favor Berkshire; growth-oriented profiles might prefer Arch’s accelerating momentum.
Financial Ratios Comparison
These vital ratios act as a diagnostic tool to expose the underlying fiscal health, valuation premiums, and capital efficiency of the companies compared below:
| Ratios | Berkshire Hathaway Inc. (BRK-B) | Arch Capital Group Ltd. (ACGL) |
|---|---|---|
| ROE | 13.7% | 20.7% |
| ROIC | 4.4% | N/A |
| P/E | 11.0 | 8.0 |
| P/B | 1.51 | 1.65 |
| Current Ratio | 5.94 | 0 |
| Quick Ratio | 5.61 | 0 |
| D/E | 0.22 | 0.13 |
| Debt-to-Assets | 12.4% | 3.8% |
| Interest Coverage | 11.43 | 31.73 |
| Asset Turnover | 0.32 | 0.24 |
| Fixed Asset Turnover | 1.62 | 0 |
| Payout ratio | 0% | 44.2% |
| Dividend yield | 0% | 5.54% |
| Fiscal Year | 2024 | 2024 |
Efficiency & Valuation Duel: The Vital Signs
Financial ratios act as a company’s DNA, uncovering hidden risks and revealing operational strengths that guide investor decisions.
Berkshire Hathaway Inc.
Berkshire Hathaway delivers a solid 13.7% ROE and a strong 23.96% net margin, indicating decent profitability. Its P/E of 10.98 suggests a fairly valued stock, neither stretched nor cheap. However, absence of dividends points to reinvestment into diverse operations, balancing moderate returns with capital preservation.
Arch Capital Group Ltd.
Arch Capital impresses with a 20.7% ROE and a slightly higher net margin of 25.47%, reflecting operational efficiency. The P/E ratio of 7.98 signifies an attractively priced stock. Shareholders benefit from a 5.54% dividend yield, offering immediate income alongside growth, supporting a balanced return profile.
Profitability Strength vs. Income Yield: Balancing the Scales
Both companies show slightly favorable ratio profiles, but Arch Capital’s higher ROE and dividend yield provide a stronger risk-reward blend. Berkshire prioritizes reinvestment over dividends, fitting investors focused on long-term capital growth. Arch suits those seeking efficiency and income combined.
Which one offers the Superior Shareholder Reward?
Berkshire Hathaway (BRK-B) pays no dividends, instead reinvesting free cash flow (5.4B per share) to fuel growth and acquisitions. Arch Capital Group (ACGL) yields 5.54% with a 44% payout ratio, supported by strong free cash flow coverage (99%). ACGL’s regular dividends plus modest buybacks contrast with BRK-B’s aggressive reinvestment and minimal buybacks. I see ACGL’s distribution as more immediately rewarding but BRK-B’s strategy as more sustainable long-term. For 2026 investors seeking total return, BRK-B offers superior compounding potential, while ACGL suits income-focused portfolios. I favor BRK-B for superior shareholder reward over time.
Comparative Score Analysis: The Strategic Profile
The radar chart reveals the fundamental DNA and trade-offs of Berkshire Hathaway Inc. and Arch Capital Group Ltd., illustrating their financial strengths and vulnerabilities:
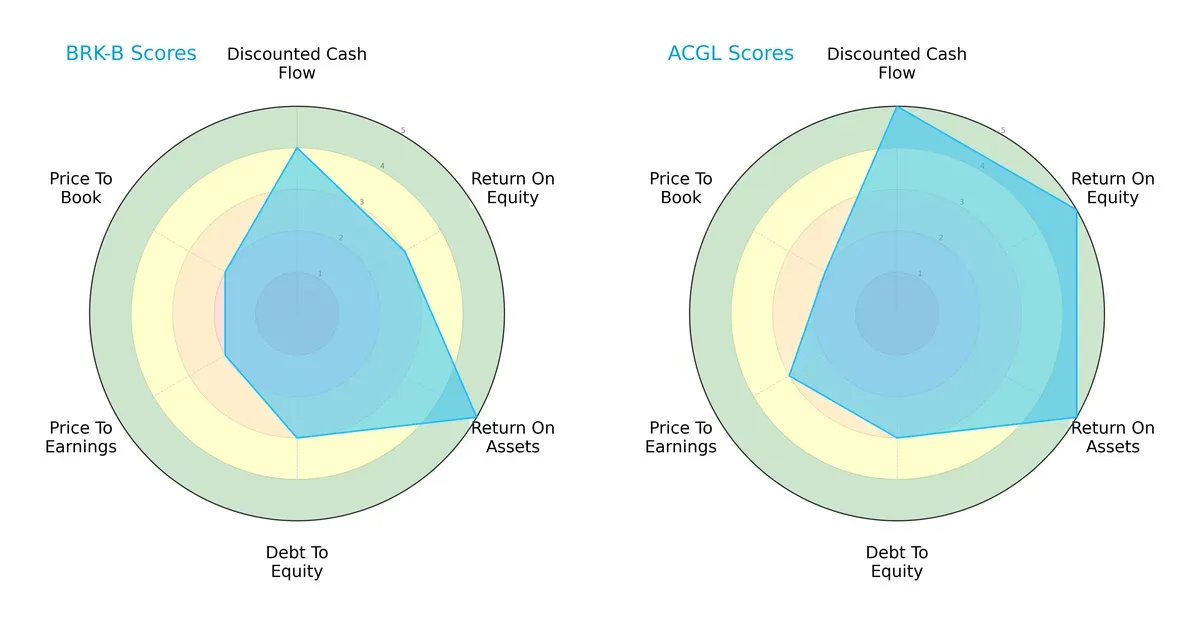
Arch Capital Group Ltd. leads with a more balanced and superior profile, scoring very favorably on discounted cash flow, return on equity, and return on assets. Berkshire Hathaway Inc. shows strength in asset utilization but lags in valuation metrics, indicating reliance on operational efficiency over market re-rating. Arch’s higher overall and ROE scores suggest a stronger growth and profitability edge.
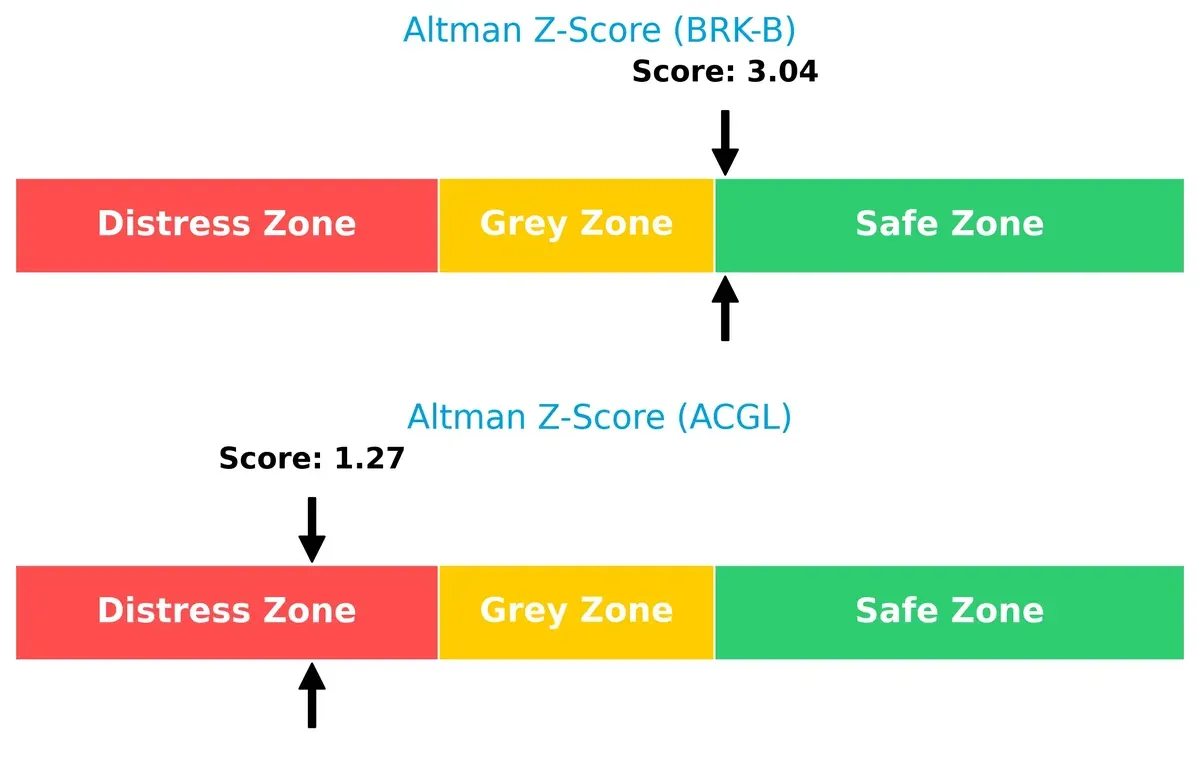
Bankruptcy Risk: Solvency Showdown
Arch Capital’s Altman Z-Score falls into the distress zone at 1.27, signaling significant bankruptcy risk. Berkshire Hathaway’s score of 3.04 places it safely above the distress threshold, implying durable solvency through this cycle:
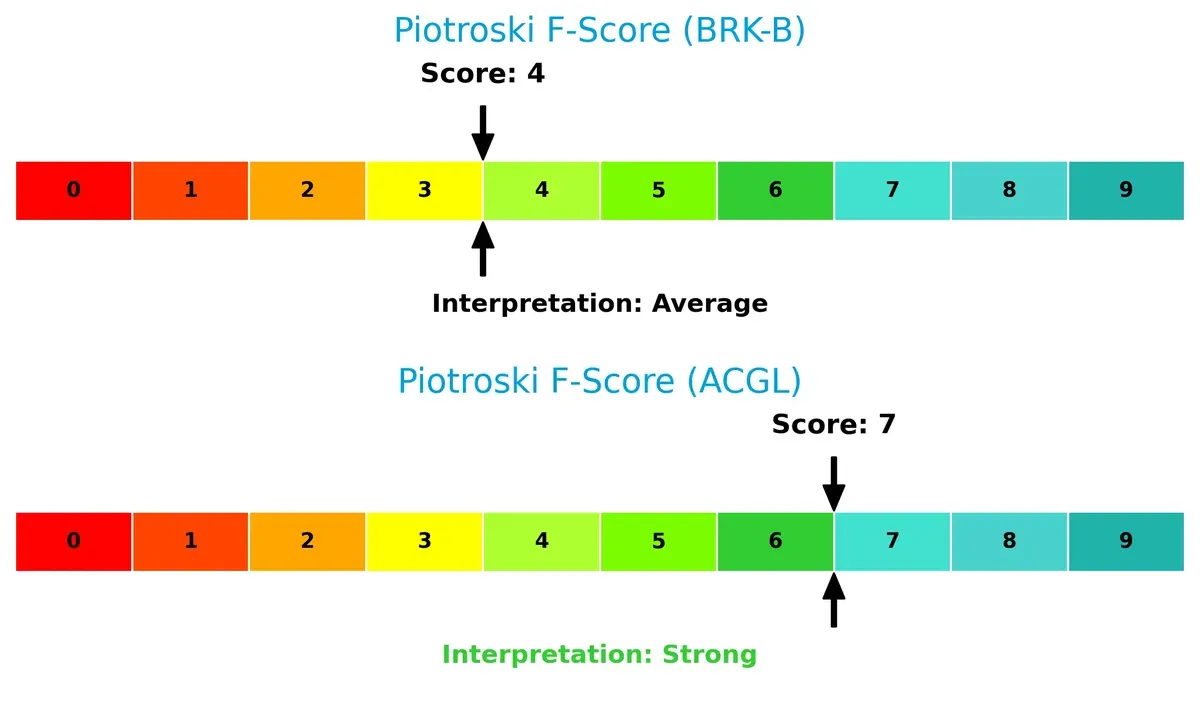
Financial Health: Quality of Operations
Berkshire Hathaway’s Piotroski F-Score of 4 signals average financial health with potential internal weaknesses. Arch Capital’s score of 7 indicates stronger operational quality and fewer red flags, reflecting better fundamental robustness:
How are the two companies positioned?
This section dissects the operational DNA of Berkshire Hathaway and Arch Capital by comparing their revenue distribution and internal dynamics. The goal is to confront their economic moats and identify which model offers the most resilient, sustainable competitive advantage today.
Revenue Segmentation: The Strategic Mix
This visual comparison dissects how Berkshire Hathaway Inc. and Arch Capital Group Ltd. diversify their income streams and where their primary sector bets lie:
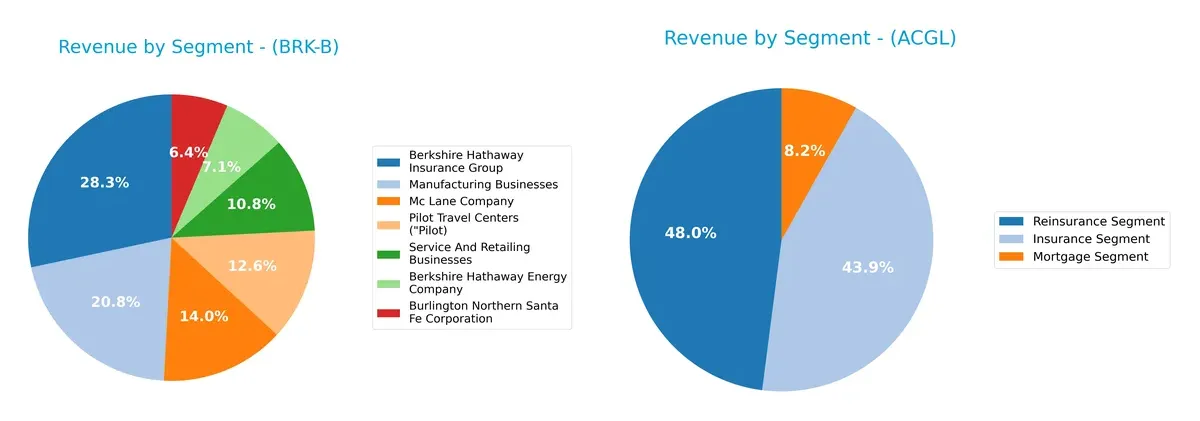
Berkshire Hathaway anchors its revenue in a broad industrial and insurance base, with $105B from insurance and $77B from manufacturing, showcasing robust diversification. Arch Capital Group pivots mainly on insurance ($6.6B) and reinsurance ($7.2B), revealing a concentrated focus with mortgage as a smaller stream. Berkshire’s diverse portfolio reduces sector risk, while Arch’s concentration exposes it to insurance cycle volatility but leverages deep sector expertise.
Strengths and Weaknesses Comparison
This table compares the strengths and weaknesses of Berkshire Hathaway Inc. and Arch Capital Group Ltd.:
Berkshire Hathaway Inc. Strengths
- Highly diversified business segments across insurance, manufacturing, retail, and energy
- Favorable net margin at 23.96%
- Strong interest coverage ratio at 22.23
- Low debt-to-assets ratio at 12.44%
- Favorable weighted average cost of capital at 6.63%
Arch Capital Group Ltd. Strengths
- Favorable net margin at 25.47%
- High return on equity at 20.71%
- Low debt-to-assets ratio at 3.85%
- Strong interest coverage ratio at 32.73
- Favorable weighted average cost of capital at 5.73%
- Positive dividend yield at 5.54%
Berkshire Hathaway Inc. Weaknesses
- Unfavorable return on invested capital at 4.37% below WACC
- Unfavorable asset turnover at 0.32
- Unfavorable current ratio at 5.94 indicating possible liquidity inefficiency
- No dividend yield
- Neutral return on equity at 13.7%
Arch Capital Group Ltd. Weaknesses
- Unfavorable zero return on invested capital
- Unfavorable current and quick ratios at 0 indicating liquidity concerns
- Unfavorable fixed asset turnover at 0
- Higher proportion of unfavorable ratios (35.71%) compared to Berkshire Hathaway
Berkshire Hathaway’s extensive diversification and strong financial structure mark significant strengths, but its below-cost-of-capital returns and liquidity metrics warrant attention. Arch Capital excels in profitability and leverage management but faces liquidity constraints and weaker asset utilization. These contrasts highlight different strategic focuses and operational efficiencies between the two companies.
The Moat Duel: Analyzing Competitive Defensibility
A structural moat protects long-term profits from relentless competition erosion. Let’s dissect the unique moats of two insurance giants:
Berkshire Hathaway Inc.: Diversified Conglomerate Moat
Berkshire leverages intangible assets and capital allocation expertise. Its vast portfolio drives stable margins despite a recent revenue dip. In 2026, diversification across insurance, utilities, and manufacturing should buffer competitive pressures.
Arch Capital Group Ltd.: Specialized Insurance Moat
Arch’s moat hinges on underwriting excellence and niche reinsurance. It commands higher gross margins and robust revenue growth, signaling operational strength. Expansion in casualty and mortgage insurance enhances its market foothold for 2026.
Moat Strength Showdown: Diversification vs. Niche Expertise
Both firms face declining ROIC trends, signaling moat erosion risks. However, Arch’s sharper focus yields stronger margin expansion, while Berkshire’s broad scale offers resilience. Arch’s specialized moat appears deeper, but Berkshire’s diversity better defends market share longevity.
Which stock offers better returns?
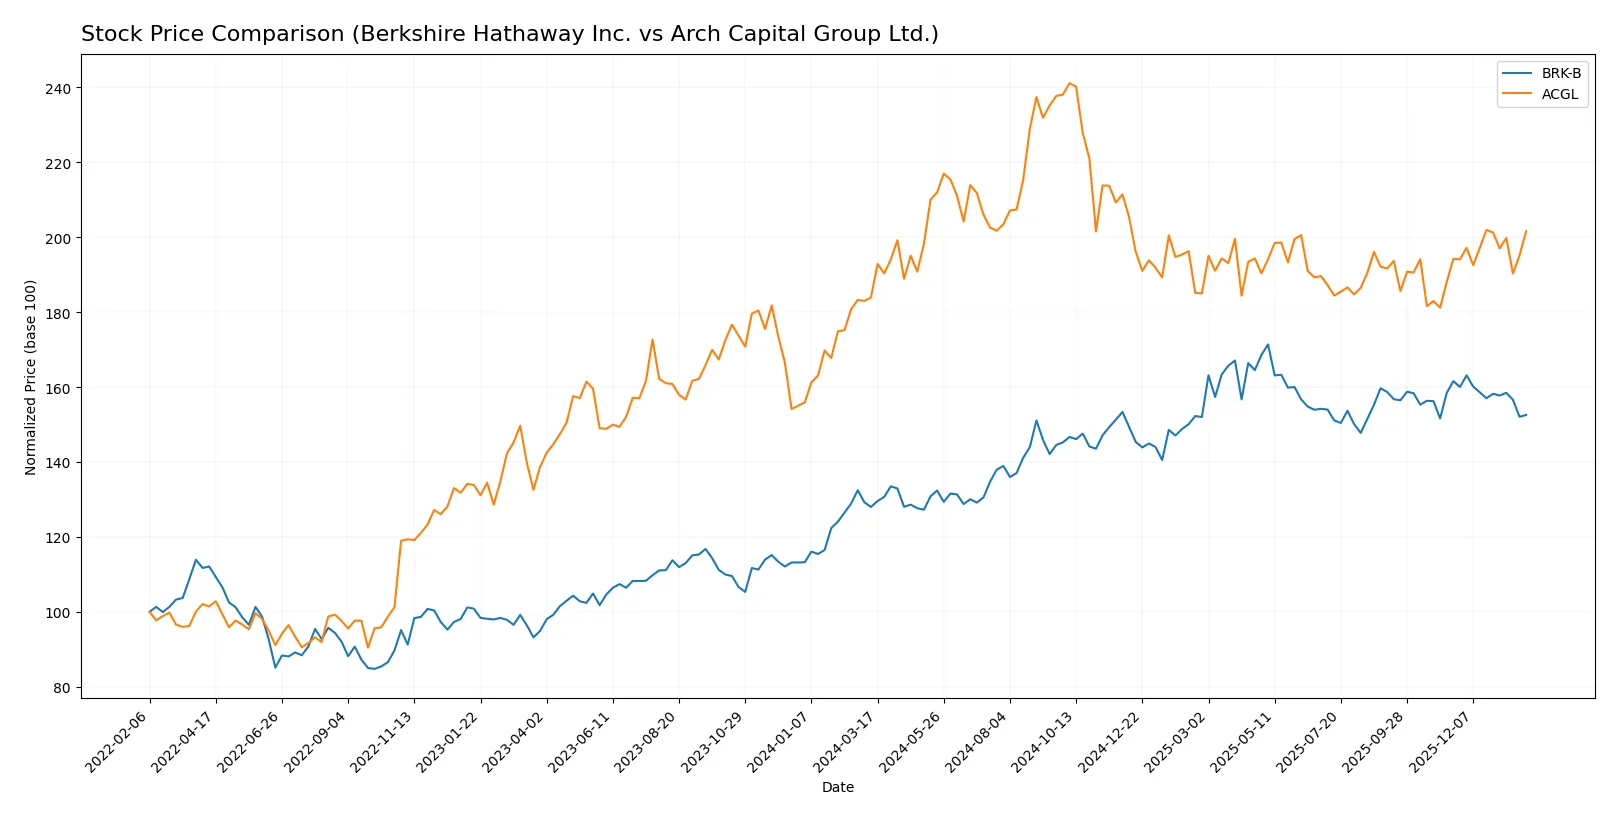
The past year shows contrasting price dynamics: Berkshire Hathaway’s stock rose sharply but slowed recently, while Arch Capital steadily gained momentum with accelerating growth.
Trend Comparison
Berkshire Hathaway’s stock gained 19.19% over the past 12 months, reflecting a bullish trend with decelerating price increase. It reached a high of 539.8 but declined 5.58% recently, indicating short-term weakness.
Arch Capital’s stock rose 9.62% over the same period, also bullish with accelerating momentum. It showed a steady rise to 114.86 and a recent 3.8% gain, sustaining positive short-term performance.
Berkshire Hathaway delivered higher overall returns but faces recent downward pressure. Arch Capital posted moderate gains with continued short-term strength, reflecting more consistent upward momentum.
Target Prices
Analysts present a mixed but generally positive outlook for Berkshire Hathaway Inc. and Arch Capital Group Ltd.
| Company | Target Low | Target High | Consensus |
|---|---|---|---|
| Berkshire Hathaway Inc. | 450 | 481 | 465.5 |
| Arch Capital Group Ltd. | 93 | 125 | 104 |
Berkshire Hathaway’s target consensus sits slightly below its current price of 480.53, indicating a cautious upside. Arch Capital’s target consensus at 104 suggests a moderate 8% potential gain from its 96.04 market price.

Don’t Let Luck Decide Your Entry Point
Optimize your entry points with our advanced ProRealTime indicators. You’ll get efficient buy signals with precise price targets for maximum performance. Start outperforming now!
How do institutions grade them?
Here are the latest institutional grades for Berkshire Hathaway Inc. and Arch Capital Group Ltd.:
Berkshire Hathaway Inc. Grades
The following table summarizes UBS’s consistent grades for Berkshire Hathaway Inc.:
| Grading Company | Action | New Grade | Date |
|---|---|---|---|
| UBS | Maintain | Buy | 2025-11-03 |
| UBS | Maintain | Buy | 2025-10-15 |
| UBS | Maintain | Buy | 2025-08-04 |
| UBS | Maintain | Buy | 2025-07-23 |
| UBS | Maintain | Buy | 2025-06-03 |
| UBS | Maintain | Buy | 2025-04-25 |
| UBS | Maintain | Buy | 2025-02-24 |
| UBS | Maintain | Buy | 2025-01-24 |
| UBS | Maintain | Buy | 2024-11-04 |
| UBS | Maintain | Buy | 2024-02-28 |
Arch Capital Group Ltd. Grades
This table presents recent grades from multiple reputable firms for Arch Capital Group Ltd.:
| Grading Company | Action | New Grade | Date |
|---|---|---|---|
| Cantor Fitzgerald | Maintain | Neutral | 2026-01-14 |
| Goldman Sachs | Maintain | Sell | 2026-01-08 |
| Barclays | Maintain | Equal Weight | 2026-01-08 |
| Evercore ISI Group | Maintain | In Line | 2026-01-07 |
| JP Morgan | Maintain | Neutral | 2026-01-07 |
| Keefe, Bruyette & Woods | Maintain | Market Perform | 2026-01-06 |
| Roth Capital | Maintain | Buy | 2025-12-02 |
| Morgan Stanley | Maintain | Overweight | 2025-11-17 |
| Wells Fargo | Maintain | Overweight | 2025-10-29 |
| JP Morgan | Maintain | Neutral | 2025-10-28 |
Which company has the best grades?
Berkshire Hathaway holds a clear edge with consistent “Buy” ratings from UBS. Arch Capital shows mixed grades, ranging from “Sell” to “Buy.” Investors may perceive Berkshire as a more stable pick due to uniform positive ratings.
Risks specific to each company
The following categories identify the critical pressure points and systemic threats facing both firms in the challenging 2026 market environment:
1. Market & Competition
Berkshire Hathaway Inc.
- Diversified operations buffer market shifts but face slow asset turnover challenges.
Arch Capital Group Ltd.
- Focused insurance segments face intense pricing pressure and underwriting risks.
2. Capital Structure & Debt
Berkshire Hathaway Inc.
- Low debt-to-equity (0.22) and strong interest coverage (22.23) support financial stability.
Arch Capital Group Ltd.
- Even lower leverage (0.13) and superior interest coverage (32.73) reflect prudent debt management.
3. Stock Volatility
Berkshire Hathaway Inc.
- Beta of 0.71 indicates moderate market sensitivity and relatively stable price movements.
Arch Capital Group Ltd.
- Lower beta of 0.425 signals less volatility, appealing to risk-averse investors.
4. Regulatory & Legal
Berkshire Hathaway Inc.
- Complex multi-sector operations expose it to diverse regulatory environments and compliance costs.
Arch Capital Group Ltd.
- Insurance and reinsurance focus subjects it to evolving regulatory frameworks and solvency requirements.
5. Supply Chain & Operations
Berkshire Hathaway Inc.
- Extensive industrial and retail segments face operational complexity and supply chain disruptions.
Arch Capital Group Ltd.
- Primarily service-based; less exposed to physical supply chain risks but dependent on broker networks.
6. ESG & Climate Transition
Berkshire Hathaway Inc.
- Exposure to fossil fuel assets presents transition risk amid tightening climate policies.
Arch Capital Group Ltd.
- Insurance underwriting may face increased claims from climate-related catastrophes, impacting reserves.
7. Geopolitical Exposure
Berkshire Hathaway Inc.
- US-centric but global utilities and railroads face trade and infrastructure policy risks.
Arch Capital Group Ltd.
- Bermuda-based with global insurance exposure, vulnerable to geopolitical instability and regulatory divergence.
Which company shows a better risk-adjusted profile?
Arch Capital’s key risk lies in regulatory and underwriting volatility, though its strong debt metrics and low beta cushion shocks. Berkshire’s main concern is operational complexity and climate transition risks amplified by fossil fuel exposure. Overall, Arch Capital offers a cleaner risk-adjusted profile supported by superior Altman Z-Score and Piotroski metrics. However, Berkshire’s diversified cash flows and robust liquidity provide resilience in uncertain markets. Arch’s recent stronger ROE (20.7% vs. 13.7%) and lower debt-to-asset ratio (3.85% vs. 12.44%) justify my cautious preference for its risk management discipline.
Final Verdict: Which stock to choose?
Berkshire Hathaway Inc. shines with its unparalleled capital allocation mastery and vast, diversified portfolio, acting as a robust cash machine. Its point of vigilance lies in a declining ROIC, signaling challenges in maintaining value creation. This stock suits investors with a long-term, value-oriented, aggressive growth appetite.
Arch Capital Group Ltd. boasts a strategic moat rooted in its disciplined underwriting and recurring revenue streams. It offers a safer profile with stronger recent profitability and cash flow generation despite signs of value erosion. This stock fits well in GARP portfolios seeking growth balanced with reasonable valuation.
If you prioritize durable capital allocation and diversified exposure, Berkshire Hathaway commands attention despite its waning ROIC. However, if you seek superior recent cash flow yield and a focused insurance moat, Arch Capital offers better stability and growth momentum, albeit with caution on financial distress signals.
Disclaimer: Investment carries a risk of loss of initial capital. The past performance is not a reliable indicator of future results. Be sure to understand risks before making an investment decision.
Go Further
I encourage you to read the complete analyses of Berkshire Hathaway Inc. and Arch Capital Group Ltd. to enhance your investment decisions: