Home > Comparison > Consumer Cyclical > ORLY vs APTV
The strategic rivalry between O’Reilly Automotive, Inc. and Aptiv PLC defines the trajectory of the automotive parts sector. O’Reilly operates a vast retail network focused on aftermarket parts in the Consumer Cyclical sector. Aptiv, a global innovator, integrates advanced electrical and safety technologies. This analysis pits traditional retail strength against technological innovation to identify which offers superior risk-adjusted returns for diversified portfolios.

Table of contents
Companies Overview
O’Reilly Automotive and Aptiv PLC stand as major players reshaping the auto-parts industry across distinct market niches.
O’Reilly Automotive, Inc.: Retail Powerhouse in Auto Aftermarket
O’Reilly dominates the U.S. aftermarket auto parts retail sector. Its core revenue derives from selling new and remanufactured automotive parts, tools, and accessories through 5,784 stores. In 2021, it focused on expanding store footprint and enhancing service offerings like battery testing and paint shop materials to deepen customer loyalty.
Aptiv PLC: Innovator in Vehicle Electrical and Safety Systems
Aptiv leads in designing and manufacturing electrical, electronic, and safety systems for global automotive markets. Its revenue engine splits between Signal and Power Solutions and Advanced Safety segments, delivering wiring harnesses and autonomous driving tech. In 2021, Aptiv prioritized software development and system integration to advance vehicle connectivity and safety features.
Strategic Collision: Similarities & Divergences
Both operate in auto parts but pursue divergent models: O’Reilly emphasizes a retail-focused, customer service ecosystem, while Aptiv pursues a tech-driven, integrated systems approach. They clash primarily in supplying components for vehicle maintenance and next-gen safety. Their distinct investment profiles reflect O’Reilly’s defensive retail moat versus Aptiv’s growth-oriented innovation curve.
Income Statement Comparison
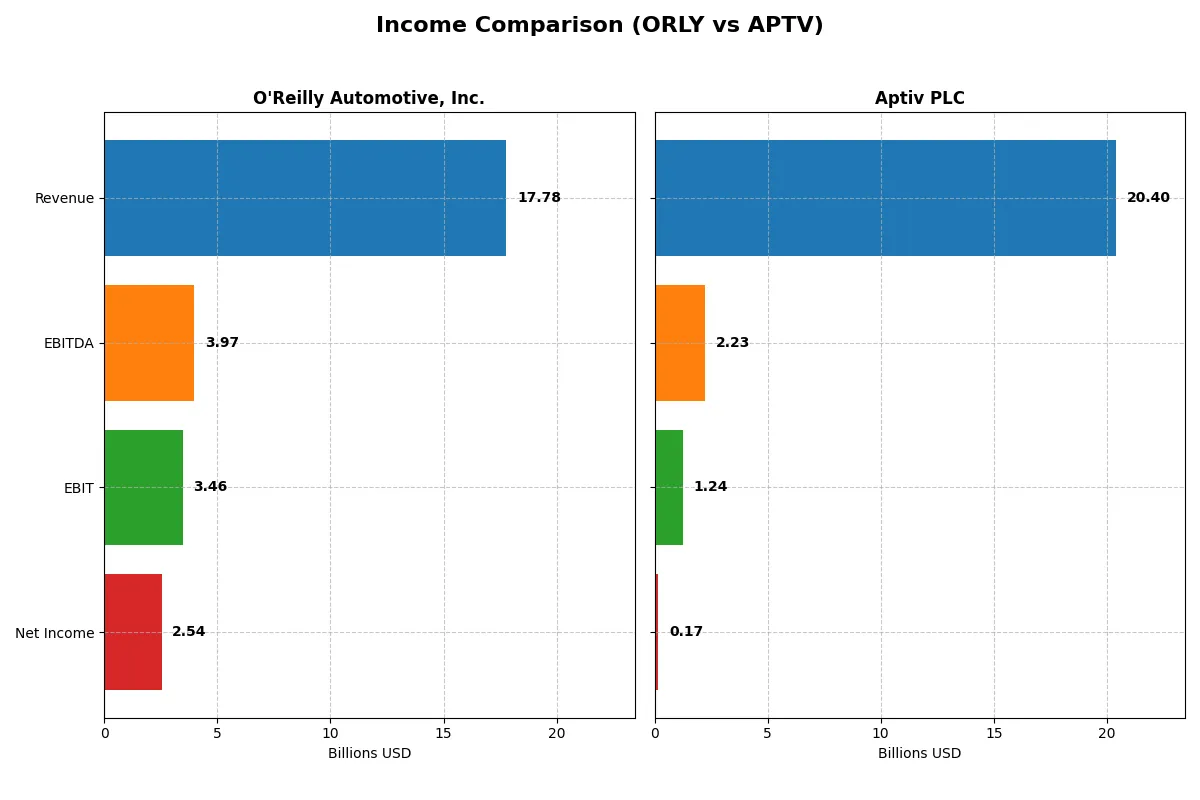
This data dissects the core profitability and scalability of both corporate engines to reveal who dominates the bottom line:
| Metric | O’Reilly Automotive, Inc. (ORLY) | Aptiv PLC (APTV) |
|---|---|---|
| Revenue | 17.8B | 20.4B |
| Cost of Revenue | 8.61B | 16.5B |
| Operating Expenses | 5.71B | 2.71B |
| Gross Profit | 9.17B | 3.90B |
| EBITDA | 3.97B | 2.23B |
| EBIT | 3.46B | 1.24B |
| Interest Expense | 235M | 361M |
| Net Income | 2.54B | 165M |
| EPS | 2.98 | 0.75 |
| Fiscal Year | 2025 | 2025 |
Income Statement Analysis: The Bottom-Line Duel
This income statement comparison reveals which company manages its revenue and costs most efficiently to maximize shareholder value.
O’Reilly Automotive, Inc. Analysis
O’Reilly Automotive’s revenue grows steadily, reaching $17.8B in 2025 with net income at $2.54B. Gross margin holds strong at 51.6%, reflecting robust product pricing and cost control. Its net margin of 14.3% remains favorable, underlining efficient operations despite slight margin pressure. Earnings per share rose 9.6% last year, signaling solid momentum.
Aptiv PLC Analysis
Aptiv’s revenue climbs moderately to $20.4B in 2025, but net income collapses to $165M, down sharply from prior years. Gross margin at 19.1% lags industry peers, while net margin shrinks to just 0.8%, highlighting severe profitability challenges. EBIT dropped over 50% last year, indicating operational struggles despite top-line growth.
Margin Strength vs. Profit Decline
O’Reilly dominates with consistently higher margins and positive earnings growth, contrasting Aptiv’s steep profit decline despite revenue gains. O’Reilly’s stable profitability and efficient cost structure make it a clear fundamental winner. Aptiv’s profile suits investors focused on turnaround potential rather than current profitability.
Financial Ratios Comparison
These vital ratios act as a diagnostic tool to expose the underlying fiscal health, valuation premiums, and capital efficiency of the companies compared below:
| Ratios | O’Reilly Automotive, Inc. (ORLY) | Aptiv PLC (APTV) |
|---|---|---|
| ROE | 0% (2025 est.) | 1.79% (2025 est.) |
| ROIC | 36.3% (2024 est.) | 1.32% (2025 est.) |
| P/E | 30.6x (2025 est.) | 101.8x (2025 est.) |
| P/B | N/A (negative book value) | 1.82x (2025 est.) |
| Current Ratio | 0.71 (2024) | 1.74 (2025) |
| Quick Ratio | 0.09 (2024) | 1.23 (2025) |
| D/E | N/A (negative equity) | 0.86 (2025) |
| Debt-to-Assets | 53.2% (2024) | 33.96% (2025) |
| Interest Coverage | 14.6x (2024) | 3.28x (2025) |
| Asset Turnover | 1.12 (2024) | 0.87 (2025) |
| Fixed Asset Turnover | 2.11 (2024) | 4.77 (2025) |
| Payout ratio | 0% (2025) | 3.6% (2025) |
| Dividend yield | 0% (2025) | 0.036% (2025) |
| Fiscal Year | 2025 | 2025 |
Efficiency & Valuation Duel: The Vital Signs
Financial ratios act as a company’s DNA, exposing hidden risks and operational strengths essential for investment decisions.
O’Reilly Automotive, Inc.
O’Reilly shows solid profitability with a favorable 14.27% net margin but lacks positive ROE and ROIC figures, signaling operational challenges. The stock trades at a stretched P/E of 30.6, reflecting elevated valuation. Shareholder returns rely on reinvestment rather than dividends, emphasizing growth over current payouts.
Aptiv PLC
Aptiv posts weak profitability, with a 0.81% net margin and modest ROE of 1.79%, underscoring operational inefficiencies. Its valuation is expensive, with a P/E above 100, testing investor patience. The company maintains liquidity and asset efficiency but offers minimal dividend yield, focusing on reinvestment in R&D.
Valuation Stretched vs. Operational Fragility
O’Reilly balances profitability with a high valuation but struggles with returns on equity and capital. Aptiv suffers from weak margins and sky-high valuation, despite better liquidity. Risk-tolerant investors seeking growth may prefer O’Reilly’s profile, while cautious investors might find Aptiv’s operational weaknesses a concern.
Which one offers the Superior Shareholder Reward?
I compare O’Reilly Automotive (ORLY) and Aptiv PLC (APTV) on dividends, payout ratios, and buybacks. ORLY pays no dividends but has a robust free cash flow of $2.3/share and a strong buyback capacity, supporting long-term growth. APTV offers a modest dividend yield (~0.04%) with a low payout ratio (~3.6%), signaling room for growth reinvestment. Aptiv’s buyback activity is less prominent but its lower price-to-free-cash-flow ratio (~11) versus ORLY’s (~49) suggests better valuation. I view ORLY’s conservative no-dividend, high free cash flow strategy combined with steady buybacks as more sustainable and rewarding for shareholders in 2026.
Comparative Score Analysis: The Strategic Profile
The radar chart reveals the fundamental DNA and trade-offs of O’Reilly Automotive and Aptiv PLC, highlighting their distinctive financial strengths and weaknesses:
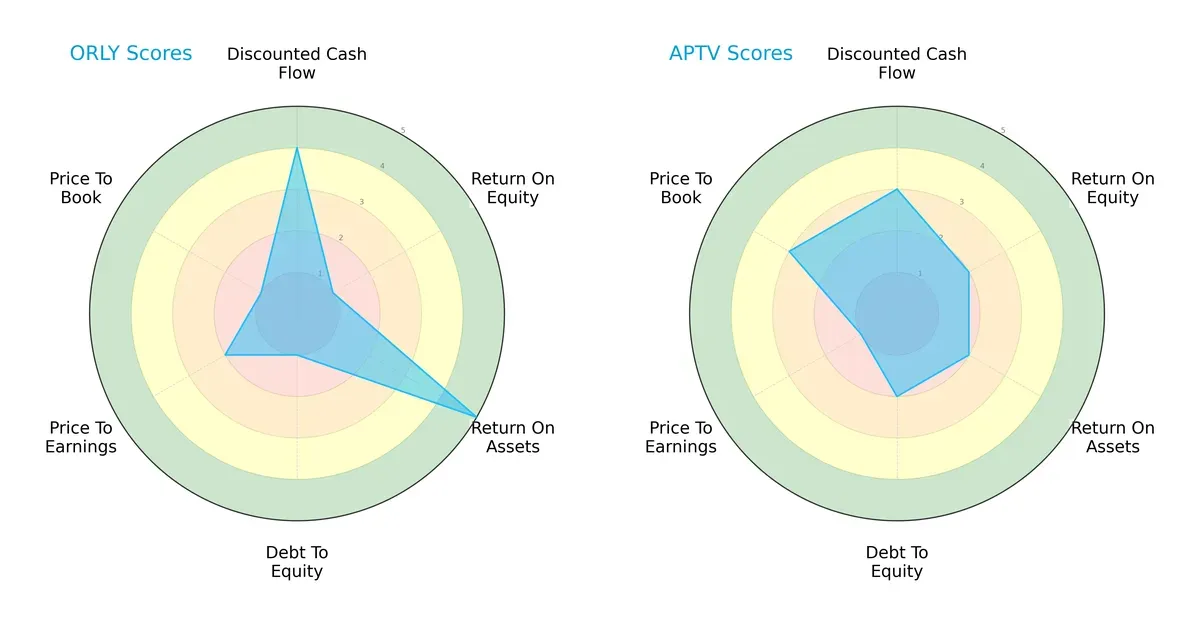
O’Reilly Automotive excels in asset efficiency (ROA score 5) and discounted cash flow (DCF score 4), but struggles with equity returns (ROE score 1) and high leverage risk (Debt/Equity score 1). Aptiv PLC presents a more balanced profile, with moderate DCF (3), ROE (2), and Debt/Equity (2) scores, though it lags in asset utilization (ROA score 2) and valuation metrics. O’Reilly relies heavily on asset productivity, while Aptiv shows steadier, though less pronounced, financial metrics.
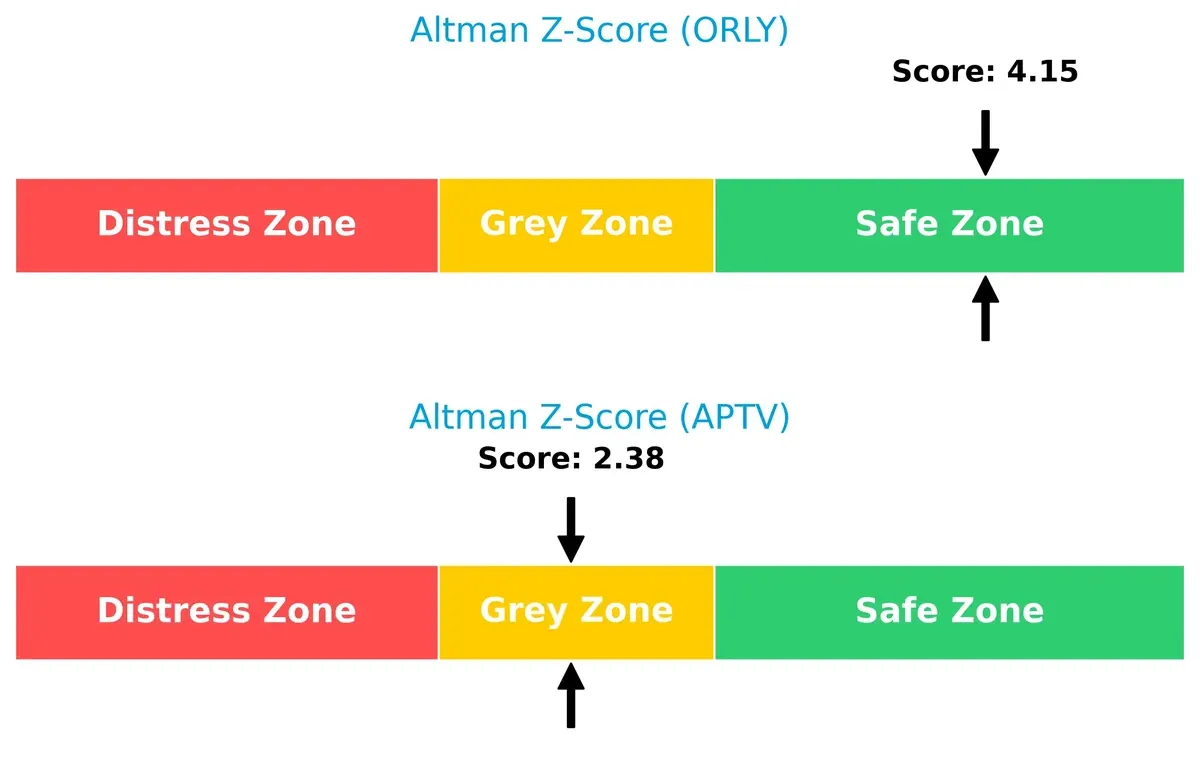
Bankruptcy Risk: Solvency Showdown
O’Reilly Automotive’s Altman Z-Score of 4.15 places it firmly in the safe zone, signaling strong long-term solvency. Aptiv’s score of 2.38 lands in the grey zone, implying moderate bankruptcy risk in this economic cycle:
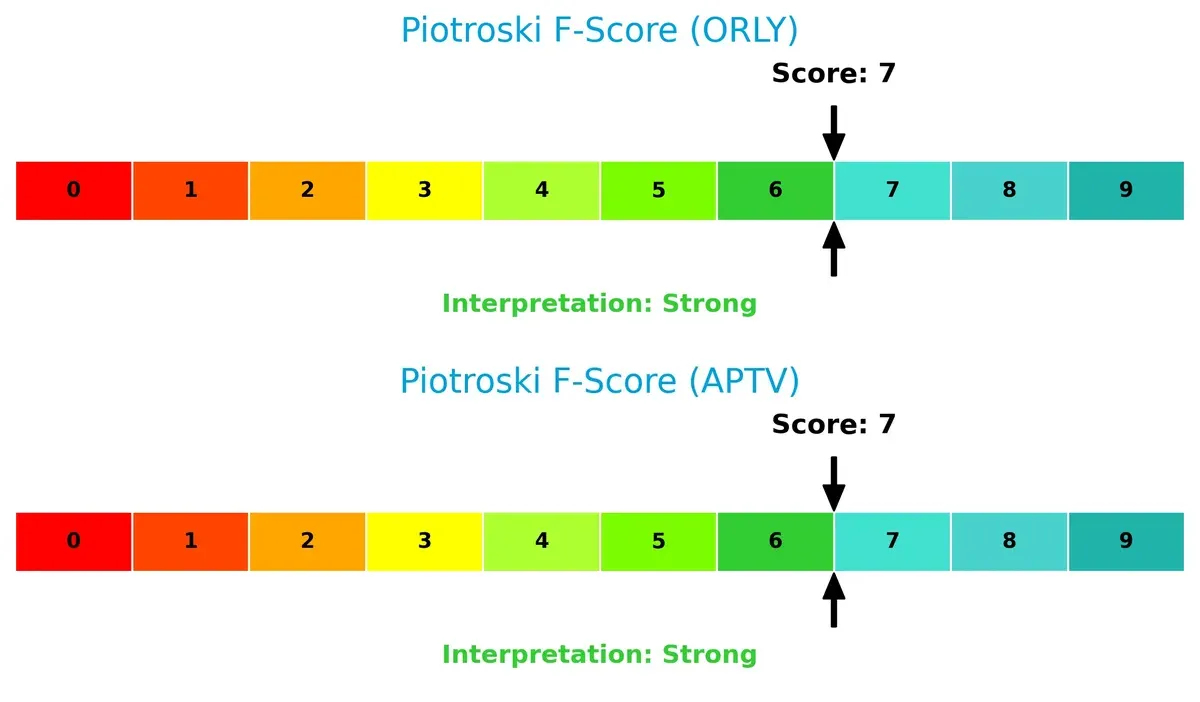
Financial Health: Quality of Operations
Both companies post solid Piotroski F-Scores of 7, indicating strong operational quality and financial health. Neither shows immediate red flags in internal metrics, but investors should monitor Aptiv’s middling solvency alongside this strength:
How are the two companies positioned?
This section dissects ORLY and APTV’s operational DNA by comparing revenue distribution and internal strengths and weaknesses. The goal is to confront their economic moats and identify which model offers the most resilient competitive advantage today.
Revenue Segmentation: The Strategic Mix
This visual comparison dissects how O’Reilly Automotive and Aptiv PLC diversify their income streams and highlights their primary sector bets:
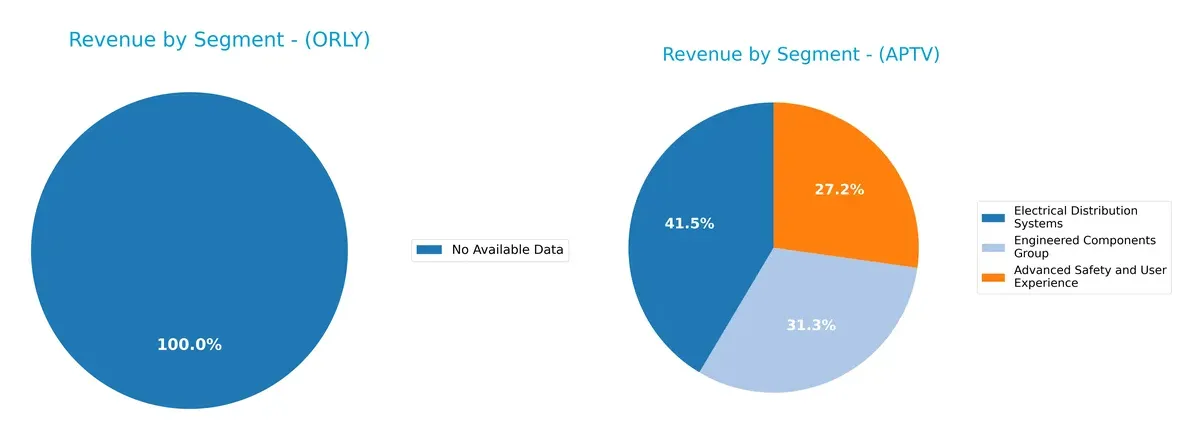
O’Reilly Automotive lacks available revenue segmentation data, limiting direct comparison. Aptiv PLC shows a diversified mix with key segments: Electrical Distribution Systems at $8.8B, Engineered Components at $6.7B, and Advanced Safety at $5.8B in 2025. Aptiv pivots on multiple strong pillars, reducing concentration risk and building an ecosystem lock-in across automotive technology layers. This breadth contrasts with O’Reilly’s unknown segmentation, which may imply reliance on fewer segments or data opacity.
Strengths and Weaknesses Comparison
This table compares the Strengths and Weaknesses of O’Reilly Automotive, Inc. and Aptiv PLC:
O’Reilly Automotive, Inc. Strengths
- Favorable net margin at 14.27%
- Strong interest coverage ratio at 14.72
- Low debt to equity and debt to assets ratios indicate financial prudence
Aptiv PLC Strengths
- Diverse product segments generating multi-billion revenues
- Global presence across key regions including Asia Pacific and Europe
- Favorable fixed asset turnover at 4.77
O’Reilly Automotive, Inc. Weaknesses
- Unfavorable return on equity and invested capital at 0%
- Poor liquidity ratios with current and quick ratios at 0
- Unfavorable asset turnover and fixed asset turnover
- High price-to-earnings ratio at 30.6
Aptiv PLC Weaknesses
- Low net margin at 0.81% and low ROE/ROIC below 2%
- High price-to-earnings ratio at 101.8
- Neutral to unfavorable debt levels and interest coverage at 3.44
- Minimal dividend yield at 0.04%
O’Reilly Automotive shows strength in profitability and conservative leverage but suffers from poor liquidity and asset efficiency. Aptiv displays strong diversification and global reach but faces challenges in profitability and valuation metrics. These contrasts highlight differing strategic focuses and operational efficiencies.
The Moat Duel: Analyzing Competitive Defensibility
A structural moat is the only shield preserving a company’s long-term profits from relentless competition erosion:
O’Reilly Automotive, Inc.: Durable Switching Costs
O’Reilly’s moat stems from strong switching costs tied to its vast store network and customer loyalty. This manifests in stable margins above 19% EBIT. New service offerings could deepen this edge in 2026.
Aptiv PLC: Innovation-Driven Technology Edge
Aptiv’s moat relies on advanced safety tech and vehicle connectivity, contrasting O’Reilly’s retail focus. However, declining ROIC signals weakening value creation. Growth in autonomous systems offers potential upside.
Retail Loyalty vs. Technology Innovation: Who Holds the Moat?
O’Reilly shows a wider moat with stable, favorable income margins and customer lock-in. Aptiv’s technological moat is promising but currently undermined by value destruction. O’Reilly is better poised to defend its market share in 2026.
Which stock offers better returns?
The past year shows clear bullish trends for both stocks, with O’Reilly Automotive’s price growth decelerating recently while Aptiv accelerates. Trading volumes reveal contrasting buyer-seller dynamics over the same period.
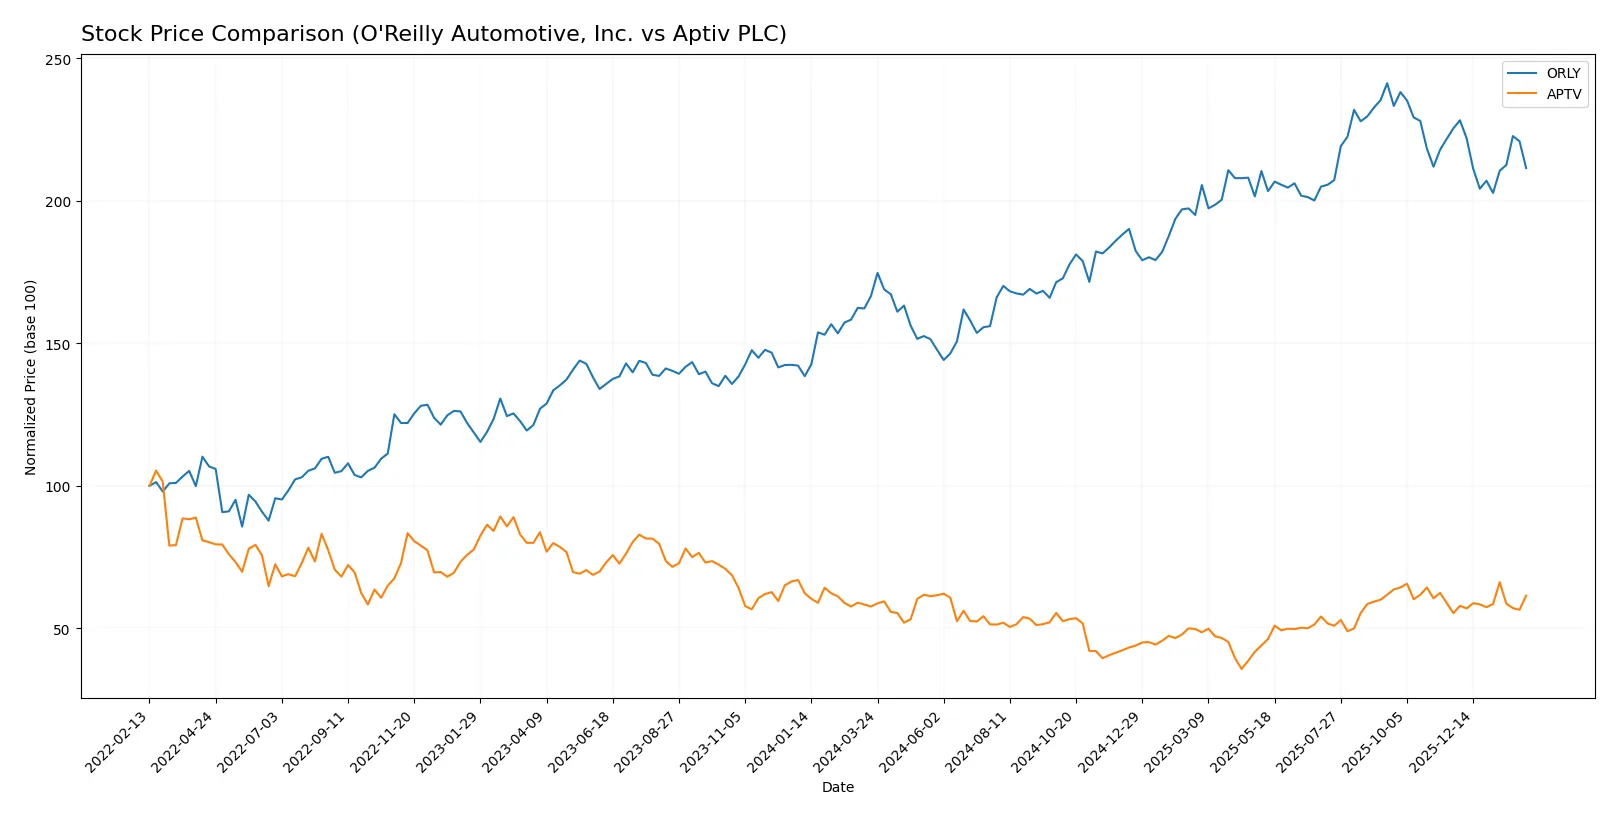
Trend Comparison
O’Reilly Automotive’s stock rose 27% over the past year, marking a bullish trend with decelerating momentum. It peaked at 107.5 and troughed at 64.22, showing moderate volatility (std dev 11.43).
Aptiv’s stock increased 6.7% in the same period, also bullish but with accelerating momentum. It hit a high of 88.67 and a low of 47.92, showing less volatility (std dev 9.13).
O’Reilly Automotive delivered the highest market performance, outperforming Aptiv by roughly 20 percentage points over the past year.
Target Prices
Analysts present a moderately bullish consensus for both O’Reilly Automotive and Aptiv PLC.
| Company | Target Low | Target High | Consensus |
|---|---|---|---|
| O’Reilly Automotive, Inc. | 91 | 121 | 108.77 |
| Aptiv PLC | 84 | 110 | 98.89 |
O’Reilly’s consensus target exceeds its current price of 94.22 by about 15%. Aptiv’s target consensus stands roughly 20% above its current 82.38 price, signaling room for appreciation.

Don’t Let Luck Decide Your Entry Point
Optimize your entry points with our advanced ProRealTime indicators. You’ll get efficient buy signals with precise price targets for maximum performance. Start outperforming now!
How do institutions grade them?
O’Reilly Automotive, Inc. Grades
The following table summarizes recent grades from major institutions for O’Reilly Automotive, Inc.:
| Grading Company | Action | New Grade | Date |
|---|---|---|---|
| DA Davidson | Maintain | Buy | 2026-02-06 |
| JP Morgan | Maintain | Overweight | 2026-02-06 |
| Truist Securities | Maintain | Buy | 2026-02-06 |
| RBC Capital | Maintain | Outperform | 2026-02-06 |
| Mizuho | Maintain | Outperform | 2026-02-06 |
| DA Davidson | Maintain | Buy | 2026-02-05 |
| DA Davidson | Maintain | Buy | 2026-02-03 |
| RBC Capital | Maintain | Outperform | 2026-01-30 |
| Morgan Stanley | Maintain | Overweight | 2026-01-15 |
| Evercore ISI Group | Maintain | Outperform | 2025-12-16 |
Aptiv PLC Grades
The following table summarizes recent grades from major institutions for Aptiv PLC:
| Grading Company | Action | New Grade | Date |
|---|---|---|---|
| Wells Fargo | Maintain | Overweight | 2026-02-03 |
| RBC Capital | Maintain | Outperform | 2026-02-03 |
| Oppenheimer | Maintain | Outperform | 2026-02-03 |
| Oppenheimer | Maintain | Outperform | 2026-01-21 |
| UBS | Maintain | Neutral | 2026-01-14 |
| Piper Sandler | Upgrade | Overweight | 2026-01-08 |
| Wells Fargo | Maintain | Overweight | 2025-12-09 |
| Morgan Stanley | Upgrade | Equal Weight | 2025-12-08 |
| RBC Capital | Maintain | Outperform | 2025-11-19 |
| Wells Fargo | Maintain | Overweight | 2025-10-31 |
Which company has the best grades?
O’Reilly Automotive holds consistently high grades, primarily Buy and Outperform, from top firms. Aptiv shows more variability, with several Outperform ratings but also Neutral and Equal Weight. O’Reilly’s steadier, stronger grades suggest greater analyst confidence, which may influence investor sentiment toward stability and growth.
Risks specific to each company
The following categories identify the critical pressure points and systemic threats facing both firms in the 2026 market environment:
1. Market & Competition
O’Reilly Automotive, Inc.
- Strong US aftermarket presence but faces intense competition from online and big-box retailers.
Aptiv PLC
- Global electrical and safety tech exposure increases competition from traditional and tech-driven suppliers.
2. Capital Structure & Debt
O’Reilly Automotive, Inc.
- Favorable debt ratios and strong interest coverage support financial stability.
Aptiv PLC
- Moderate leverage with neutral debt ratios and interest coverage signals balanced but watchful risk.
3. Stock Volatility
O’Reilly Automotive, Inc.
- Low beta (0.62) indicates lower volatility relative to the market, favoring risk-averse investors.
Aptiv PLC
- High beta (1.5) suggests greater sensitivity to market swings and higher volatility risk.
4. Regulatory & Legal
O’Reilly Automotive, Inc.
- Mostly US-focused, subject to domestic automotive aftermarket regulations.
Aptiv PLC
- Operates globally with exposure to complex international automotive and tech regulations.
5. Supply Chain & Operations
O’Reilly Automotive, Inc.
- Robust US distribution network but reliant on stable domestic supply chains.
Aptiv PLC
- Complex global supply chains increase vulnerability to disruptions and component shortages.
6. ESG & Climate Transition
O’Reilly Automotive, Inc.
- Limited direct exposure to climate tech but under pressure to improve sustainability in operations.
Aptiv PLC
- Strong focus on advanced safety and electrification aligns with climate transition trends.
7. Geopolitical Exposure
O’Reilly Automotive, Inc.
- Primarily US and Mexico operations limit geopolitical risk but expose to North American trade policies.
Aptiv PLC
- Global footprint including Europe and Asia increases exposure to geopolitical tensions and trade barriers.
Which company shows a better risk-adjusted profile?
O’Reilly’s most significant risk is market competition amid evolving retail trends, yet it benefits from a strong balance sheet and low stock volatility. Aptiv faces heightened risks from geopolitical exposure and high market volatility, compounded by weaker profitability metrics. O’Reilly’s Altman Z-Score in the safe zone versus Aptiv’s grey zone confirms a stronger risk-adjusted profile. Notably, Aptiv’s higher beta (1.5) signals amplified market sensitivity, underscoring my caution on its risk stance relative to O’Reilly’s steadier profile.
Final Verdict: Which stock to choose?
O’Reilly Automotive’s superpower lies in its robust cash generation and operational efficiency. It consistently delivers strong margins and maintains a favorable income quality despite some concerns around liquidity ratios. This stock suits portfolios seeking steady, aggressive growth with a focus on operational resilience.
Aptiv’s strategic moat centers on its innovative technology and recurring revenue streams in automotive components. It offers comparatively better liquidity and balance sheet safety than O’Reilly. Aptiv fits well in GARP portfolios aiming to balance growth potential with cautious capital management.
If you prioritize operational efficiency and cash flow strength, O’Reilly Automotive is the compelling choice due to its proven margin performance and solid income quality. However, if you seek technological innovation with a safer liquidity profile, Aptiv offers better stability despite its challenged profitability. Both present distinct analytical scenarios aligned with different investor profiles.
Disclaimer: Investment carries a risk of loss of initial capital. The past performance is not a reliable indicator of future results. Be sure to understand risks before making an investment decision.
Go Further
I encourage you to read the complete analyses of O’Reilly Automotive, Inc. and Aptiv PLC to enhance your investment decisions: