Home > Comparison > Consumer Cyclical > AZO vs APTV
The strategic rivalry between AutoZone, Inc. and Aptiv PLC shapes the future of the automotive parts sector. AutoZone dominates as a capital-intensive retailer specializing in replacement parts and accessories. In contrast, Aptiv leads as a high-tech manufacturer focusing on electrical and safety vehicle components. This head-to-head pits traditional retail strength against innovation-driven growth. This analysis aims to identify which corporate path offers superior risk-adjusted returns for a diversified portfolio in 2026.
Table of contents
Companies Overview
AutoZone and Aptiv stand as pivotal players shaping the auto parts industry’s evolution.
AutoZone, Inc.: Dominant Auto Parts Retailer
AutoZone commands the retail and distribution of automotive replacement parts across North America. It generates revenue by selling a vast inventory, from hard parts to accessories and maintenance products, through 6,785 stores. In 2026, it focuses on expanding its commercial credit and delivery services, leveraging its extensive physical footprint to sustain market leadership.
Aptiv PLC: Innovator in Automotive Electrical Systems
Aptiv specializes in designing and manufacturing advanced electrical and safety components for vehicles worldwide. Its revenue stems from two segments: Signal and Power Solutions and Advanced Safety and User Experience. In 2026, Aptiv prioritizes innovation in autonomous driving technologies and software integration, aiming to enhance vehicle connectivity and safety systems.
Strategic Collision: Similarities & Divergences
Both companies operate in the auto parts sector but diverge sharply in business models. AutoZone excels in a physical retail model focused on replacement parts, while Aptiv pursues a technology-driven approach embedded in vehicle architecture. Their battleground lies in serving evolving automotive needs—aftermarket retail versus integrated vehicle systems. These distinctions define contrasting investment profiles: steady retail dominance versus growth in high-tech automotive solutions.
Income Statement Comparison
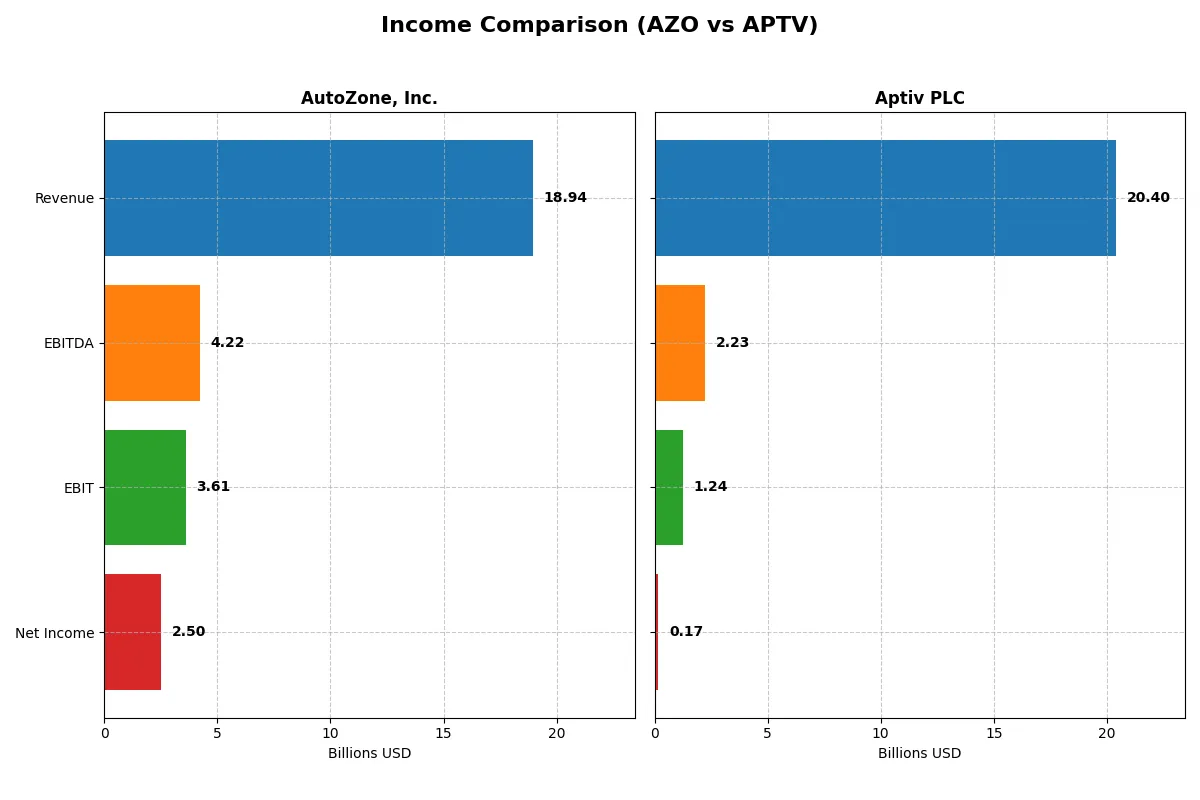
The following data dissects the core profitability and scalability of both corporate engines to reveal who dominates the bottom line:
| Metric | AutoZone, Inc. (AZO) | Aptiv PLC (APTV) |
|---|---|---|
| Revenue | 18.9B | 20.4B |
| Cost of Revenue | 8.97B | 16.5B |
| Operating Expenses | 6.36B | 2.71B |
| Gross Profit | 9.97B | 3.90B |
| EBITDA | 4.22B | 2.23B |
| EBIT | 3.61B | 1.24B |
| Interest Expense | 487M | 361M |
| Net Income | 2.50B | 165M |
| EPS | 148.8 | 0.75 |
| Fiscal Year | 2025 | 2025 |
Income Statement Analysis: The Bottom-Line Duel
The income statement comparison reveals the true operational efficiency and profitability trends of two major automotive suppliers over recent years.
AutoZone, Inc. Analysis
AutoZone posted steady revenue growth from $14.6B in 2021 to $18.9B in 2025, showing a 29.45% increase overall. Net income rose 15.11% to $2.5B in 2025, although 2025 saw a 3.13% EPS decline and a slight dip in EBIT margin to 19.06%. Gross margin remains strong at 52.62%, underscoring efficient cost control despite slowing momentum.
Aptiv PLC Analysis
Aptiv increased revenue from $15.6B in 2021 to $20.4B in 2025, a 30.61% rise, but net income plunged 72.03% to $165M in 2025. Gross margin at 19.11% and EBIT margin at 6.09% reflect thin profitability. The latest year showed a sharp EBIT drop of 50.08% and net margin collapse to 0.81%, indicating major earnings pressure despite modest top-line growth.
Margin Strength vs. Earnings Volatility
AutoZone exhibits superior margin health and consistent profitability with a favorable income statement profile, while Aptiv struggles with volatile earnings and weak net margins. AutoZone’s resilient cash generation and solid returns make it the clearer fundamental winner. Investors seeking stable earnings and margin durability will find AutoZone’s profile more attractive.
Financial Ratios Comparison
These vital ratios act as a diagnostic tool to expose the underlying fiscal health, valuation premiums, and capital efficiency of the companies compared below:
| Ratios | AutoZone, Inc. (AZO) | Aptiv PLC (APTV) |
|---|---|---|
| ROE | -73.2% | 1.8% |
| ROIC | 28.1% | 1.3% |
| P/E | 28.2 | 101.8 |
| P/B | -20.6 | 1.82 |
| Current Ratio | 0.88 | 1.74 |
| Quick Ratio | 0.14 | 1.23 |
| D/E | -3.60 | 0.86 |
| Debt-to-Assets | 63.5% | 34.0% |
| Interest Coverage | 7.4 | 3.3 |
| Asset Turnover | 0.98 | 0.87 |
| Fixed Asset Turnover | 1.85 | 4.77 |
| Payout Ratio | 0 | 3.6% |
| Dividend Yield | 0 | 0.04% |
| Fiscal Year | 2025 | 2025 |
Efficiency & Valuation Duel: The Vital Signs
Ratios act as a company’s DNA, uncovering hidden risks and operational strengths that raw numbers alone cannot reveal.
AutoZone, Inc.
AutoZone displays strong operational efficiency with a robust ROIC of 28.13% against a low WACC of 5.27%, signaling value creation. However, its negative ROE of -73.17% and a stretched P/E of 28.22 suggest valuation challenges. The firm reinvests earnings rather than paying dividends, focusing on long-term growth.
Aptiv PLC
Aptiv struggles with profitability, showing a weak ROIC of 1.32% and a slim net margin of 0.81%. Its P/E ratio of 101.8 indicates an expensive stock relative to earnings. Aptiv maintains solid liquidity ratios and reinvests cash flow aggressively into R&D, prioritizing innovation over shareholder payouts.
Premium Valuation vs. Operational Safety
AutoZone offers superior operational returns but faces valuation and equity return concerns, while Aptiv’s high valuation contrasts with weak profitability but healthier liquidity. Investors seeking operational strength may prefer AutoZone, whereas those favoring liquidity and innovation might lean toward Aptiv’s profile.
Which one offers the Superior Shareholder Reward?
I observe that AutoZone (AZO) pays no dividends but generates robust free cash flow of 106/share, fueling aggressive buybacks that enhance shareholder value. Aptiv (APTV) offers a modest dividend yield near 0.04% with a low payout ratio but also repurchases shares steadily. AZO’s zero payout ratio and high buyback intensity signal a capital allocation strategy focused on long-term growth and shareholder reward. Meanwhile, APTV balances dividends and buybacks but yields limited cash flow per share (7/share). Given AZO’s superior free cash flow coverage and buyback scale, I conclude AZO offers a more attractive total return profile for 2026 investors.
Comparative Score Analysis: The Strategic Profile
The radar chart reveals the fundamental DNA and trade-offs of both firms, highlighting their competitive strengths and financial priorities:
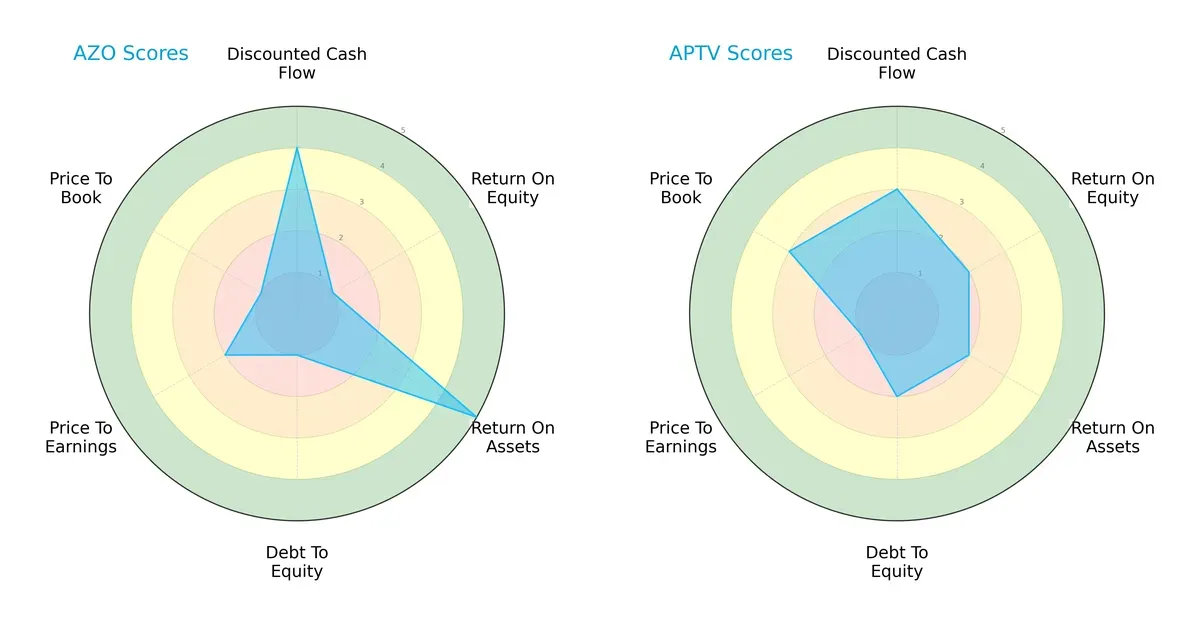
AutoZone dominates in asset efficiency with a very favorable ROA score of 5, but struggles with heavy leverage and valuation concerns, scoring very unfavorable on debt-to-equity and price-to-book. Aptiv presents a more balanced but moderate profile, scoring moderately on discounted cash flow and price-to-book, yet lagging behind AutoZone on asset utilization and financial risk. AutoZone relies on operational efficiency, while Aptiv’s edge lies in a steadier capital structure and valuation discipline.
Bankruptcy Risk: Solvency Showdown
AutoZone’s Altman Z-Score of 2.85 versus Aptiv’s 2.38 places both firms in the grey zone, indicating moderate bankruptcy risk in this market cycle:
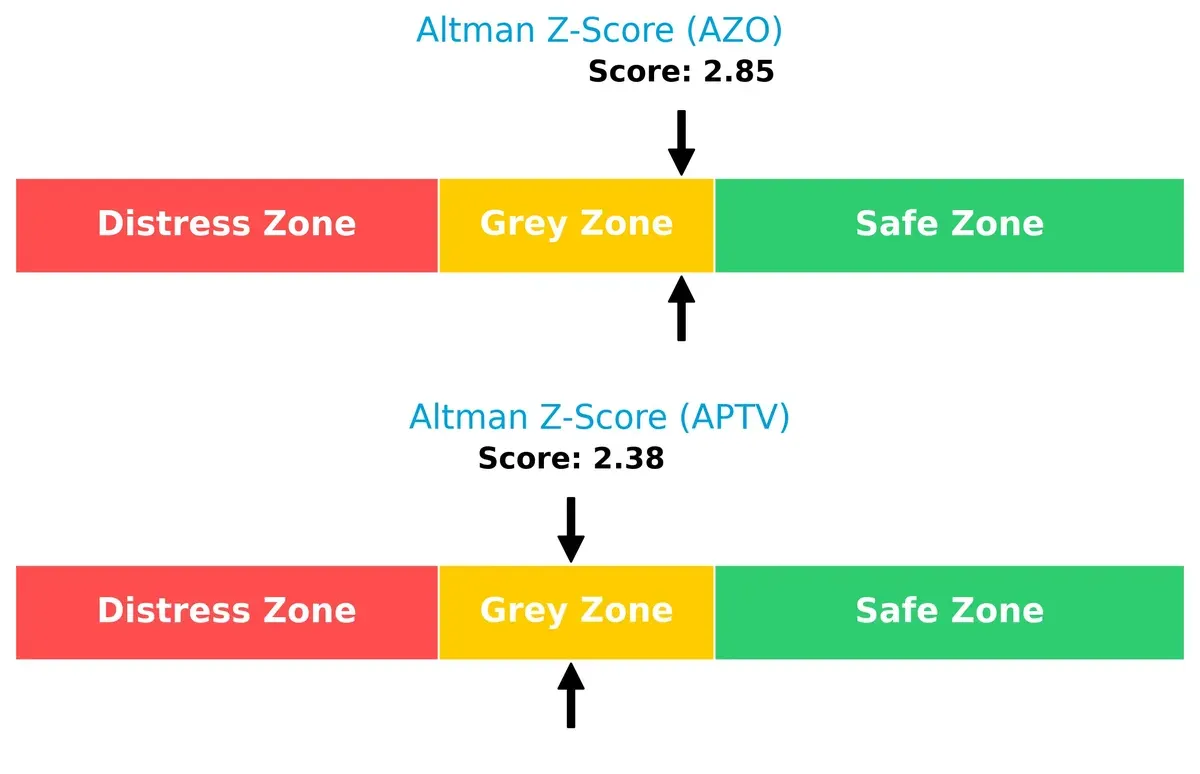
Both companies hover near the safe zone threshold of 3, but AutoZone’s slightly higher score suggests marginally better financial stability. Investors should monitor leverage and cash flow trends closely, as economic downturns could push either into distress.
Financial Health: Quality of Operations
Both AutoZone and Aptiv demonstrate strong financial health with identical Piotroski F-Scores of 7, signaling robust internal operations and no immediate red flags:
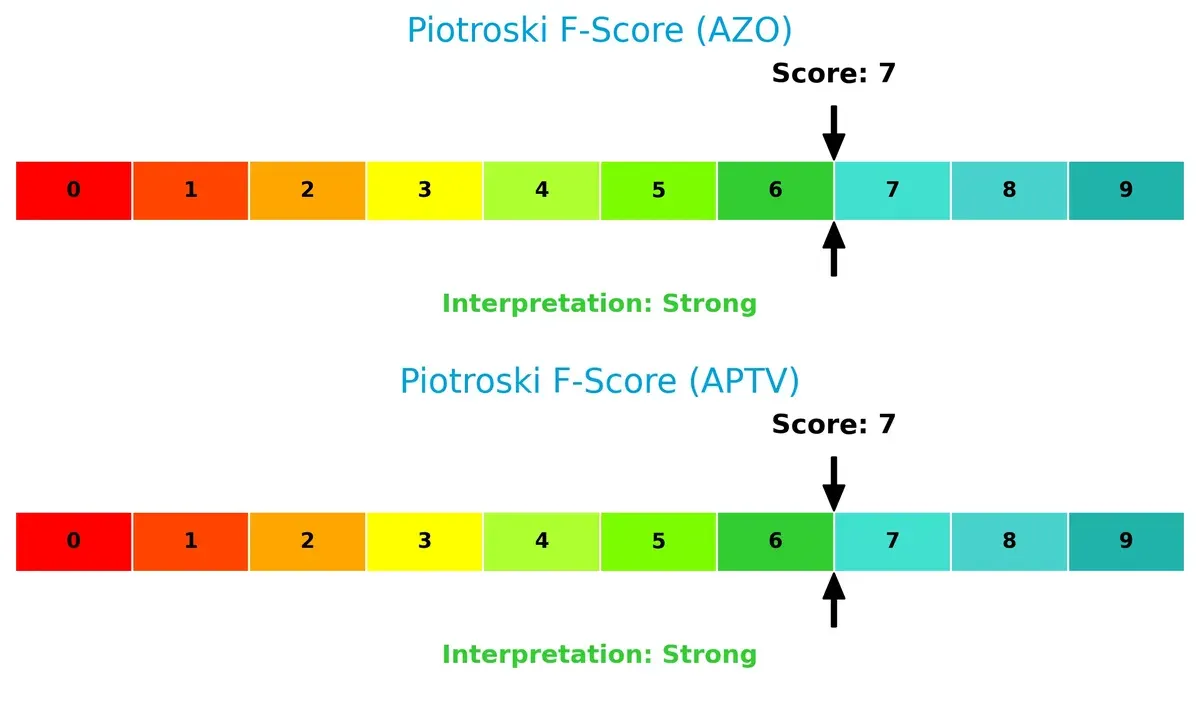
A score of 7 indicates solid profitability, liquidity, and efficiency metrics. Neither firm shows alarming weaknesses, but continued vigilance is warranted to maintain this level of operational quality amid sector volatility.
How are the two companies positioned?
This section dissects the operational DNA of AutoZone and Aptiv by comparing their revenue distribution by segment alongside their internal strengths and weaknesses. The goal is to confront their economic moats and identify which model offers the most resilient, sustainable competitive advantage today.
Revenue Segmentation: The Strategic Mix
This visual comparison dissects how AutoZone and Aptiv diversify their income streams and where their primary sector bets lie:
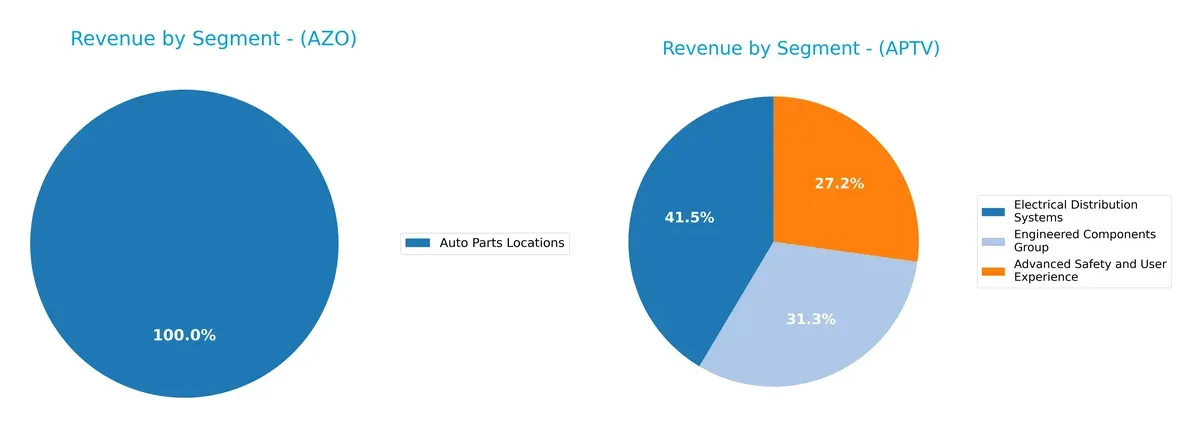
AutoZone anchors nearly all revenue in its Auto Parts segment, generating $18.9B in 2025 with minimal contribution from other segments. Aptiv, by contrast, boasts a well-diversified mix: $8.8B in Electrical Distribution, $6.7B in Engineered Components, and $5.8B in Advanced Safety. AutoZone’s concentration risks supply-chain shocks, while Aptiv’s broad exposure supports resilience and innovation leadership in automotive tech ecosystems.
Strengths and Weaknesses Comparison
This table compares the strengths and weaknesses of AutoZone, Inc. and Aptiv PLC:
AutoZone Strengths
- Strong profitability with 13.19% net margin
- High ROIC at 28.13% exceeding cost of capital
- Large US market share with $16.7B revenue
- Solid interest coverage at 7.42 times
Aptiv Strengths
- Diversified product segments with $5.8B to $8.8B revenues
- Balanced global presence across multiple regions
- Favorable fixed asset turnover of 4.77 times
- Healthy liquidity ratios with 1.74 current ratio
AutoZone Weaknesses
- Negative ROE at -73.17% signals poor equity returns
- Weak liquidity with current ratio 0.88 and quick ratio 0.14
- High debt-to-assets ratio at 63.49% raises leverage concerns
- No dividend yield may deter income investors
Aptiv Weaknesses
- Low profitability with net margin 0.81% and ROIC 1.32%
- Elevated P/E ratio at 101.8 indicates expensive valuation
- Moderate interest coverage at 3.44 times
- Slightly unfavorable overall financial ratios
AutoZone exhibits strong profitability and capital efficiency but shows liquidity and leverage risks. Aptiv offers diversification and global reach but faces profitability and valuation challenges. These contrasts shape each company’s strategic positioning and risk profile.
The Moat Duel: Analyzing Competitive Defensibility
A structural moat protects long-term profits from relentless competition erosion. Let’s examine how AutoZone and Aptiv defend their turf:
AutoZone, Inc.: Switching Costs and Scale Advantage
AutoZone leverages strong switching costs in auto parts retail, reflected in a robust 52.6% gross margin and 13.2% net margin. Its 6,700 stores create scale economies. Despite slightly declining ROIC, new digital services and expansion in Mexico may deepen its moat in 2026.
Aptiv PLC: Innovation-Driven Technological Moat
Aptiv’s moat stems from advanced safety tech and complex electronic systems, unlike AutoZone’s retail focus. Its lower margins (19.1% gross, 0.8% net) and negative ROIC-WACC spread reveal value erosion. However, growth in autonomous driving tech could disrupt markets and revive the moat.
Retail Scale vs. Tech Innovation: Who Holds the Moat Edge?
AutoZone’s wider moat rests on durable switching costs and scale, enabling steadier value creation despite margin pressures. Aptiv’s tech moat is narrower and currently under strain, making AutoZone better positioned to defend market share into 2026.
Which stock offers better returns?
The past year shows contrasting price dynamics between AutoZone, Inc. and Aptiv PLC, highlighting differing momentum and market responses.
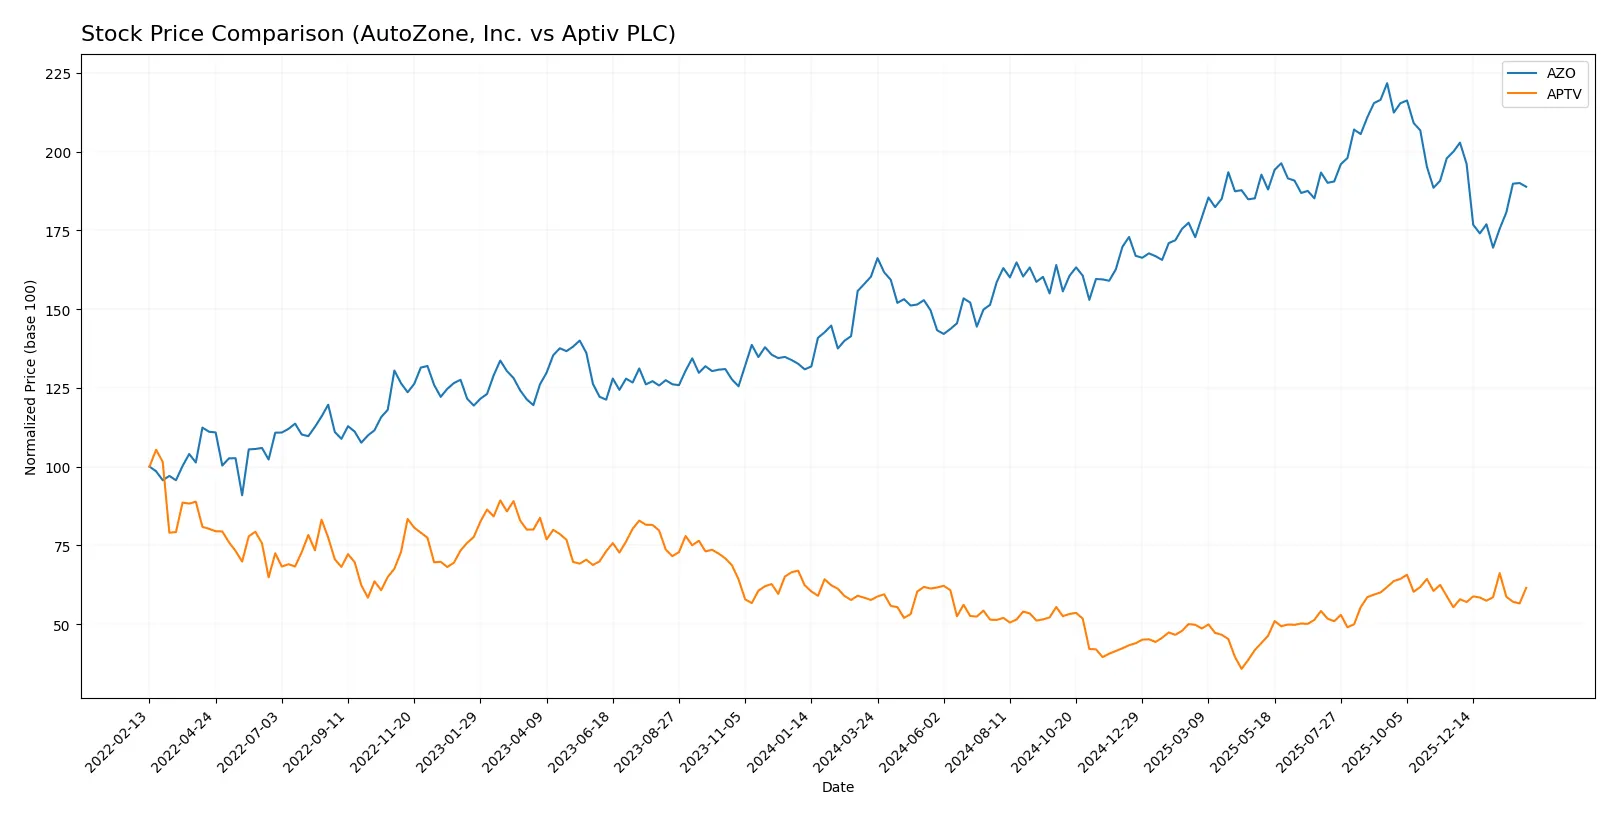
Trend Comparison
AutoZone, Inc. posts a 17.83% gain over 12 months, signaling a bullish trend with decelerating momentum and substantial volatility. The stock peaked near 4,322 and bottomed close to 2,770.
Aptiv PLC records a 6.65% rise over the same period, maintaining a bullish trend with accelerating momentum and very low volatility. Its price fluctuated between 47.92 and 88.67.
AutoZone’s performance outpaces Aptiv’s, delivering stronger annual gains despite recent short-term weakness, positioning it as the higher market performer.
Target Prices
Analysts present a confident target consensus for AutoZone, Inc. and Aptiv PLC, reflecting positive outlooks relative to current prices.
| Company | Target Low | Target High | Consensus |
|---|---|---|---|
| AutoZone, Inc. | 3,550 | 4,800 | 4,336.8 |
| Aptiv PLC | 84 | 110 | 98.89 |
AutoZone’s target consensus sits about 18% above its current price of 3,681, signaling strong growth expectations. Aptiv’s consensus target is roughly 20% higher than its 82.38 price, reflecting optimism despite recent volatility.

Don’t Let Luck Decide Your Entry Point
Optimize your entry points with our advanced ProRealTime indicators. You’ll get efficient buy signals with precise price targets for maximum performance. Start outperforming now!
How do institutions grade them?
The following tables summarize recent institutional grades for AutoZone, Inc. and Aptiv PLC:
AutoZone, Inc. Grades
This table lists recent ratings from key financial institutions on AutoZone shares.
| Grading Company | Action | New Grade | Date |
|---|---|---|---|
| Morgan Stanley | Maintain | Overweight | 2026-01-15 |
| Barclays | Maintain | Overweight | 2026-01-08 |
| Mizuho | Downgrade | Neutral | 2026-01-05 |
| JP Morgan | Maintain | Overweight | 2025-12-18 |
| Wolfe Research | Downgrade | Peer Perform | 2025-12-16 |
| Citigroup | Maintain | Buy | 2025-12-11 |
| Guggenheim | Maintain | Buy | 2025-12-10 |
| BMO Capital | Maintain | Outperform | 2025-12-10 |
| UBS | Maintain | Buy | 2025-12-10 |
| Truist Securities | Maintain | Buy | 2025-12-10 |
Aptiv PLC Grades
The table below presents recent grades from reputable analysts on Aptiv’s stock.
| Grading Company | Action | New Grade | Date |
|---|---|---|---|
| Wells Fargo | Maintain | Overweight | 2026-02-03 |
| RBC Capital | Maintain | Outperform | 2026-02-03 |
| Oppenheimer | Maintain | Outperform | 2026-02-03 |
| Oppenheimer | Maintain | Outperform | 2026-01-21 |
| UBS | Maintain | Neutral | 2026-01-14 |
| Piper Sandler | Upgrade | Overweight | 2026-01-08 |
| Wells Fargo | Maintain | Overweight | 2025-12-09 |
| Morgan Stanley | Upgrade | Equal Weight | 2025-12-08 |
| RBC Capital | Maintain | Outperform | 2025-11-19 |
| Wells Fargo | Maintain | Overweight | 2025-10-31 |
Which company has the best grades?
AutoZone exhibits a concentration of Buy and Overweight ratings, though some downgrades to Neutral and Peer Perform exist. Aptiv shows consistent Overweight and Outperform grades, with recent upgrades. Aptiv’s slightly stronger consensus could appeal to investors seeking positive momentum, while AutoZone’s mixed signals suggest cautious optimism.
Risks specific to each company
The following risk categories highlight critical pressure points and systemic threats facing both firms in the 2026 market environment:
1. Market & Competition
AutoZone, Inc.
- Strong brand in retail auto parts with 6,785 stores in North America; faces intense competition from e-commerce and aftermarket disruptors.
Aptiv PLC
- Operates in advanced vehicle components with exposure to evolving automotive tech; faces competition from global suppliers and rapid innovation cycles.
2. Capital Structure & Debt
AutoZone, Inc.
- High debt-to-assets ratio at 63.5% signals leverage risk despite good interest coverage of 7.4x.
Aptiv PLC
- Moderate leverage with 34% debt-to-assets; interest coverage is moderate at 3.4x, indicating manageable but cautious debt levels.
3. Stock Volatility
AutoZone, Inc.
- Low beta at 0.41 suggests defensive stock behavior with less sensitivity to market swings.
Aptiv PLC
- High beta at 1.5 indicates elevated volatility and higher market risk.
4. Regulatory & Legal
AutoZone, Inc.
- US-based exposure with typical retail regulatory risks; limited international legal complexity.
Aptiv PLC
- Global footprint with regulatory exposure in multiple jurisdictions, especially EU and US automotive safety standards.
5. Supply Chain & Operations
AutoZone, Inc.
- Large physical store network dependent on stable supply chains; disruption risks from logistics and inventory management.
Aptiv PLC
- Complex global supply chain for advanced components; vulnerable to semiconductor shortages and component delays.
6. ESG & Climate Transition
AutoZone, Inc.
- Consumer goods focus with moderate ESG risk; climate transition impact limited but rising consumer and regulatory pressures.
Aptiv PLC
- High ESG risk from manufacturing footprint and technology shifts towards electric and autonomous vehicles.
7. Geopolitical Exposure
AutoZone, Inc.
- Primarily US and Mexico operations limit geopolitical risk, though Mexico exposure entails some trade policy uncertainty.
Aptiv PLC
- Significant global exposure including EU and Asia; geopolitical tensions could disrupt supply and sales channels.
Which company shows a better risk-adjusted profile?
AutoZone’s most impactful risk lies in its high leverage and weak liquidity ratios, raising financial stability concerns despite its defensive stock profile. Aptiv faces significant market volatility and complex geopolitical risks but manages moderate leverage and benefits from its advanced technology positioning. I view AutoZone’s risk profile as more precarious due to its aggressive debt stance, while Aptiv’s diversified footprint and operational agility present a relatively better risk-adjusted profile. Recent data showing AutoZone’s current ratio below 1.0 confirms liquidity constraints warranting caution.
Final Verdict: Which stock to choose?
AutoZone’s superpower lies in its robust capital efficiency and clear value creation. It commands a strong ROIC well above its cost of capital, signaling disciplined capital allocation. However, its weak liquidity ratios pose a point of vigilance, suggesting potential short-term funding strains. AutoZone fits well within aggressive growth portfolios seeking market leadership in retail auto parts.
Aptiv’s strategic moat centers on its advanced fixed asset utilization and stable working capital, providing operational resilience. Its higher liquidity and lower leverage offer a safer profile compared to AutoZone. Aptiv suits GARP investors aiming for steady, albeit slower, growth with a focus on balance sheet strength and innovation in automotive technologies.
If you prioritize high capital returns and aggressive expansion, AutoZone outshines Aptiv with superior value creation despite liquidity concerns. However, if you seek better stability and moderate growth with a more conservative risk posture, Aptiv offers a compelling alternative. Each company aligns with distinct investor profiles, underscoring the importance of matching strategy to stock fundamentals.
Disclaimer: Investment carries a risk of loss of initial capital. The past performance is not a reliable indicator of future results. Be sure to understand risks before making an investment decision.
Go Further
I encourage you to read the complete analyses of AutoZone, Inc. and Aptiv PLC to enhance your investment decisions: