Home > Comparison > Healthcare > COO vs ATR
The strategic rivalry between The Cooper Companies, Inc. and AptarGroup, Inc. shapes the healthcare instruments and supplies sector. Cooper operates as a diversified medical device leader focused on vision and women’s health, while AptarGroup specializes in advanced dispensing solutions across pharma and consumer markets. This analysis pits Cooper’s integrated medical model against Aptar’s material science innovation to identify which offers superior risk-adjusted returns for a diversified portfolio.
Table of contents
Companies Overview
The Cooper Companies and AptarGroup dominate critical niches within the medical instruments and supplies sector.
The Cooper Companies, Inc.: Visionary Healthcare Innovator
The Cooper Companies, Inc. leads in contact lens and women’s health markets, generating revenue through CooperVision and CooperSurgical segments. CooperVision targets optical solutions like spherical and toric lenses, while CooperSurgical focuses on family health with fertility and surgical products. In 2026, their strategic emphasis remains on expanding global reach and advancing women’s health technologies.
AptarGroup, Inc.: Dispensing and Material Science Specialist
AptarGroup, Inc. specializes in dispensing and sealing solutions across pharma, beauty, and food sectors. Its Pharma segment supports respiratory and injectable markets, while Beauty + Home and Food + Beverage segments deliver pumps and closures globally. AptarGroup’s 2026 strategy pursues innovations in recycled materials and digital therapies to enhance sustainable and tech-driven product offerings.
Strategic Collision: Similarities & Divergences
Both companies operate in healthcare but diverge sharply in focus—The Cooper Companies centers on medical devices and vision care, while AptarGroup excels in dispensing technologies and material science. Their competitive battleground lies in innovation and global distribution efficiency. Investors will note Cooper’s broader healthcare footprint contrasts with Aptar’s specialized product-driven model, defining distinct risk and growth profiles.
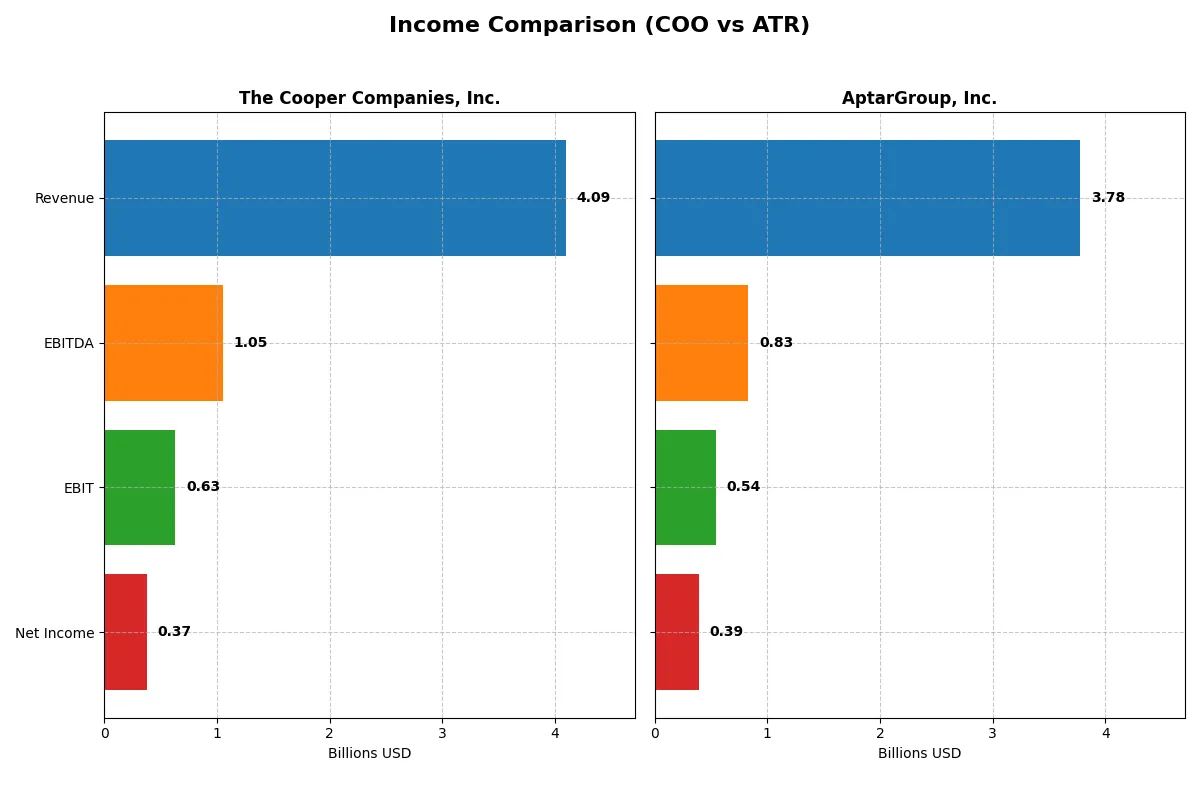
Income Statement Comparison
This data dissects the core profitability and scalability of both corporate engines to reveal who dominates the bottom line:
| Metric | The Cooper Companies, Inc. (COO) | AptarGroup, Inc. (ATR) |
|---|---|---|
| Revenue | 4.09B | 3.78B |
| Cost of Revenue | 1.61B | 2.66B |
| Operating Expenses | 1.80B | 606M |
| Gross Profit | 2.48B | 1.12B |
| EBITDA | 1.05B | 831M |
| EBIT | 630M | 544M |
| Interest Expense | 100M | 53M |
| Net Income | 375M | 393M |
| EPS | 1.88 | 5.97 |
| Fiscal Year | 2025 | 2025 |
Income Statement Analysis: The Bottom-Line Duel
This income statement comparison reveals the true efficiency and profitability dynamics driving each company’s financial engine in 2025.
The Cooper Companies, Inc. Analysis
Cooper Companies shows steady revenue growth, reaching $4.09B in 2025, up 5% from 2024. However, net income declines to $375M, indicating margin pressure. Its gross margin remains strong at 60.7%, but net margin falls to 9.2%. Operating expenses scale with revenue, yet earnings before interest and taxes (EBIT) dropped 9.5%, reflecting reduced operating momentum.
AptarGroup, Inc. Analysis
AptarGroup posts $3.78B revenue in 2025, growing 5.4% year-over-year. Net income improves to $393M, up 5%, with a net margin of 10.4%. The gross margin contracts to 29.6%, but EBIT margin holds firm at 14.4%. Operational efficiency strengthens as EBIT grows 5.9%, supported by controlled expenses and solid earnings per share gains.
Margin Resilience vs. Earnings Growth
Cooper Companies excels with a high gross margin but struggles with net income erosion and declining EBIT, signaling profit margin pressure. AptarGroup delivers more balanced growth, expanding both revenue and net income with improving operating profits. For investors, AptarGroup’s consistent earnings growth and margin stability offer a more attractive profile amid shifting efficiencies.
Financial Ratios Comparison
These vital ratios act as a diagnostic tool to expose the underlying fiscal health, valuation premiums, and capital efficiency of the companies compared below:
| Ratios | The Cooper Companies, Inc. (COO) | AptarGroup, Inc. (ATR) |
|---|---|---|
| ROE | 4.55% | 15.15% |
| ROIC | 3.98% | 10.68% |
| P/E | 37.30 | 20.41 |
| P/B | 1.70 | 0 |
| Current Ratio | 1.89 | 0 |
| Quick Ratio | 1.13 | 0 |
| D/E | 0.34 | 0 |
| Debt-to-Assets | 22.46% | 0 |
| Interest Coverage | 6.83 | -9.50 |
| Asset Turnover | 0.33 | 0 |
| Fixed Asset Turnover | 1.97 | 0 |
| Payout ratio | 0% | 30.63% |
| Dividend yield | 0% | 1.50% |
| Fiscal Year | 2025 | 2025 |
Efficiency & Valuation Duel: The Vital Signs
Financial ratios act as the company’s DNA, uncovering hidden operational strengths and risks essential to investment decisions.
The Cooper Companies, Inc.
Cooper reports a modest 4.55% ROE, signaling weak profitability, while a high P/E of 37.3 suggests the stock trades at a premium. Net margin holds steady at 9.16%. Despite no dividend yield, Cooper reinvests in R&D (4.2% of revenue), aiming for future growth. The balance sheet shows favorable liquidity and moderate leverage.
AptarGroup, Inc.
Aptar posts a stronger net margin of 10.4%, but reports zero ROE and ROIC, indicating profitability gaps or data gaps. Its P/E at 20.41 appears more reasonable versus Cooper’s stretched valuation. Aptar offers a 1.5% dividend yield, blending modest shareholder returns with a focus on consistent cash generation, although liquidity ratios remain unreported.
Premium Valuation vs. Operational Safety
Cooper’s premium valuation contrasts with Aptar’s more conservative price-to-earnings stance and modest dividend. Cooper’s reinvestment strategy suits growth seekers, while Aptar’s yield appeals to income-focused investors. Aptar currently offers a cleaner risk-reward balance, fitting those prioritizing operational safety over stretched multiples.
Which one offers the Superior Shareholder Reward?
I see The Cooper Companies, Inc. (COO) opts for zero dividend payout, favoring reinvestment and steady buybacks. AptarGroup, Inc. (ATR) pays a consistent 1.2–1.8 dividend with a 30–40% payout ratio, supplemented by moderate buybacks. COO’s zero dividends and robust reinvestment, coupled with disciplined buybacks, signal a growth-driven total return strategy. ATR’s model leans on income stability through dividends but at the cost of slower free cash flow reinvestment. In 2026, I find COO’s shareholder reward superior due to its sustainable free cash flow coverage and strategic capital allocation, promising higher long-term value despite no yield.
Comparative Score Analysis: The Strategic Profile
The radar chart reveals the fundamental DNA and trade-offs of The Cooper Companies, Inc. and AptarGroup, Inc., highlighting their strategic financial strengths and weaknesses:
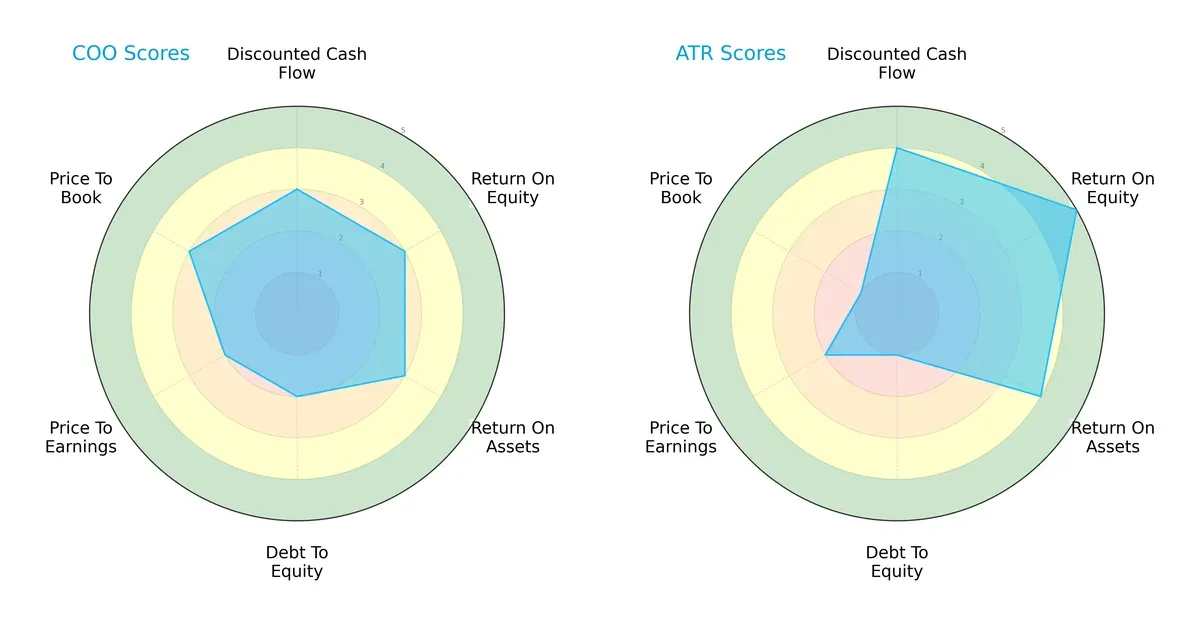
AptarGroup leads in discounted cash flow (4 vs. 3), return on equity (5 vs. 3), and return on assets (4 vs. 3), showing superior profitability and asset efficiency. The Cooper Companies displays a more moderate but balanced valuation profile with better price-to-book (3 vs. 1) and slightly stronger debt management (2 vs. 1). AptarGroup’s edge is its operational excellence, but it carries higher financial risk. Cooper offers more stability with fewer valuation red flags.
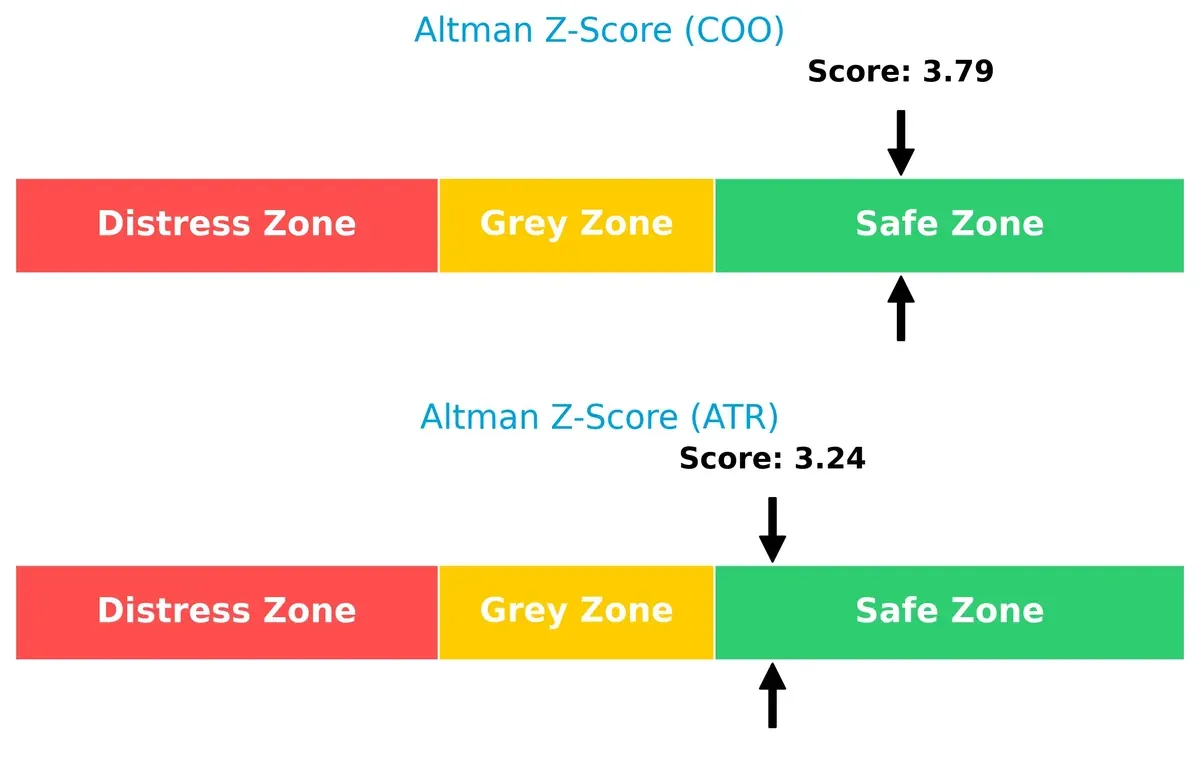
Bankruptcy Risk: Solvency Showdown
The Cooper Companies (Z-score 3.79) and AptarGroup (3.24) both sit comfortably in the safe zone, indicating strong long-term solvency and low bankruptcy risk in this economic cycle:
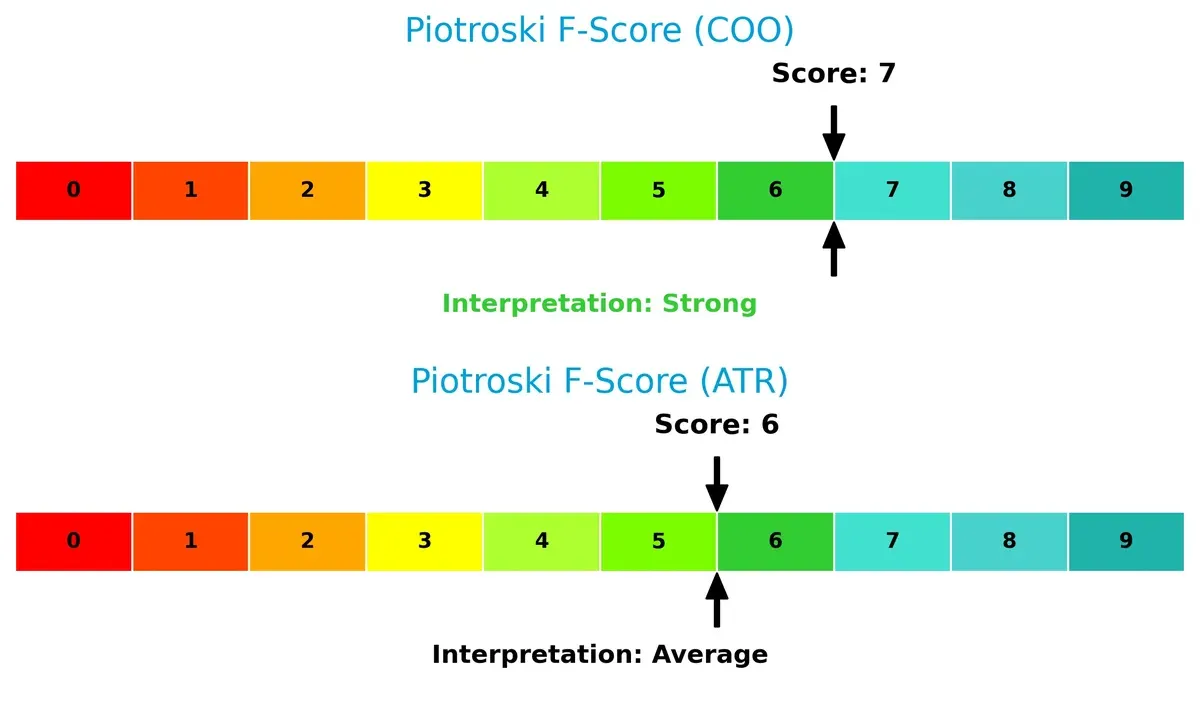
Financial Health: Quality of Operations
The Cooper Companies scores a solid 7 on the Piotroski scale, reflecting strong financial health and operational quality. AptarGroup’s 6 suggests average health, with some caution warranted on internal metrics compared to Cooper:
How are the two companies positioned?
This section dissects COO and ATR’s operational DNA by comparing revenue distribution and internal dynamics—strengths and weaknesses. The goal is to confront their economic moats and identify the most resilient, sustainable competitive advantage today.
Revenue Segmentation: The Strategic Mix
This visual comparison dissects how The Cooper Companies, Inc. and AptarGroup, Inc. diversify their income streams and highlights their primary sector bets:
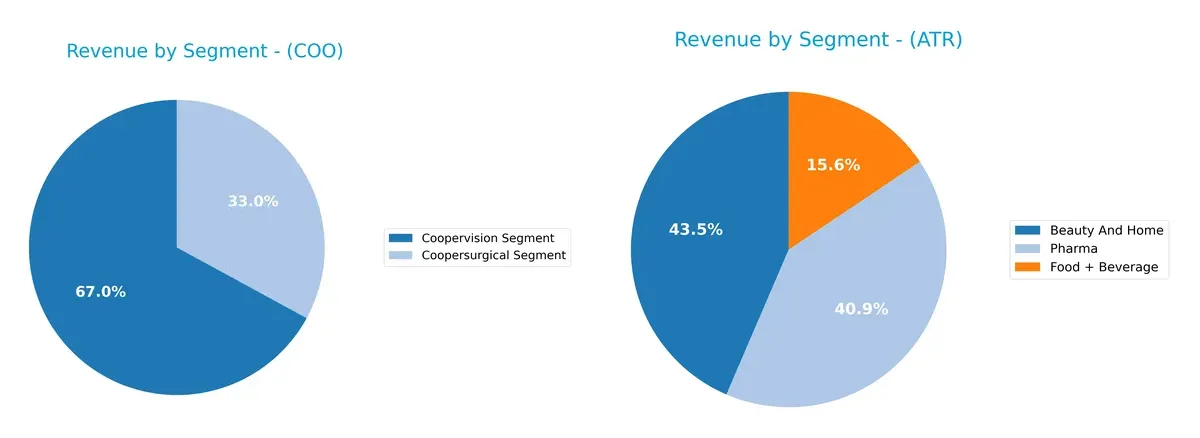
The Cooper Companies leans heavily on Coopervision, generating $2.74B in 2025, dwarfing its Coopersurgical segment at $1.35B. AptarGroup shows a more balanced mix: Beauty And Home leads at $1.46B, Pharma closely follows with $1.37B, and Food + Beverage adds $524M. AptarGroup’s diversified portfolio reduces concentration risk. In contrast, Cooper’s reliance on vision care pivots on ecosystem lock-in but exposes it to market shifts in one dominant segment.
Strengths and Weaknesses Comparison
This table compares the strengths and weaknesses of The Cooper Companies, Inc. and AptarGroup, Inc.:
COO Strengths
- Diverse revenue from Coopersurgical and Coopervision segments
- Strong global presence with significant US and European sales
- Favorable liquidity ratios and low debt levels
ATR Strengths
- Diversified across Beauty, Food & Beverage, and Pharma segments
- Favorable net margin and interest coverage ratios
- Solid presence in US and European markets
COO Weaknesses
- Unfavorable ROE and ROIC below WACC, indicating weak capital returns
- High P/E ratio suggests expensive valuation
- Asset turnover ratio is low, limiting efficiency
- No dividend yield
ATR Weaknesses
- Zero ROE and ROIC indicate poor profitability
- Unfavorable liquidity ratios signal potential short-term risks
- Limited asset turnover and fixed asset turnover data
- Neutral dividend yield and some zero values in key ratios
Both companies show strengths in diversification and global reach, but COO faces challenges in profitability and efficiency ratios. ATR’s key weaknesses lie in profitability metrics and liquidity, which could impact its operational flexibility. These factors are critical to monitor for their respective strategic positioning.
The Moat Duel: Analyzing Competitive Defensibility
A true structural moat shields long-term profits from relentless competitive pressure. Let’s dissect the core moats of two healthcare instrument leaders:
The Cooper Companies, Inc.: Intangible Assets & Product Innovation
Cooper’s moat stems from specialized medical devices and proprietary contact lenses. It shows stable margins but shrinking ROIC signals weakening value creation. New fertility and diagnostics markets may deepen competitive risks in 2026.
AptarGroup, Inc.: Cost Advantage & Diversified Markets
Aptar leverages efficient production and broad pharma and consumer packaging segments. Its margin and earnings growth outperform Cooper, yet declining ROIC warns of eroding capital efficiency. Expansion in sustainable materials offers a growth lever.
Verdict: Intangible Assets vs. Cost Advantage
Both firms face declining ROIC, indicating value destruction. Cooper’s intangible asset moat is more vulnerable without growth in innovation. Aptar’s cost advantage and diversified markets position it better to defend share and capitalize on emerging opportunities.
Which stock offers better returns?
Over the past 12 months, both stocks experienced bearish trends with accelerating declines, followed by recent bullish momentum showing stronger buyer dominance in COO’s shares.
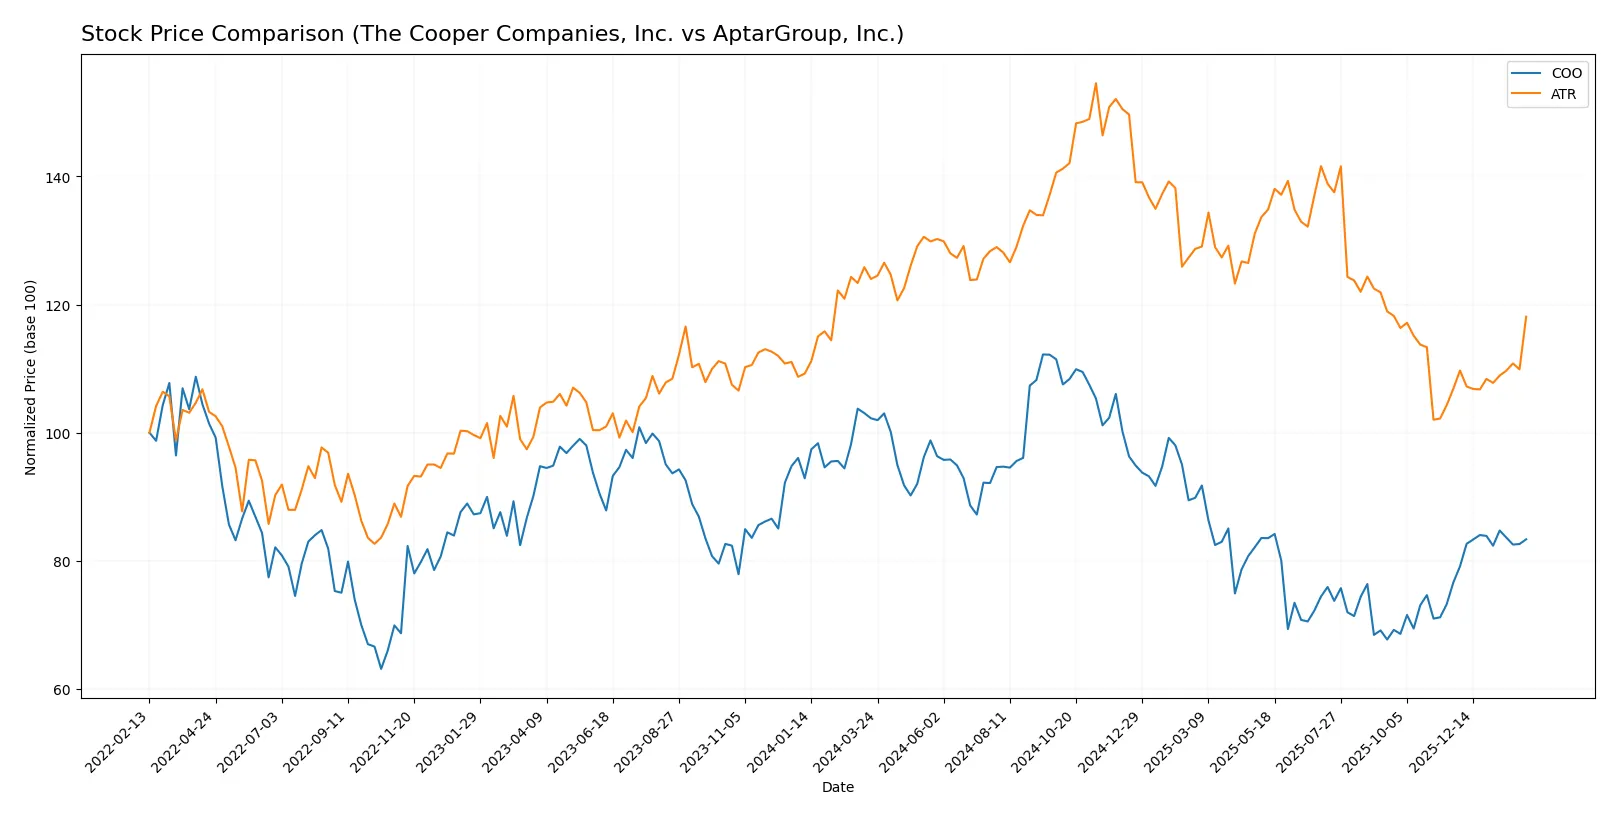
Trend Comparison
The Cooper Companies, Inc. (COO) stock fell 18.48% over the past year, marking a bearish trend with accelerating decline and high volatility (12.26 std dev). Recent months show an 8.78% rebound with stronger buyer dominance.
AptarGroup, Inc. (ATR) declined 4.74% over the past year, also bearish with accelerating loss and higher volatility (13.76 std dev). Recently, it gained 10.53%, but buyer dominance remains moderate compared to COO.
COO’s larger overall decline contrasts with ATR’s milder loss, yet COO’s recent stronger rebound and buyer dominance suggest it currently delivers higher market performance.
Target Prices
Analysts show a positive outlook with solid upside potential for both companies in the healthcare instruments sector.
| Company | Target Low | Target High | Consensus |
|---|---|---|---|
| The Cooper Companies, Inc. | 73 | 100 | 91.63 |
| AptarGroup, Inc. | 133 | 220 | 166 |
The consensus targets imply a 12% upside for Cooper Companies from its current 82.1 price and a 24% upside for AptarGroup from 134.31, signaling robust analyst confidence.

Don’t Let Luck Decide Your Entry Point
Optimize your entry points with our advanced ProRealTime indicators. You’ll get efficient buy signals with precise price targets for maximum performance. Start outperforming now!
How do institutions grade them?
The following tables summarize the latest available institutional grades for The Cooper Companies, Inc. and AptarGroup, Inc.:
The Cooper Companies, Inc. Grades
Institutional grades for The Cooper Companies, Inc. reflect consistent opinions across major analysts.
| Grading Company | Action | New Grade | Date |
|---|---|---|---|
| Needham | Maintain | Buy | 2026-02-03 |
| Barclays | Maintain | Overweight | 2026-01-26 |
| Goldman Sachs | Maintain | Sell | 2025-12-08 |
| Citigroup | Maintain | Neutral | 2025-12-08 |
| Morgan Stanley | Maintain | Equal Weight | 2025-12-08 |
| Needham | Maintain | Buy | 2025-12-05 |
| Baird | Maintain | Outperform | 2025-12-05 |
| JP Morgan | Maintain | Neutral | 2025-12-05 |
| Wells Fargo | Maintain | Equal Weight | 2025-12-05 |
| Piper Sandler | Maintain | Overweight | 2025-12-05 |
AptarGroup, Inc. Grades
AptarGroup, Inc. maintains mostly stable grades with one recent downgrade from Wells Fargo.
| Grading Company | Action | New Grade | Date |
|---|---|---|---|
| Wells Fargo | Downgrade | Equal Weight | 2026-01-06 |
| Baird | Maintain | Outperform | 2025-11-03 |
| Wells Fargo | Maintain | Overweight | 2025-11-03 |
| Wells Fargo | Maintain | Overweight | 2025-09-10 |
| Wells Fargo | Maintain | Overweight | 2025-08-04 |
| Raymond James | Maintain | Outperform | 2025-08-04 |
| Wells Fargo | Maintain | Overweight | 2025-07-18 |
| Raymond James | Maintain | Outperform | 2025-07-15 |
| Wells Fargo | Maintain | Overweight | 2025-05-06 |
| Raymond James | Maintain | Outperform | 2025-04-22 |
Which company has the best grades?
The Cooper Companies shows a wider range of ratings, including Buy and Outperform, but also Sell and Neutral grades. AptarGroup generally receives more consistently positive grades, mostly Overweight and Outperform, with only one recent downgrade. Investors might view AptarGroup’s steadier analyst sentiment as a sign of relative consensus compared to The Cooper Companies’ mixed outlook.
Risks specific to each company
The following categories identify critical pressure points and systemic threats facing both firms in the 2026 market environment:
1. Market & Competition
The Cooper Companies, Inc.
- Faces intense competition in medical instruments and contact lenses; innovation pace pressures margins.
AptarGroup, Inc.
- Operates in diverse markets but faces strong competition in pharma and beauty segments, pressuring pricing power.
2. Capital Structure & Debt
The Cooper Companies, Inc.
- Maintains moderate leverage with a favorable debt-to-assets ratio of 22.46%, interest coverage strong at 6.3x.
AptarGroup, Inc.
- Reports very low or zero reported debt measures but has a very unfavorable debt-to-equity rating, indicating potential off-balance risks.
3. Stock Volatility
The Cooper Companies, Inc.
- Exhibits beta near 1.03, suggesting market-correlated volatility typical for healthcare instruments.
AptarGroup, Inc.
- Displays low beta of 0.48, indicating defensive characteristics and lower sensitivity to market swings.
4. Regulatory & Legal
The Cooper Companies, Inc.
- Subject to stringent healthcare regulations globally, with risks in surgical and diagnostics product approvals.
AptarGroup, Inc.
- Faces complex regulatory environments in pharma and consumer products; compliance lapses could impact reputation and costs.
5. Supply Chain & Operations
The Cooper Companies, Inc.
- Complex global operations in surgical and vision segments expose it to supply disruptions and manufacturing cost inflation.
AptarGroup, Inc.
- Diverse supply chain across pharma, beauty, and food sectors increases operational complexity and vulnerability to raw material volatility.
6. ESG & Climate Transition
The Cooper Companies, Inc.
- Limited direct data but healthcare sector increasingly pressured to improve sustainability and social governance practices.
AptarGroup, Inc.
- Actively pursuing recycled materials and digital health partnerships, showing proactive ESG adaptation but execution risks remain.
7. Geopolitical Exposure
The Cooper Companies, Inc.
- Global footprint in Americas, EMEA, and Asia exposes it to trade tensions and regional regulatory shocks.
AptarGroup, Inc.
- Also global but with significant exposure to North America and Europe; geopolitical instability could disrupt supply and demand.
Which company shows a better risk-adjusted profile?
The Cooper Companies faces its greatest risk from competitive pressure impacting margins and innovation demands. AptarGroup’s most significant risk is its unclear capital structure and unfavorable debt-to-equity profile, which could conceal financial vulnerabilities. Cooper’s balanced leverage and stronger liquidity signal a safer risk-adjusted profile. Its Altman Z-score of 3.79 versus Aptar’s 3.24 confirms lower bankruptcy risk. Aptar’s low beta and recent strong stock price surge (+8.3%) suggest market optimism but mask capital structure concerns. I lean toward Cooper as the more prudent risk-adjusted choice amid evolving 2026 healthcare dynamics.
Final Verdict: Which stock to choose?
The Cooper Companies, Inc. (COO) shines with its operational resilience and strong balance sheet, demonstrating a cash conversion cycle under control despite challenges. However, its declining profitability and value destruction signal a point of vigilance. COO suits investors with an appetite for turnaround stories and aggressive growth exposure.
AptarGroup, Inc. (ATR) commands a strategic moat through steady revenue growth and disciplined capital allocation, supported by a solid safety profile and efficient asset use. While its profitability metrics lag slightly, ATR offers superior stability compared to COO. It fits well into GARP portfolios focused on balanced growth and risk management.
If you prioritize aggressive growth and are comfortable with turnaround risks, COO presents a compelling scenario thanks to its operational strength and recent positive price momentum. However, if you seek a more stable, growth-at-a-reasonable-price profile with a consistent moat and healthier financial ratios, ATR offers better stability and a clearer path to value creation. Both require careful monitoring of profitability trends.
Disclaimer: Investment carries a risk of loss of initial capital. The past performance is not a reliable indicator of future results. Be sure to understand risks before making an investment decision.
Go Further
I encourage you to read the complete analyses of The Cooper Companies, Inc. and AptarGroup, Inc. to enhance your investment decisions: