Home > Comparison > Healthcare > ISRG vs ATR
The strategic rivalry between Intuitive Surgical, Inc. and AptarGroup, Inc. shapes the competitive landscape of the healthcare instruments sector. Intuitive Surgical leads with high-tech surgical robotics, while AptarGroup excels as a diversified supplier of dispensing and sealing solutions. This analysis pits innovation-driven growth against steady, multi-segment diversification. I will determine which business model offers superior risk-adjusted returns for a well-rounded investment portfolio.
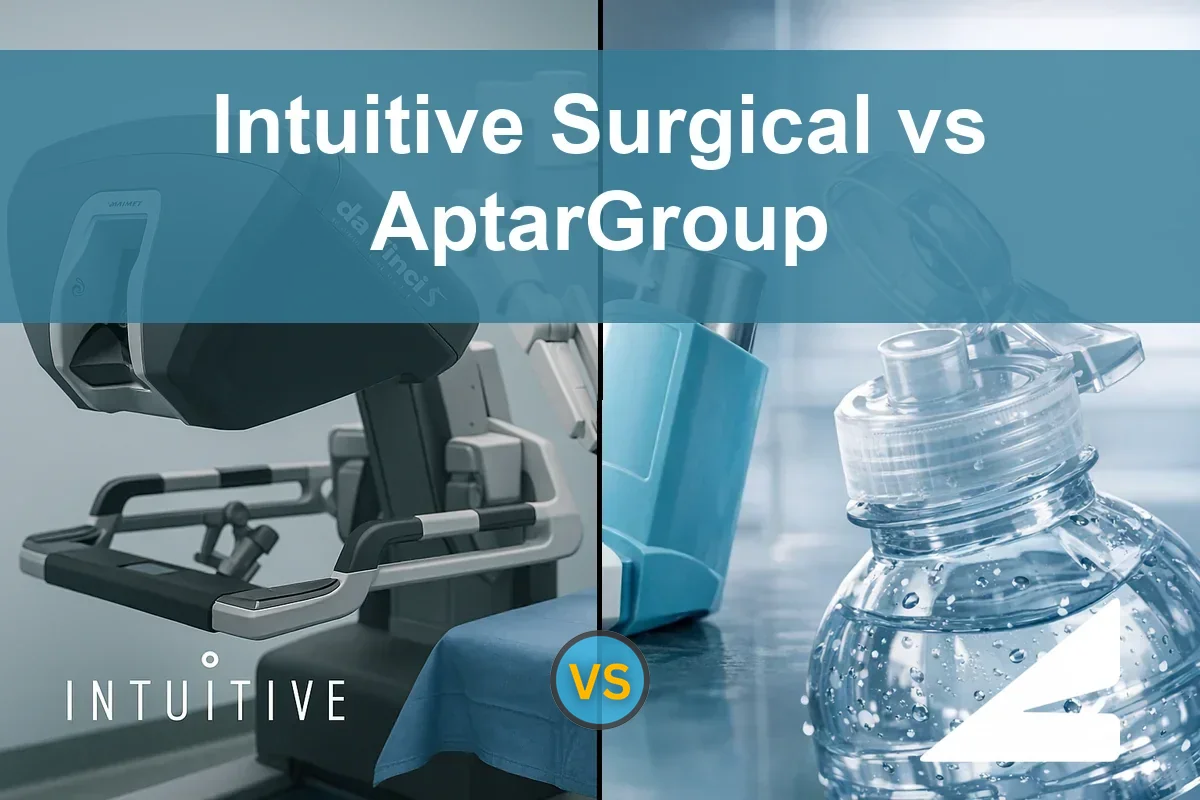
Table of contents
Companies Overview
Intuitive Surgical and AptarGroup each command critical niches within the medical instruments and supplies sector.
Intuitive Surgical, Inc.: Pioneer in Minimally Invasive Surgery
Intuitive Surgical dominates the minimally invasive surgical systems market. Its core revenue stems from the da Vinci Surgical System and complementary instruments, enhancing surgical precision. In 2026, the company focuses on expanding its digital capabilities to streamline hospital performance and broaden diagnostic applications beyond surgery.
AptarGroup, Inc.: Leader in Dispensing and Material Science Solutions
AptarGroup specializes in dispensing, sealing, and material science products across pharma, beauty, and food markets. Its revenue engine lies in pumps, valves, and elastomeric components tailored to diverse end-markets. The company’s 2026 strategy emphasizes sustainable innovation through recycled materials and digital therapy collaborations.
Strategic Collision: Similarities & Divergences
Both firms serve healthcare with precision equipment but differ in scope—Intuitive Surgical invests heavily in integrated digital surgical platforms, while AptarGroup excels in diversified material science solutions. They compete indirectly on medical innovation rather than direct market share. Intuitive Surgical’s high-beta growth profile contrasts with AptarGroup’s steadier, dividend-paying model, reflecting distinct investment temperaments.
Income Statement Comparison
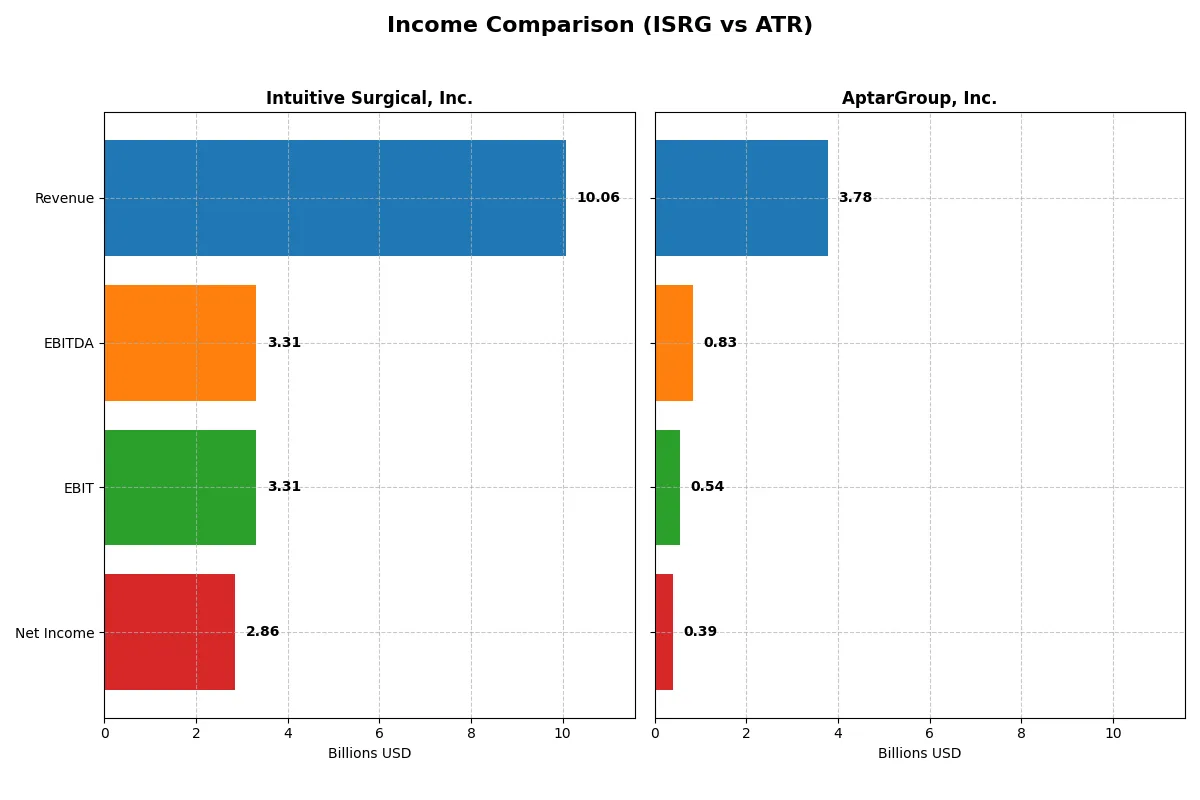
This data dissects the core profitability and scalability of both corporate engines to reveal who dominates the bottom line:
| Metric | Intuitive Surgical, Inc. (ISRG) | AptarGroup, Inc. (ATR) |
|---|---|---|
| Revenue | 10.1B | 3.8B |
| Cost of Revenue | 3.4B | 2.7B |
| Operating Expenses | 3.7B | 606M |
| Gross Profit | 6.7B | 1.1B |
| EBITDA | 3.3B | 831M |
| EBIT | 3.3B | 544M |
| Interest Expense | 0 | 53M |
| Net Income | 2.9B | 393M |
| EPS | 8 | 5.97 |
| Fiscal Year | 2025 | 2025 |
Income Statement Analysis: The Bottom-Line Duel
This income statement comparison reveals each company’s operational efficiency and profitability trends over recent years.
Intuitive Surgical, Inc. Analysis
Intuitive Surgical’s revenue surged from $5.7B in 2021 to $10.1B in 2025, reflecting robust growth. Net income rose sharply to $2.86B in 2025, with a strong net margin near 28%. Its gross margin remains high at 66%, signaling excellent cost control. The 2025 results show accelerating EBIT growth of 41%, underscoring expanding operational efficiency.
AptarGroup, Inc. Analysis
AptarGroup’s revenue grew modestly to $3.78B in 2025 from $3.23B in 2021. Net income climbed steadily to $393M, supported by a net margin of 10.4%. Despite a dip in gross profit last year, Aptar maintains a consistent EBIT margin over 14%. The 2025 results suggest stable but slower momentum compared to Intuitive Surgical.
Margin Mastery vs. Steady Growth
Intuitive Surgical dominates with superior gross and net margins, alongside rapid earnings growth outpacing AptarGroup. AptarGroup offers steady revenue and income increases but at significantly lower profitability levels. For investors prioritizing operational excellence and high margin expansion, Intuitive Surgical presents a more compelling profile.
Financial Ratios Comparison
These vital ratios act as a diagnostic tool to expose the underlying fiscal health, valuation premiums, and capital efficiency of the companies compared:
| Ratios | Intuitive Surgical, Inc. (ISRG) | AptarGroup, Inc. (ATR) |
|---|---|---|
| ROE | 14.13% (2024) | 15.15% (2024) |
| ROIC | 11.99% (2024) | 10.68% (2024) |
| P/E | 79.82 (2024) | 27.82 (2024) |
| P/B | 11.28 (2024) | 4.22 (2024) |
| Current Ratio | 4.07 (2024) | 1.38 (2024) |
| Quick Ratio | 3.22 (2024) | 0.95 (2024) |
| D/E | 0.009 (2024) | 0.44 (2024) |
| Debt-to-Assets | 0.78% (2024) | 24.28% (2024) |
| Interest Coverage | N/A | 11.31 (2024) |
| Asset Turnover | 0.44 (2024) | 0.81 (2024) |
| Fixed Asset Turnover | 1.75 (2024) | 2.37 (2024) |
| Payout Ratio | 0% (2024) | 30.45% (2024) |
| Dividend Yield | 0% (2024) | 1.09% (2024) |
| Fiscal Year | 2024 | 2024 |
Efficiency & Valuation Duel: The Vital Signs
Financial ratios serve as a company’s DNA, exposing hidden risks and revealing operational excellence in a concise numeric language.
Intuitive Surgical, Inc.
Intuitive Surgical shows a robust net margin of 28.38%, indicating strong profitability. However, its P/E ratio of 70.78 signals a stretched valuation, making the stock expensive. The absence of dividends points to a focus on reinvestment, notably in R&D, which consumes 13.7% of revenue, aiming to sustain growth.
AptarGroup, Inc.
AptarGroup posts a modest net margin of 10.4%, reflecting moderate profitability with a more reasonable P/E of 20.41, suggesting a fairly valued stock. The company supports shareholders with a 1.5% dividend yield, while allocating 16.1% of revenue to R&D, balancing returns and innovation efforts.
Premium Valuation vs. Balanced Return Profile
Intuitive Surgical commands a premium valuation fueled by high profitability but lacks direct shareholder payouts. AptarGroup offers a more balanced risk-reward tradeoff with moderate margins, fair valuation, and steady dividends. Growth-focused investors might prefer Intuitive’s profile, while income-oriented investors may favor AptarGroup.
Which one offers the Superior Shareholder Reward?
Intuitive Surgical (ISRG) pays no dividends but reinvests heavily in growth and innovation, reflected in a 0% payout ratio and strong free cash flow. AptarGroup (ATR) offers a 1.5% dividend yield with a 30% payout ratio, supported by stable earnings and moderate buybacks. ISRG’s aggressive reinvestment and superior margins suggest higher long-term total returns, despite no current dividend. ATR provides steady income but slower growth. I conclude ISRG offers the more attractive total shareholder reward in 2026 due to its sustainable capital allocation and growth moat.
Comparative Score Analysis: The Strategic Profile
The radar chart reveals the fundamental DNA and trade-offs of Intuitive Surgical, Inc. and AptarGroup, Inc., highlighting their distinct financial strengths and weaknesses:
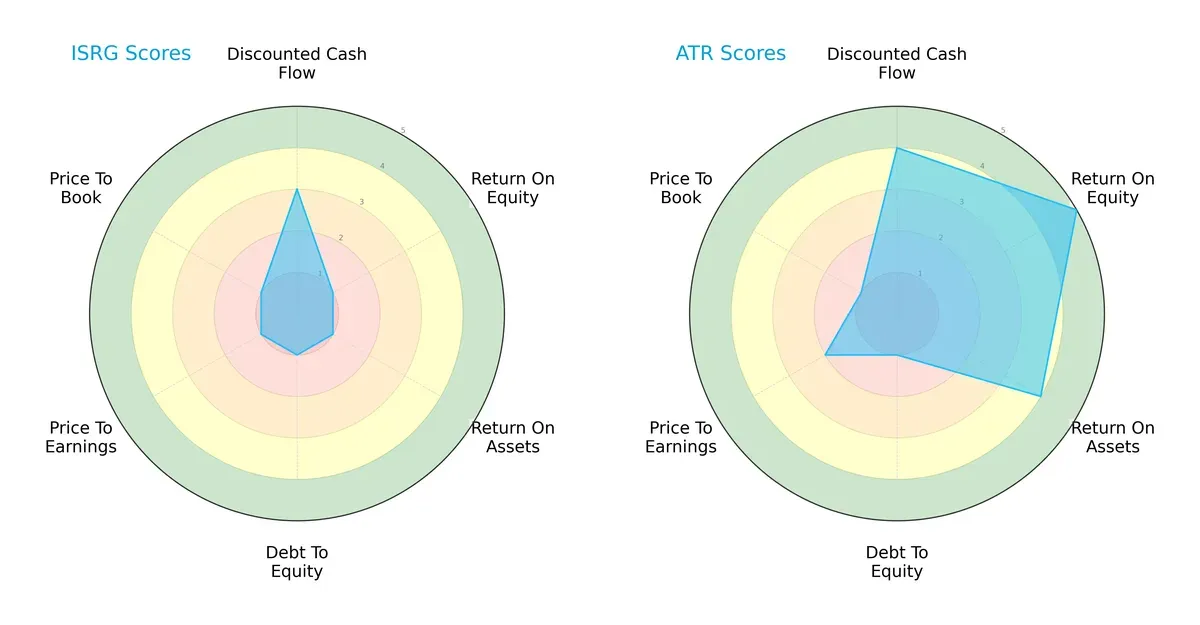
AptarGroup shows a more balanced and robust financial profile with strong returns on equity (5) and assets (4), alongside a favorable discounted cash flow score (4). Intuitive Surgical relies on a moderate DCF score (3) but struggles across ROE, ROA, and valuation metrics, all scoring very unfavorably (1). Both have weak debt-to-equity scores (1), but AptarGroup’s operational efficiency and cash flow projections set it apart as the more strategically stable company.
Bankruptcy Risk: Solvency Showdown
Intuitive Surgical’s Altman Z-Score of 46.5 vastly exceeds AptarGroup’s 3.2, indicating a substantially stronger solvency position in this cycle:
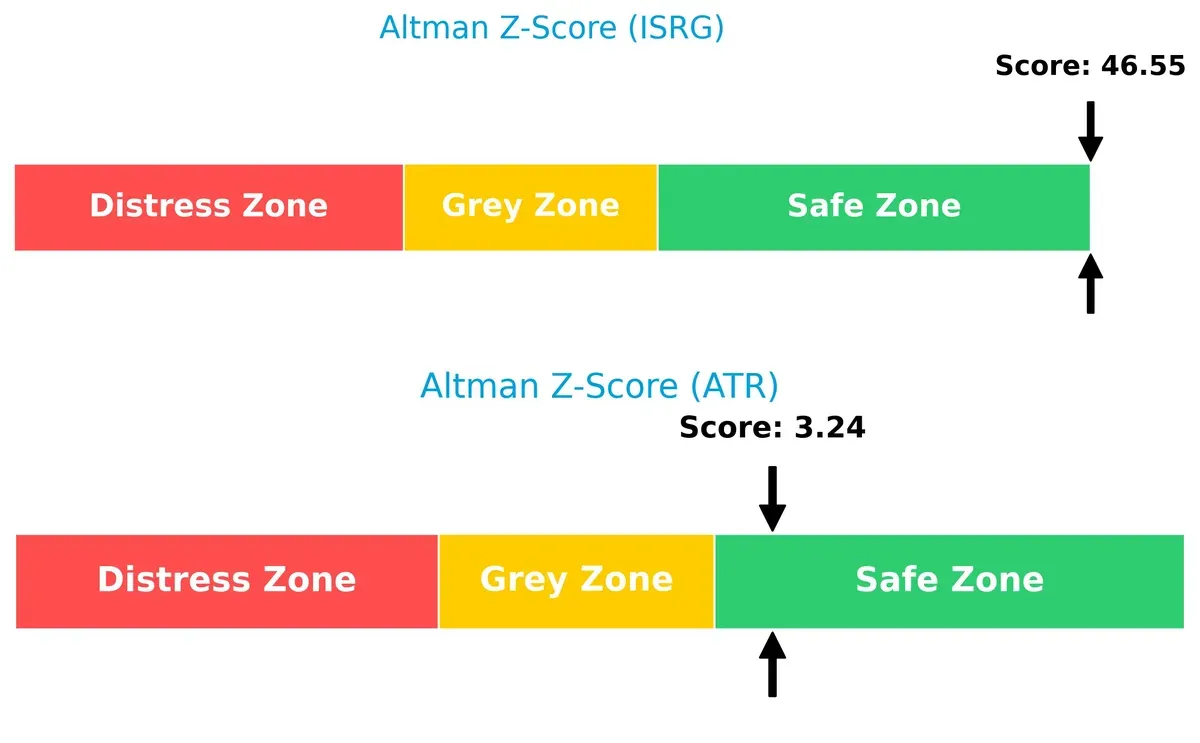
Both companies reside safely above the distress threshold, but Intuitive Surgical’s extraordinary score suggests exceptional financial resilience, while AptarGroup sits just securely in the safe zone, warranting closer monitoring amid potential market volatility.
Financial Health: Quality of Operations
AptarGroup’s Piotroski F-Score of 6 edges out Intuitive Surgical’s 5, signaling marginally stronger internal financial health and operational quality:
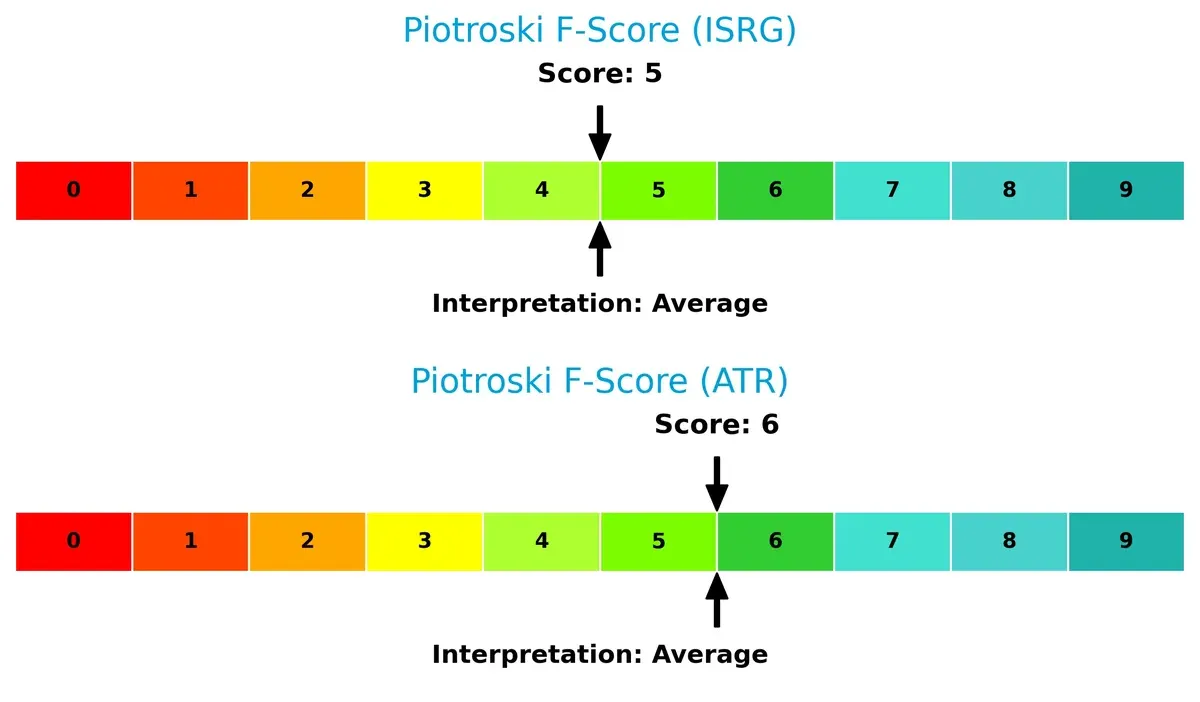
Both firms rate as average, lacking the peak strength (8-9) I look for in solid value investments. Neither shows glaring red flags, but AptarGroup’s slightly superior score suggests better current profitability and efficiency metrics, offering a modest operational advantage.
How are the two companies positioned?
This section dissects the operational DNA of ISRG and ATR by comparing their revenue distribution and internal dynamics. The goal is to confront their economic moats and identify the most resilient competitive advantage today.
Revenue Segmentation: The Strategic Mix
This visual comparison dissects how Intuitive Surgical, Inc. and AptarGroup, Inc. diversify their income streams and where their primary sector bets lie:
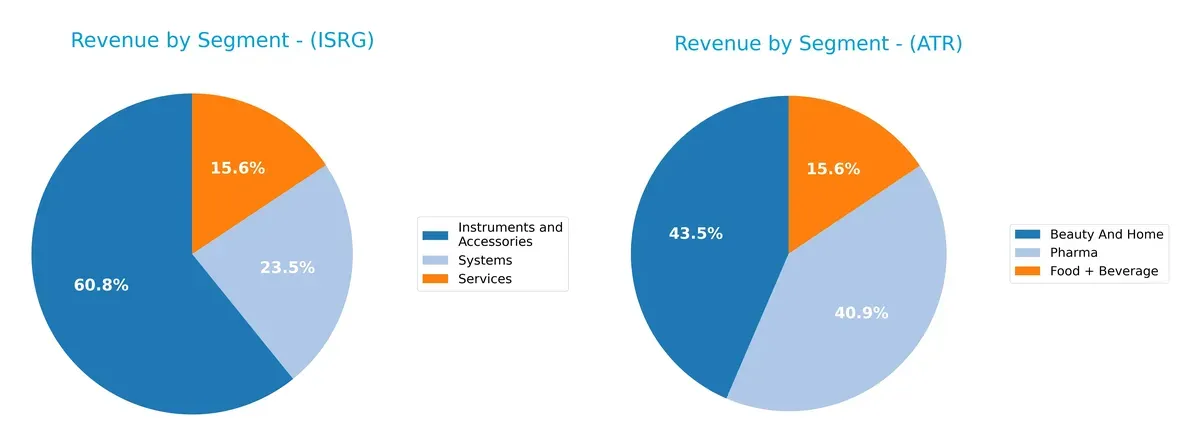
Intuitive Surgical anchors revenue in Instruments and Accessories with $5.08B, supplemented by Systems at $1.97B and Services at $1.31B, showing moderate diversification. AptarGroup pivots across Beauty and Home at $1.46B, Pharma at $1.37B, and Food + Beverage at $524M, reflecting a balanced portfolio. Intuitive’s concentration in surgical tech signals strong ecosystem lock-in, while Aptar’s mix mitigates sector-specific risks effectively.
Strengths and Weaknesses Comparison
This table compares the Strengths and Weaknesses of Intuitive Surgical and AptarGroup:
Intuitive Surgical Strengths
- High net margin at 28.38%
- Favorable debt to equity and interest coverage
- Strong product revenue growth
AptarGroup Strengths
- Favorable net margin at 10.4%
- Positive WACC at 5.75%
- Diversified global revenue across multiple regions
Intuitive Surgical Weaknesses
- Zero ROE and ROIC indicate low capital efficiency
- Unfavorable liquidity ratios
- Very high P/E of 70.78 signals valuation risk
AptarGroup Weaknesses
- Zero ROE and ROIC show capital inefficiency
- Unfavorable liquidity ratios
- Neutral dividend yield and P/E indicate moderate valuation
Intuitive Surgical demonstrates robust profitability but struggles with capital efficiency and liquidity, which may constrain growth. AptarGroup holds a more balanced financial profile with global diversification but faces similar capital return challenges. Both companies must address weaknesses to sustain competitive advantages.
The Moat Duel: Analyzing Competitive Defensibility
A structural moat is the only true shield preserving long-term profits against relentless competitive erosion in any industry:
Intuitive Surgical, Inc. (ISRG): Intangible Assets Powerhouse
I identify Intuitive Surgical’s moat in its proprietary medical robotics and software integration. Its 33% EBIT margin and 66% gross margin confirm pricing power. Expansion into diagnostic devices like Ion could deepen this moat by broadening its clinical footprint in 2026.
AptarGroup, Inc. (ATR): Material Science and Customer Integration
Aptar’s moat rests on specialized dispensing technologies and deep customer relationships in pharma and consumer markets. Despite a lower 14% EBIT margin, its diverse segments and global reach sustain steady cash flow. Innovation in digital therapies offers future growth but faces margin pressure risks.
Intangible Assets vs. Specialized Engineering: Who Defends Better?
Intuitive Surgical’s intangible asset moat delivers wider economic profits and higher margins than Aptar’s engineering-driven niche. Despite some ROIC data gaps, ISRG’s market leadership and innovation pipeline better equip it to defend market share through 2026.
Which stock offers better returns?
Over the past 12 months, Intuitive Surgical, Inc. and AptarGroup, Inc. showed contrasting price movements and trading dynamics, reflecting distinct market sentiment and momentum shifts.
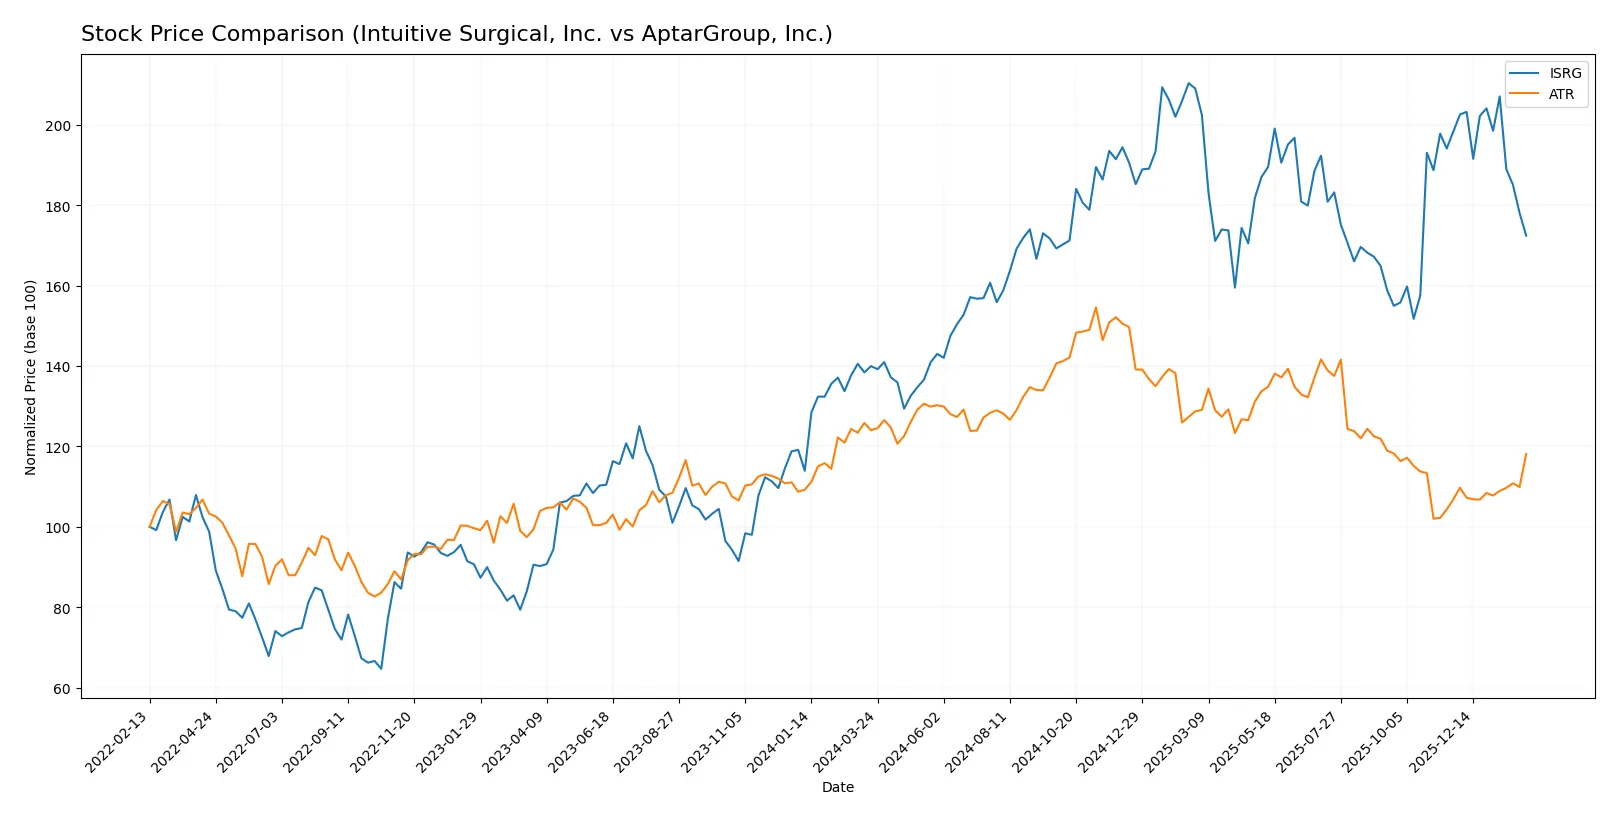
Trend Comparison
Intuitive Surgical, Inc. recorded a bullish trend with a 23.18% price increase over 12 months, though recent months show a deceleration with a -13.08% drop. Volatility remains elevated.
AptarGroup, Inc. experienced a bearish 4.74% decline over the year, but recent trading indicates an accelerating recovery with a 10.53% gain and low volatility.
Intuitive Surgical’s stronger annual gains outpace AptarGroup’s recent rebound, delivering the highest market performance overall.
Target Prices
Analysts present a clear consensus on target prices for Intuitive Surgical, Inc. and AptarGroup, Inc.
| Company | Target Low | Target High | Consensus |
|---|---|---|---|
| Intuitive Surgical, Inc. | 550 | 750 | 641.25 |
| AptarGroup, Inc. | 133 | 220 | 166 |
The consensus targets for ISRG and ATR exceed current prices by 31% and 24%, respectively, signaling analyst optimism in these healthcare instruments and supplies stocks.

Don’t Let Luck Decide Your Entry Point
Optimize your entry points with our advanced ProRealTime indicators. You’ll get efficient buy signals with precise price targets for maximum performance. Start outperforming now!
How do institutions grade them?
Intuitive Surgical, Inc. Grades
The following table summarizes recent grades assigned to Intuitive Surgical, Inc. by leading institutions.
| Grading Company | Action | New Grade | Date |
|---|---|---|---|
| Freedom Capital Markets | Buy | Buy | 2026-01-27 |
| Barclays | Maintain | Overweight | 2026-01-26 |
| BTIG | Maintain | Buy | 2026-01-23 |
| Bernstein | Maintain | Outperform | 2026-01-23 |
| Citigroup | Maintain | Neutral | 2026-01-23 |
| Evercore ISI Group | Maintain | In Line | 2026-01-23 |
| Piper Sandler | Maintain | Overweight | 2026-01-23 |
| Bernstein | Maintain | Outperform | 2026-01-09 |
| BTIG | Maintain | Buy | 2026-01-07 |
| Barclays | Maintain | Overweight | 2026-01-07 |
AptarGroup, Inc. Grades
Below is a summary of recent institutional grades for AptarGroup, Inc.
| Grading Company | Action | New Grade | Date |
|---|---|---|---|
| Wells Fargo | Downgrade | Equal Weight | 2026-01-06 |
| Baird | Maintain | Outperform | 2025-11-03 |
| Wells Fargo | Maintain | Overweight | 2025-11-03 |
| Wells Fargo | Maintain | Overweight | 2025-09-10 |
| Wells Fargo | Maintain | Overweight | 2025-08-04 |
| Raymond James | Maintain | Outperform | 2025-08-04 |
| Wells Fargo | Maintain | Overweight | 2025-07-18 |
| Raymond James | Maintain | Outperform | 2025-07-15 |
| Wells Fargo | Maintain | Overweight | 2025-05-06 |
| Raymond James | Maintain | Outperform | 2025-04-22 |
Which company has the best grades?
Intuitive Surgical, Inc. consistently receives high marks such as Buy and Outperform from multiple institutions. AptarGroup, Inc. shows solid but slightly more mixed grades, including a recent downgrade to Equal Weight. Investors may perceive Intuitive Surgical as having stronger institutional support, potentially influencing confidence and valuation.
Risks specific to each company
The following categories identify critical pressure points and systemic threats facing Intuitive Surgical, Inc. and AptarGroup, Inc. in the 2026 market environment:
1. Market & Competition
Intuitive Surgical, Inc.
- Faces intense innovation pressure in robotic surgery; premium pricing challenges market share gains.
AptarGroup, Inc.
- Diverse end-markets reduce exposure but face competitive pressures in pharma and beauty segments.
2. Capital Structure & Debt
Intuitive Surgical, Inc.
- Debt-free balance sheet limits financial risk; strong interest coverage.
AptarGroup, Inc.
- Low debt levels but weaker debt-to-equity score signals cautious leverage management.
3. Stock Volatility
Intuitive Surgical, Inc.
- High beta (1.66) indicates elevated volatility and sensitivity to market swings.
AptarGroup, Inc.
- Low beta (0.48) suggests defensive characteristics and lower price volatility.
4. Regulatory & Legal
Intuitive Surgical, Inc.
- Surgical devices face stringent FDA scrutiny and liability risks.
AptarGroup, Inc.
- Regulatory risks span pharma packaging and environmental compliance in material science.
5. Supply Chain & Operations
Intuitive Surgical, Inc.
- Reliant on specialized components; any disruption may delay product delivery and maintenance.
AptarGroup, Inc.
- Global supply chain diversity aids resilience but complexity raises operational costs.
6. ESG & Climate Transition
Intuitive Surgical, Inc.
- Limited direct exposure; focus on healthcare outcomes over emissions.
AptarGroup, Inc.
- Active in recycled materials and sustainability partnerships; ESG factors integral to strategy.
7. Geopolitical Exposure
Intuitive Surgical, Inc.
- International sales subject to trade tensions and cross-border regulatory changes.
AptarGroup, Inc.
- Broad geographic footprint diversifies risk but raises exposure to regional instability.
Which company shows a better risk-adjusted profile?
Intuitive Surgical’s greatest risk lies in high market volatility and innovation demands that may pressure margins. AptarGroup faces notable capital structure concerns despite operational resilience. AptarGroup’s lower beta and diversified markets offer a more balanced risk profile. Its favorable Altman Z-score near 3.2 confirms financial stability amid moderate leverage risks. Conversely, Intuitive’s very high Altman Z-score signals safety but paired with an unfavorable price-to-earnings ratio suggests overvaluation risks. Overall, AptarGroup shows a better risk-adjusted profile in 2026.
Final Verdict: Which stock to choose?
Intuitive Surgical, Inc. (ISRG) shines as a cash-generating powerhouse with robust revenue growth and strong profitability. Its superpower lies in unmatched innovation in robotic surgery, driving premium pricing power. A point of vigilance is its sky-high valuation, which might pressure returns. ISRG fits an Aggressive Growth portfolio aiming for market leadership.
AptarGroup, Inc. (ATR) offers a solid strategic moat in packaging technology with reliable cash flows and attractive valuation metrics. Its recurring revenue model provides safety relative to ISRG’s volatility. ATR suits investors seeking GARP—Growth at a Reasonable Price—with a focus on stable income and moderate expansion.
If you prioritize aggressive innovation and market dominance, ISRG is the compelling choice due to its superior growth trajectory and cash generation. However, if you seek stability with reasonable growth and valuation, ATR offers better stability and a more balanced risk profile. Both carry risks from declining ROIC trends, warranting careful risk management.
Disclaimer: Investment carries a risk of loss of initial capital. The past performance is not a reliable indicator of future results. Be sure to understand risks before making an investment decision.
Go Further
I encourage you to read the complete analyses of Intuitive Surgical, Inc. and AptarGroup, Inc. to enhance your investment decisions: