Home > Comparison > Healthcare > HOLX vs ATR
The strategic rivalry between Hologic, Inc. and AptarGroup, Inc. shapes the competitive dynamics of the healthcare instruments and supplies industry. Hologic operates as a diagnostics and medical imaging specialist focused on women’s health, while AptarGroup excels in dispensing and material science solutions across pharma, beauty, and food sectors. This analysis evaluates which company’s operational model and growth trajectory offers superior risk-adjusted returns for a diversified portfolio.
Table of contents
Companies Overview
Hologic and AptarGroup represent key players in the medical instruments and supplies industry, each commanding significant market presence and innovation leadership.
Hologic, Inc.: Women’s Health Diagnostics Leader
Hologic dominates the women’s health diagnostics market with a robust portfolio of molecular assays, breast imaging systems, and surgical products. Its core revenue stems from advanced diagnostic testing and imaging technologies. In 2026, the company emphasizes innovation in early disease detection and minimally invasive treatments, reinforcing its competitive advantage in women’s healthcare solutions.
AptarGroup, Inc.: Global Dispensing Solutions Specialist
AptarGroup leads in dispensing and sealing technologies for pharma, beauty, and food markets. Its revenue hinges on pumps, valves, and material science applications tailored for healthcare and consumer products. The firm’s 2026 strategy focuses on sustainable packaging innovations and digital therapy platforms, highlighting its strategic focus on combining technology with environmental responsibility.
Strategic Collision: Similarities & Divergences
Both companies prioritize healthcare innovation but diverge sharply in focus—Hologic invests in diagnostic and surgical devices targeting women’s health, while AptarGroup specializes in delivery systems across diverse sectors. Their primary battleground lies in healthcare markets, with Hologic competing on clinical precision and AptarGroup on product integration and sustainability. This contrast defines their distinct investment profiles: Hologic as a niche medical tech leader, AptarGroup as a diversified packaging innovator.
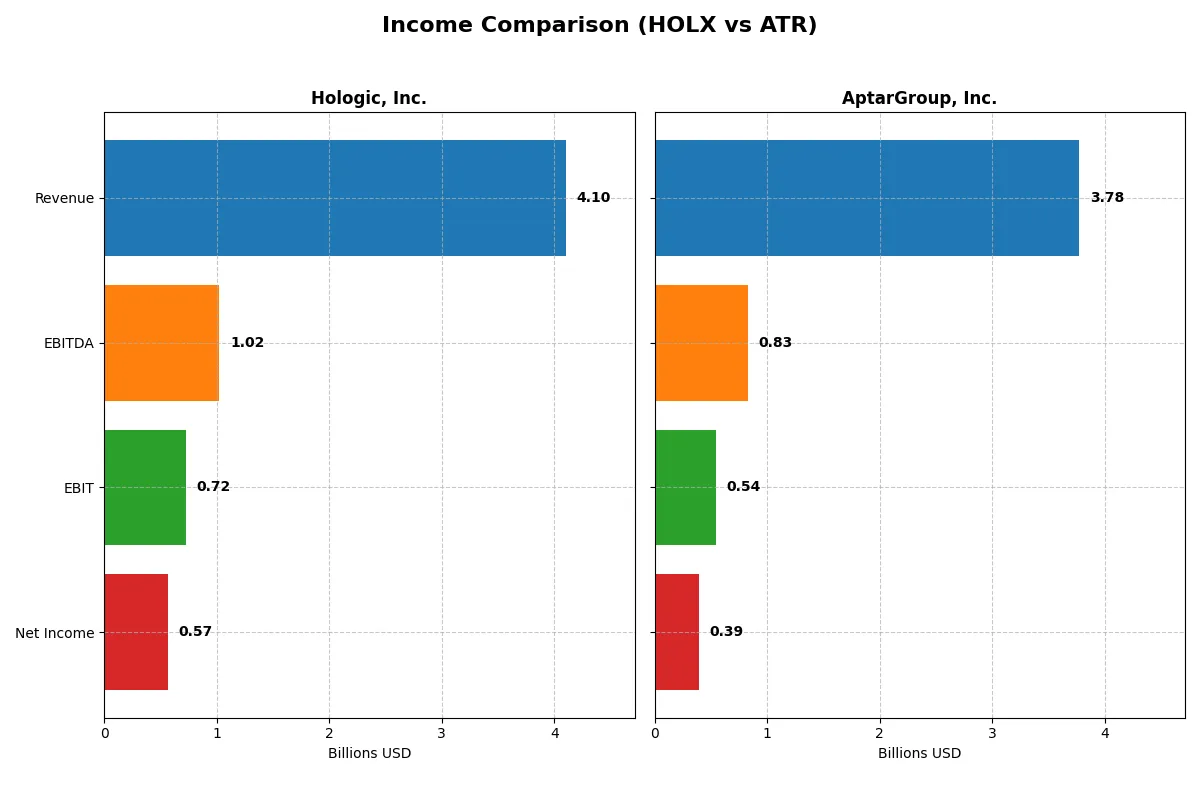
Income Statement Comparison
This data dissects the core profitability and scalability of both corporate engines to reveal who dominates the bottom line:
| Metric | Hologic, Inc. (HOLX) | AptarGroup, Inc. (ATR) |
|---|---|---|
| Revenue | 4.10B | 3.78B |
| Cost of Revenue | 1.60B | 2.66B |
| Operating Expenses | 1.79B | 606M |
| Gross Profit | 2.50B | 1.12B |
| EBITDA | 1.02B | 831M |
| EBIT | 724M | 544M |
| Interest Expense | 43M | 53M |
| Net Income | 566M | 393M |
| EPS | 2.50 | 5.97 |
| Fiscal Year | 2025 | 2025 |
Income Statement Analysis: The Bottom-Line Duel
This income statement comparison reveals which company runs a more efficient and profitable corporate engine through recent market cycles.
Hologic, Inc. Analysis
Hologic’s revenue declined 27% from 2021 to 2025, with net income shrinking nearly 70%. Despite a solid 61% gross margin, margins contracted sharply in recent years. The 2025 net margin dropped to 13.8%, indicating rising costs and weaker profitability momentum. Efficiency challenges surfaced as EBIT and EPS fell over 25% year-over-year, signaling operational headwinds.
AptarGroup, Inc. Analysis
AptarGroup grew revenue 17% over five years, with net income surging 61%. Its gross margin stands at a leaner 29.6%, but it sustains a healthy 10.4% net margin. In 2025, EBIT and EPS rose over 5%, reflecting steady operational improvements. AptarGroup’s income statement shows resilient growth and margin expansion, despite a slight dip in gross profit last year.
Verdict: Margin Power vs. Growth Resilience
Hologic boasts superior gross and net margins but suffers from steep declines in revenue and net income, undermining efficiency. AptarGroup delivers consistent top-line growth and expanding net income with improving margins, albeit at lower absolute margin levels. For investors, AptarGroup’s growth resilience and margin gains present a more attractive fundamental profile amid shifting sector dynamics.
Financial Ratios Comparison
These vital ratios act as a diagnostic tool to expose the underlying fiscal health, valuation premiums, and capital efficiency of the companies compared below:
| Ratios | Hologic, Inc. (HOLX) | AptarGroup, Inc. (ATR) |
|---|---|---|
| ROE | 11.2% (2025) | 0% (2025) |
| ROIC | 7.3% (2025) | 0% (2025) |
| P/E | 27.0 (2025) | 20.4 (2025) |
| P/B | 3.0 (2025) | 0 (2025) |
| Current Ratio | 3.75 (2025) | 0 (2025) |
| Quick Ratio | 3.06 (2025) | 0 (2025) |
| D/E | 0.52 (2025) | 0 (2025) |
| Debt-to-Assets | 29.1% (2025) | 0 (2025) |
| Interest Coverage | 16.7 (2025) | -9.5 (2025) |
| Asset Turnover | 0.45 (2025) | 0 (2025) |
| Fixed Asset Turnover | 6.27 (2025) | 0 (2025) |
| Payout ratio | 0% (2025) | 30.6% (2025) |
| Dividend yield | 0% (2025) | 1.5% (2025) |
| Fiscal Year | 2025 | 2025 |
Efficiency & Valuation Duel: The Vital Signs
Financial ratios act as a company’s DNA, unveiling hidden risks and operational strengths behind headline figures.
Hologic, Inc.
Hologic posts a solid 11.2% ROE with a favorable 13.8% net margin, signaling operational efficiency. However, its P/E of 27 and P/B of 3.02 mark the stock as somewhat expensive. The firm retains earnings for R&D, foregoing dividends, aligning with its growth-focused capital allocation.
AptarGroup, Inc.
AptarGroup shows a favorable 10.4% net margin but reports zero ROE and ROIC, which is concerning for profitability sustainability. Its P/E ratio of 20.4 is more moderate. A 1.5% dividend yield provides some shareholder returns, though lack of other leverage and liquidity data clouds full assessment.
Premium Valuation vs. Mixed Profitability
Hologic balances operational strength with a stretched valuation and no dividend, suiting growth-oriented investors. AptarGroup offers a steadier valuation and modest yield but lacks clear profitability metrics, appealing more cautiously. Risk-tolerant investors may prefer Hologic’s growth profile, while income seekers might lean toward AptarGroup.
Which one offers the Superior Shareholder Reward?
Hologic, Inc. (HOLX) pays no dividends but reinvests heavily in R&D and growth, boasting free cash flow per share of $4.05 and a robust buyback capacity. AptarGroup, Inc. (ATR) yields about 1.5%, with a 30% payout ratio, providing steady income but weaker free cash flow coverage. I see HOLX’s zero-dividend, high FCF model plus potential buybacks as more sustainable and rewarding in 2026. ATR offers modest yield but limited buyback activity restricts total return upside. For total shareholder reward, I favor HOLX’s aggressive reinvestment and buyback strategy over ATR’s income focus.
Comparative Score Analysis: The Strategic Profile
The radar chart reveals the fundamental DNA and trade-offs of Hologic, Inc. and AptarGroup, Inc., highlighting key strengths and vulnerabilities in their financial profiles:

Both companies share a favorable DCF score of 4, indicating undervaluation potential. AptarGroup excels with a top ROE score of 5, signaling superior shareholder return efficiency, while Hologic maintains a balanced ROE and ROA at 4 each. However, AptarGroup’s debt-to-equity score of 1 flags a higher leverage risk compared to Hologic’s moderate 2. Valuation metrics (PE/PB) are subdued for both, but Hologic holds a slightly less unfavorable position. Overall, Hologic presents a more balanced profile; AptarGroup relies on a distinct ROE advantage but carries heavier financial risk.
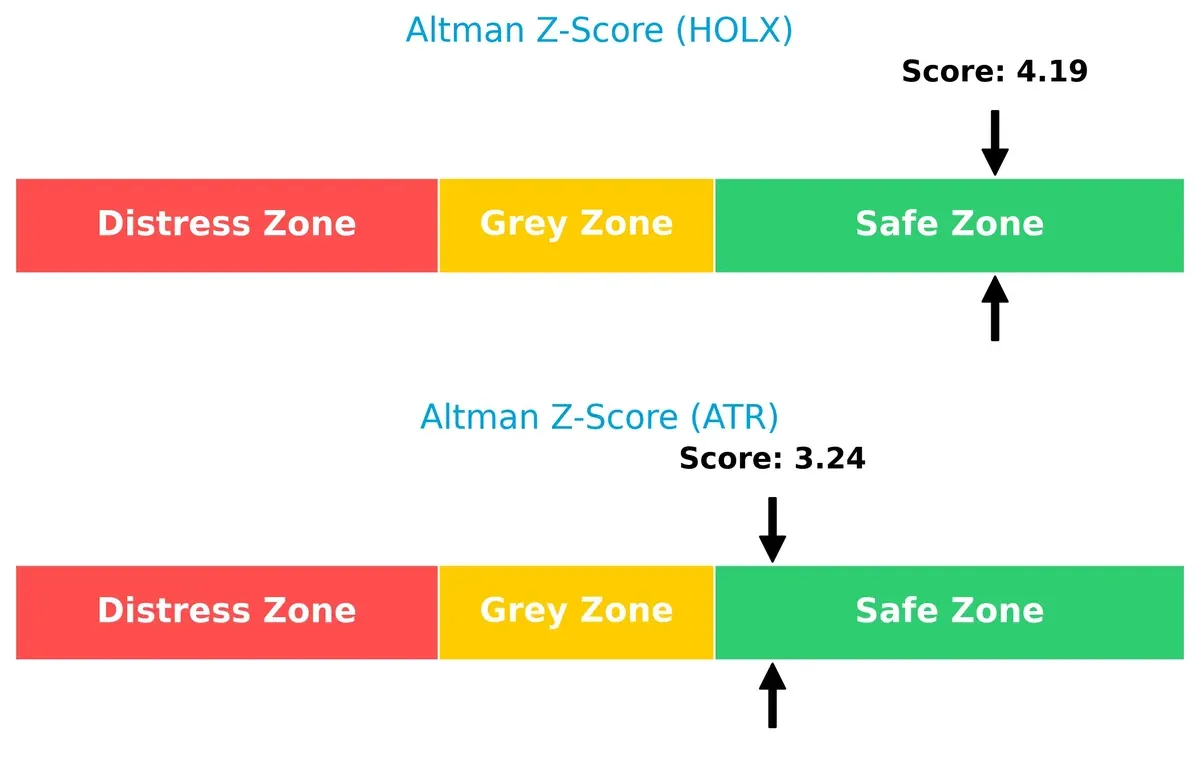
Bankruptcy Risk: Solvency Showdown
The Altman Z-Scores place both firms comfortably in the safe zone, with Hologic at 4.19 and AptarGroup at 3.24, indicating strong long-term solvency and resilience to economic cycles:
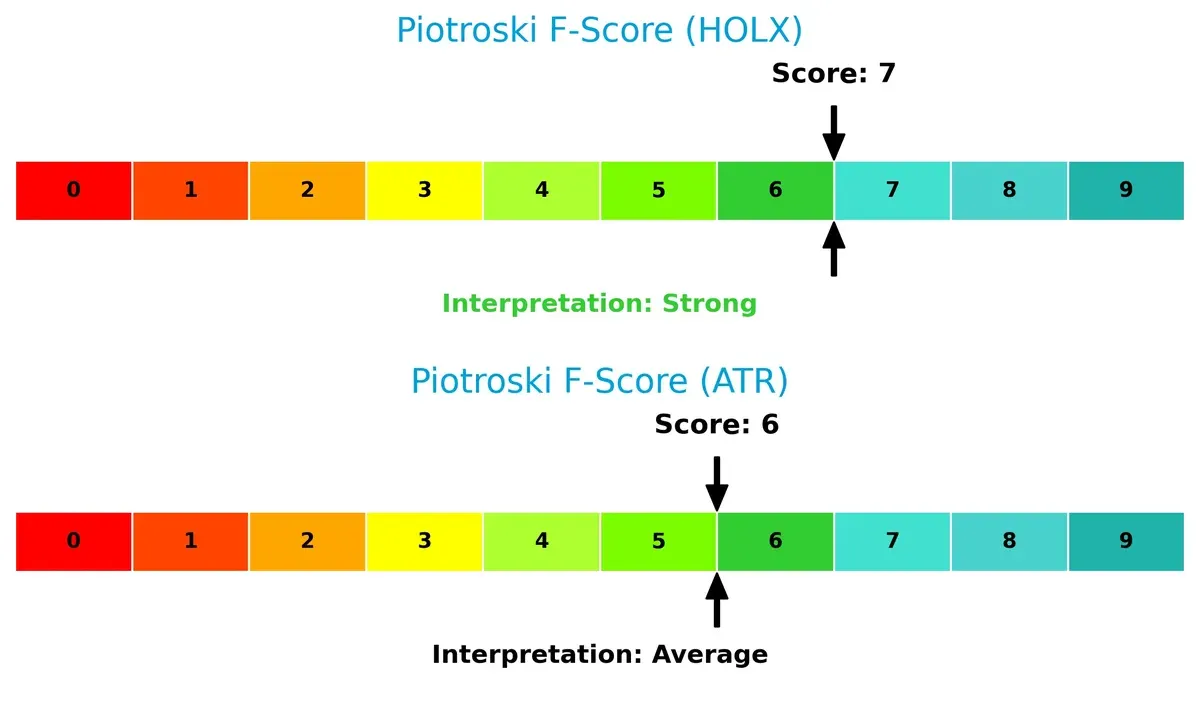
Financial Health: Quality of Operations
Hologic’s Piotroski F-Score of 7 surpasses AptarGroup’s 6, reflecting stronger internal financial controls and operational quality. AptarGroup’s lower score suggests potential red flags in profitability or leverage metrics compared to Hologic’s robust position:
How are the two companies positioned?
This section dissects the operational DNA of HOLX and ATR by comparing their revenue distribution and internal dynamics. The goal is to confront their economic moats and determine which model offers the most resilient, sustainable advantage today.
Revenue Segmentation: The Strategic Mix
This comparison dissects how Hologic, Inc. and AptarGroup, Inc. diversify their income streams and highlights their primary sector bets in 2025 and 2022 respectively:
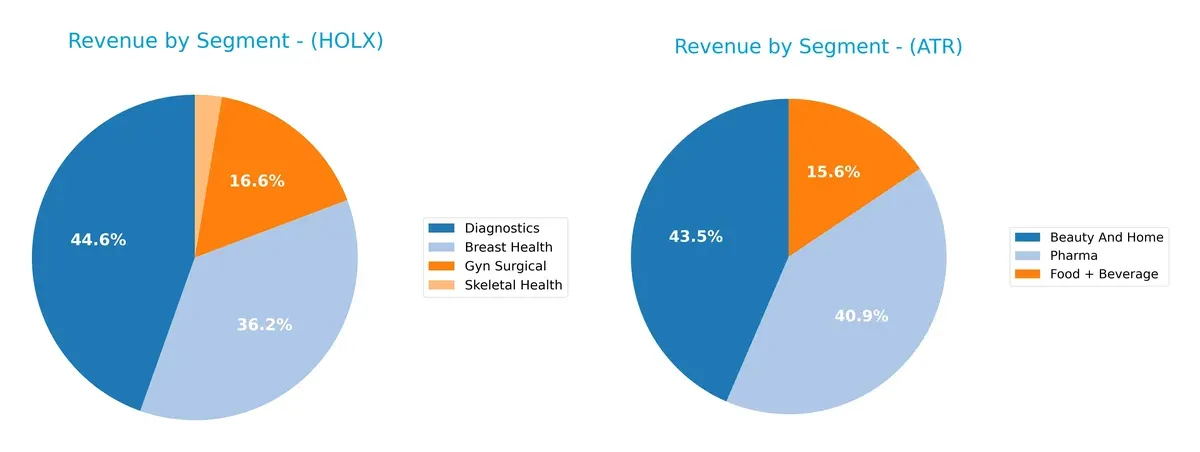
Hologic leans heavily on Diagnostics at $1.83B, with Breast Health and Gyn Surgical trailing at $1.48B and $680M. AptarGroup balances between Beauty And Home at $1.46B and Pharma at $1.37B, with Food + Beverage at $524M. AptarGroup’s broader spread reduces concentration risk, while Hologic’s Diagnostics dominance anchors its ecosystem but exposes it to sector-specific volatility.
Strengths and Weaknesses Comparison
This table compares the Strengths and Weaknesses of Hologic and AptarGroup based on diversification, profitability, financials, innovation, global presence, and market share:
Hologic Strengths
- Diverse medical segments including Breast Health, Diagnostics, Surgical
- Favorable net margin at 13.8%
- Strong interest coverage at 16.95
- Low debt to assets ratio at 29.14%
- Robust quick ratio at 3.06
- Significant US and European revenue
AptarGroup Strengths
- Balanced product segments in Beauty, Food, Pharma
- Favorable net margin at 10.4%
- Low debt and favorable debt-to-assets
- Favorable interest coverage at 10.32
- Reasonable PE ratio at 20.41
- Global footprint across US, Europe, China
Hologic Weaknesses
- High PE at 26.99 and PB at 3.02 indicate valuation risk
- Unfavorable current ratio at 3.75 despite quick ratio strength
- Neutral ROIC at 7.35% barely above WACC of 6.66%
- Unfavorable asset turnover at 0.45
- Zero dividend yield may deter income investors
AptarGroup Weaknesses
- Zero ROE and ROIC indicate weak profitability returns
- Unfavorable liquidity ratios (current and quick) missing
- Unfavorable asset and fixed asset turnover
- Neutral dividend yield at 1.5% is modest
- Higher proportion of unfavorable ratios at 42.86%
Hologic’s strengths lie in diversified healthcare segments and strong financial leverage metrics, though valuation appears stretched. AptarGroup shows solid product diversity and debt management but suffers from weak profitability returns and liquidity metrics. Both companies face challenges that could influence their strategic focus on improving operational efficiency and market positioning.
The Moat Duel: Analyzing Competitive Defensibility
A structural moat is the only reliable shield protecting long-term profits from relentless competitive erosion. Here’s how Hologic and AptarGroup stack up:
Hologic, Inc.: Intangible Assets Moat
Hologic leverages patented diagnostics and surgical products, reflected in a solid 61% gross margin. Yet, declining ROIC signals weakening value creation heading into 2026.
AptarGroup, Inc.: Cost Advantage Moat
AptarGroup’s scale and material science capabilities drive efficient production, supporting steady margin expansion and positive net income growth, despite a shrinking ROIC trend.
Intangible Assets vs. Cost Efficiency: The Moat Showdown
Hologic’s intangible asset moat is deeper but under pressure from declining returns. AptarGroup’s cost advantage sustains incremental value but lacks ROIC strength. Hologic remains better positioned to defend market share if it reverses profitability trends.
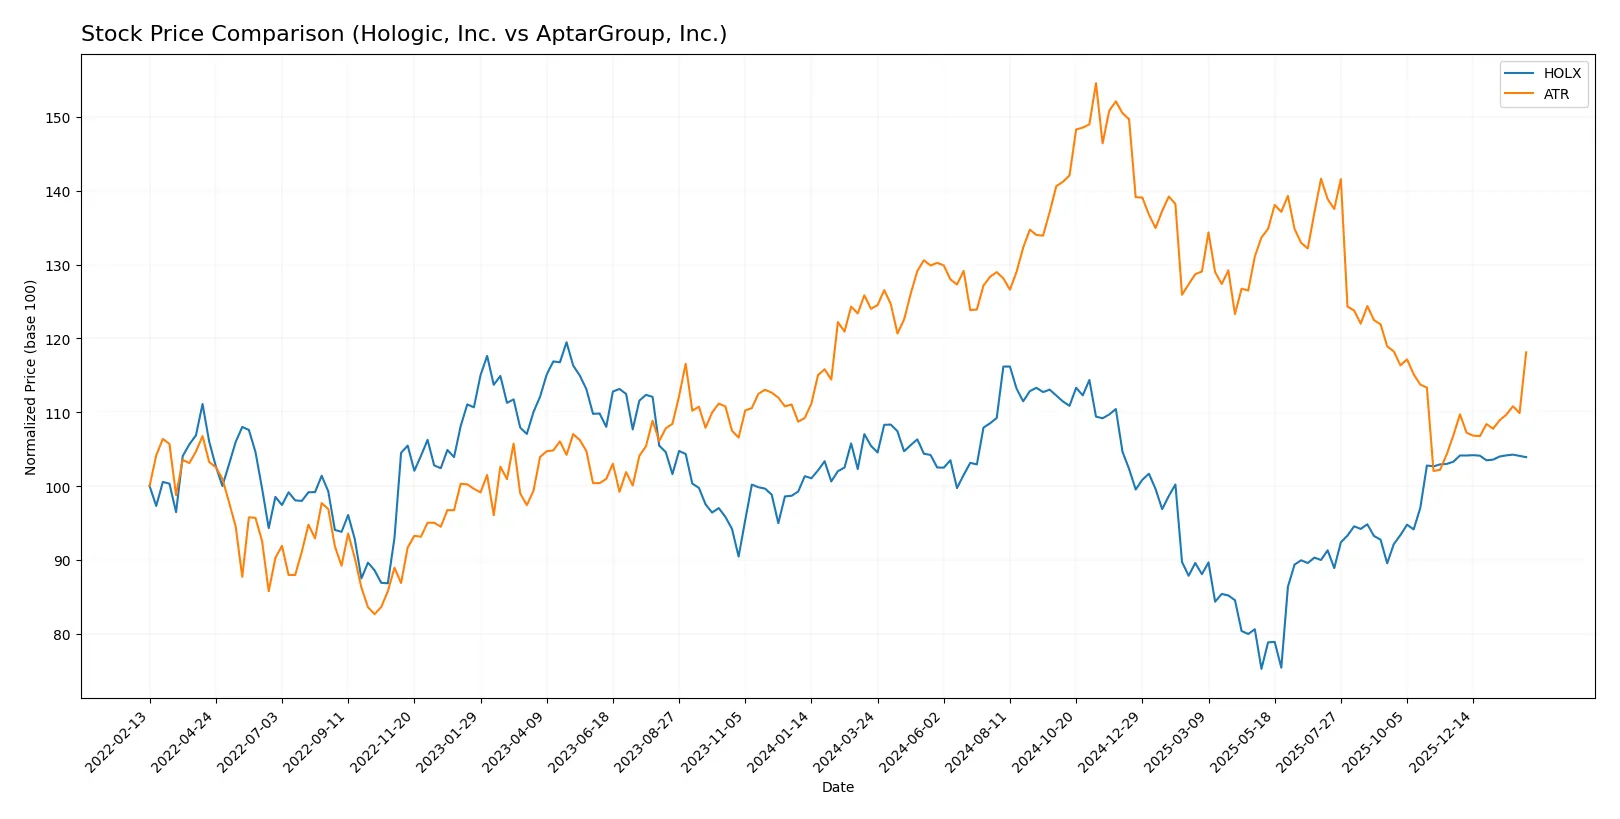
Which stock offers better returns?
Over the past 12 months, both stocks showed bearish trends with accelerating declines, but recent months reveal divergent momentum and trading dynamics.
Trend Comparison
Hologic, Inc. (HOLX) posted a -1.45% price change over the past year, indicating a bearish trend with accelerating decline. The stock hit a high of 83.64 and a low of 54.16. Recent months show a slight bullish reversal with a 0.61% gain.
AptarGroup, Inc. (ATR) fell 4.74% over the same period, confirming a bearish trend with accelerating losses. ATR’s volatility is higher, with a 13.76 standard deviation. Recently, the stock surged 10.53%, signaling strong short-term recovery.
Comparing both, ATR exhibited the largest overall decline but outperformed HOLX in recent months with a stronger bullish rebound and higher volatility. ATR delivered the highest market performance in the latest period.
Target Prices
Analysts show a moderately bullish consensus for Hologic, Inc. and a wide range of expectations for AptarGroup, Inc.
| Company | Target Low | Target High | Consensus |
|---|---|---|---|
| Hologic, Inc. | 76 | 79 | 77.8 |
| AptarGroup, Inc. | 133 | 220 | 166 |
Hologic’s target consensus sits slightly above its current price of $74.81, indicating modest upside. AptarGroup’s consensus target of $166 far exceeds its $134.31 share price, reflecting more aggressive growth expectations despite a broad target range.

Don’t Let Luck Decide Your Entry Point
Optimize your entry points with our advanced ProRealTime indicators. You’ll get efficient buy signals with precise price targets for maximum performance. Start outperforming now!
How do institutions grade them?
Here is a summary of the recent grades assigned to Hologic, Inc. and AptarGroup, Inc.:
Hologic, Inc. Grades
The table below lists recent grading actions for Hologic, Inc. from reputable firms.
| Grading Company | Action | New Grade | Date |
|---|---|---|---|
| Argus Research | Downgrade | Hold | 2026-01-12 |
| Evercore ISI Group | Downgrade | In Line | 2026-01-05 |
| Morgan Stanley | Maintain | Equal Weight | 2025-11-11 |
| Mizuho | Downgrade | Neutral | 2025-10-23 |
| Raymond James | Downgrade | Market Perform | 2025-10-22 |
| Stephens & Co. | Downgrade | Equal Weight | 2025-10-22 |
| JP Morgan | Downgrade | Neutral | 2025-10-22 |
| Needham | Maintain | Hold | 2025-10-21 |
| Leerink Partners | Maintain | Market Perform | 2025-10-21 |
| BTIG | Maintain | Neutral | 2025-10-21 |
AptarGroup, Inc. Grades
The table below summarizes recent grading activity for AptarGroup, Inc. from respected analysts.
| Grading Company | Action | New Grade | Date |
|---|---|---|---|
| Wells Fargo | Downgrade | Equal Weight | 2026-01-06 |
| Baird | Maintain | Outperform | 2025-11-03 |
| Wells Fargo | Maintain | Overweight | 2025-11-03 |
| Wells Fargo | Maintain | Overweight | 2025-09-10 |
| Wells Fargo | Maintain | Overweight | 2025-08-04 |
| Raymond James | Maintain | Outperform | 2025-08-04 |
| Wells Fargo | Maintain | Overweight | 2025-07-18 |
| Raymond James | Maintain | Outperform | 2025-07-15 |
| Wells Fargo | Maintain | Overweight | 2025-05-06 |
| Raymond James | Maintain | Outperform | 2025-04-22 |
Which company has the best grades?
AptarGroup, Inc. holds generally stronger grades, mostly “Outperform” and “Overweight.” Hologic, Inc. shows multiple downgrades to “Hold” or “Neutral.” Investors may view AptarGroup as having more favorable analyst sentiment, potentially affecting stock interest.
Risks specific to each company
The following categories identify the critical pressure points and systemic threats facing both firms in the 2026 market environment:
1. Market & Competition
Hologic, Inc.
- Faces intense competition in medical diagnostics and women’s health markets, requiring ongoing innovation to sustain growth.
AptarGroup, Inc.
- Competes across diverse sectors including pharma and beauty, facing pressures from global players and evolving customer demands.
2. Capital Structure & Debt
Hologic, Inc.
- Moderate leverage with debt-to-equity at 0.52; interest coverage strong at 16.95, signaling manageable debt risk.
AptarGroup, Inc.
- Exhibits very low debt levels, reflected in favorable debt-to-equity and coverage ratios, enhancing financial flexibility.
3. Stock Volatility
Hologic, Inc.
- Beta of 0.73 indicates moderate stock volatility, less sensitive to market swings than average healthcare peers.
AptarGroup, Inc.
- Lower beta of 0.48 suggests defensive stock behavior, providing more stability amid market turbulence.
4. Regulatory & Legal
Hologic, Inc.
- Subject to stringent FDA regulations affecting product approvals and ongoing compliance costs.
AptarGroup, Inc.
- Faces regulatory scrutiny mainly in pharma packaging and material safety, with risks tied to international operations.
5. Supply Chain & Operations
Hologic, Inc.
- Complex supply chains for diagnostics and surgical products vulnerable to component shortages and logistical disruptions.
AptarGroup, Inc.
- Global manufacturing footprint exposes it to supply chain risks, though diversified end markets may mitigate impact.
6. ESG & Climate Transition
Hologic, Inc.
- Increasing pressure to reduce environmental footprint in manufacturing and product lifecycle, aligning with healthcare ESG trends.
AptarGroup, Inc.
- Strategic partnerships focus on recycled materials and sustainability, showing proactive ESG integration in operations.
7. Geopolitical Exposure
Hologic, Inc.
- International sales subject to geopolitical risks, trade tensions, and regulatory changes in Europe and Asia-Pacific.
AptarGroup, Inc.
- Exposure to global markets, with risks concentrated in supply chain disruptions from geopolitical instability.
Which company shows a better risk-adjusted profile?
Hologic’s key risk lies in competitive pressure and regulatory complexity in diagnostics. AptarGroup struggles with capital allocation inefficiencies and moderate operational risks. Hologic’s stronger Altman Z-Score (4.19 vs. 3.24) and higher Piotroski Score (7 vs. 6) reflect a safer financial footing. AptarGroup’s low leverage is a plus, yet its zero ROE and ROIC raise concerns. The recent rise in Hologic’s stock price near all-time highs signals market confidence despite its challenges. Overall, Hologic presents a superior risk-adjusted profile given its balanced capital structure and robust financial health.
Final Verdict: Which stock to choose?
Hologic, Inc. (HOLX) impresses with its unmatched operational efficiency and robust cash flow generation. Its strong liquidity position supports resilience, but the declining profitability trend is a point of vigilance. HOLX fits well within aggressive growth portfolios willing to tolerate near-term earnings pressure for potential long-term gains.
AptarGroup, Inc. (ATR) benefits from a strategic moat based on steady recurring revenue streams and solid free cash flow yield. While it offers better financial stability relative to HOLX, ATR’s weakening capital returns and moderate revenue growth temper its allure. It suits GARP investors seeking a blend of growth and reasonable valuation.
If you prioritize operational efficiency and can accept short-term volatility, Hologic outshines due to its cash generation and scale. However, if you seek better stability with moderate growth, AptarGroup offers a safer profile despite its value erosion. Both present distinct scenarios depending on your risk tolerance and investment horizon.
Disclaimer: Investment carries a risk of loss of initial capital. The past performance is not a reliable indicator of future results. Be sure to understand risks before making an investment decision.
Go Further
I encourage you to read the complete analyses of Hologic, Inc. and AptarGroup, Inc. to enhance your investment decisions: