Home > Comparison > Healthcare > BDX vs ATR
The strategic rivalry between Becton, Dickinson and Company and AptarGroup, Inc. shapes the Healthcare sector’s medical instruments landscape. BDX operates as a capital-intensive medical device manufacturer, while ATR excels as a specialized provider of dispensing and sealing solutions. This analysis pits BDX’s broad clinical product portfolio against ATR’s niche material science innovation. I aim to identify which company offers a superior risk-adjusted return for diversified investors navigating this evolving industry.

Table of contents
Companies Overview
Becton, Dickinson and Company and AptarGroup, Inc. serve crucial roles in the medical instruments and supplies sector.
Becton, Dickinson and Company: Global Medical Technology Leader
Becton, Dickinson and Company dominates healthcare with a broad portfolio of medical devices and diagnostic products. Its revenue primarily stems from supplying hospitals and labs worldwide with syringes, catheters, and advanced diagnostic systems. In 2026, the company focuses on expanding its automated medication management and life sciences solutions to enhance clinical efficiency.
AptarGroup, Inc.: Innovative Dispensing Solutions Provider
AptarGroup, Inc. specializes in dispensing and sealing technologies across pharma, beauty, and food markets. It generates income by selling pumps, valves, and elastomeric components tailored for drug delivery and consumer products. The company’s 2026 strategy emphasizes sustainable materials development and digital health platforms to capture emerging market trends.
Strategic Collision: Similarities & Divergences
Both companies target healthcare with specialized medical supplies, yet Becton, Dickinson emphasizes integrated clinical systems while AptarGroup focuses on component innovation and sustainability. Their competition centers on delivering value through technology in drug delivery and medical device markets. Investors will find distinct profiles: Becton, Dickinson offers scale and diversification; AptarGroup leans on niche innovation and environmental leadership.
Income Statement Comparison
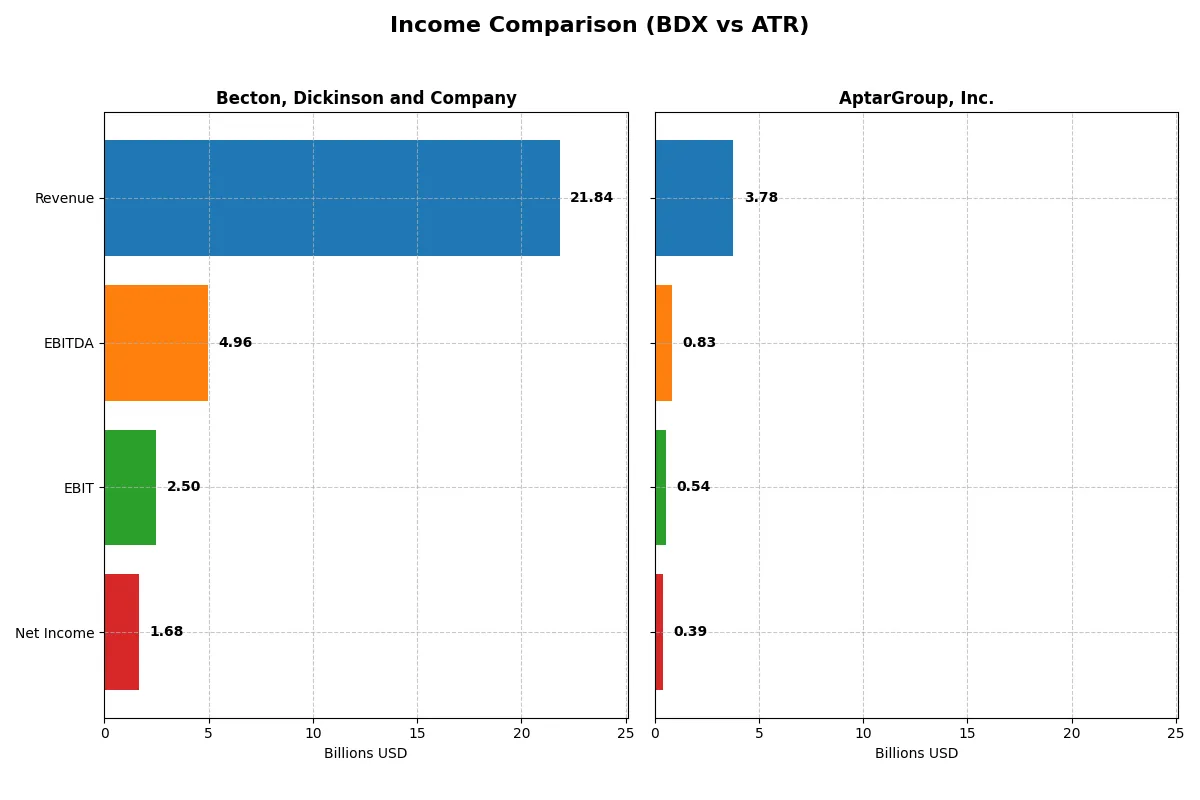
The following data dissects the core profitability and scalability of both corporate engines to reveal who dominates the bottom line:
| Metric | Becton, Dickinson and Company (BDX) | AptarGroup, Inc. (ATR) |
|---|---|---|
| Revenue | 21.8B | 3.78B |
| Cost of Revenue | 11.9B | 2.66B |
| Operating Expenses | 7.35B | 606M |
| Gross Profit | 9.92B | 1.12B |
| EBITDA | 4.96B | 831M |
| EBIT | 2.50B | 544M |
| Interest Expense | 613M | 53M |
| Net Income | 1.68B | 393M |
| EPS | 5.84 | 5.97 |
| Fiscal Year | 2025 | 2025 |
Income Statement Analysis: The Bottom-Line Duel
This comparison reveals which company runs a more efficient and profitable business engine by examining revenue growth, margins, and net income trends.
Becton, Dickinson and Company Analysis
Becton, Dickinson (BDX) grew revenue steadily by 14% over five years, hitting $21.8B in 2025. Gross margin remains strong at 45.4%, but net margin slipped to 7.7%, reflecting margin pressure. Despite an 8% revenue rise in 2025, net income declined 1.6%, signaling rising costs and weakening profitability momentum.
AptarGroup, Inc. Analysis
AptarGroup (ATR) increased revenue 17% over five years, reaching $3.78B in 2025. Its gross margin contracted recently to 29.6%, yet EBIT margin stands healthier at 14.4%. Net income surged 61% overall, with 2025 showing a 5.4% revenue growth and a 6.5% EPS rise, indicating improving operational efficiency and stronger bottom-line momentum.
Margin Resilience vs. Growth Acceleration
BDX boasts higher gross margins but struggles with net income growth and margin compression. ATR shows more balanced margin improvement and exceptional net income growth. Aptar’s profile offers better earnings momentum, while BDX relies on scale with margin challenges. For investors prioritizing growth and profitability trends, Aptar presents a more compelling trajectory.
Financial Ratios Comparison
These vital ratios act as a diagnostic tool to expose the underlying fiscal health, valuation premiums, and capital efficiency of the companies compared below:
| Ratios | Becton, Dickinson and Company (BDX) | AptarGroup, Inc. (ATR) |
|---|---|---|
| ROE | 6.61% (2025) | 15.15% (2024) |
| ROIC | 4.73% (2025) | 10.68% (2024) |
| P/E | 31.97 (2025) | 20.41 (2025) |
| P/B | 2.11 (2025) | 0 (2025) |
| Current Ratio | 1.11 (2025) | 0 (2025) |
| Quick Ratio | 0.64 (2025) | 0 (2025) |
| D/E (Debt-to-Equity) | 0.76 (2025) | 0 (2025) |
| Debt-to-Assets | 34.7% (2025) | 0 (2025) |
| Interest Coverage | 4.21 (2025) | -9.50 (2025) |
| Asset Turnover | 0.39 (2025) | 0 (2025) |
| Fixed Asset Turnover | 3.12 (2025) | 0 (2025) |
| Payout ratio | 71.3% (2025) | 30.6% (2025) |
| Dividend yield | 2.23% (2025) | 1.50% (2025) |
| Fiscal Year | 2025 | 2025 |
Efficiency & Valuation Duel: The Vital Signs
Financial ratios act as the company’s DNA, revealing hidden risks and operational excellence that raw numbers alone cannot convey.
Becton, Dickinson and Company
Becton Dickinson shows moderate profitability with a 6.61% ROE, slightly below ideal benchmarks. Its P/E ratio of 31.97 signals a stretched valuation, suggesting the stock trades at a premium. The company supports shareholders with a 2.23% dividend yield, balancing modest returns with reinvestment in R&D (5.79% revenue), indicating a growth focus.
AptarGroup, Inc.
AptarGroup reports a higher net margin at 10.4% but lacks reported ROE and ROIC metrics, which raises transparency concerns. Its P/E ratio of 20.41 is more neutral, reflecting fair valuation. Shareholder returns include a modest 1.5% dividend yield, while R&D investment stands at a significant 16.06% of revenue, signaling aggressive reinvestment for future growth.
Valuation Stretch vs. Growth Reinvestment
Becton Dickinson carries a premium valuation with moderate returns and steady dividends, while AptarGroup offers stronger margins and growth-oriented reinvestment but lacks key profitability ratios. Aptar fits investors seeking growth potential, whereas Becton Dickinson suits those valuing income with cautious risk exposure.
Which one offers the Superior Shareholder Reward?
I observe that Becton, Dickinson and Company (BDX) delivers a higher dividend yield around 2.23% with a payout ratio near 71%, indicating strong income return but with less free cash flow safety. AptarGroup, Inc. (ATR) yields about 1.5%, with a lower 30% payout ratio, signaling more retained capital for growth or acquisitions. BDX’s buyback activity is notable but less documented here; ATR’s buybacks appear moderate, supporting shareholder returns alongside dividends. I favor BDX for income-focused investors due to its consistent dividends, but ATR’s leaner payout and reinvestment focus offer superior long-term growth potential. For 2026, I conclude BDX provides a more attractive total return profile given its sustainable distribution and steady free cash flow coverage.
Comparative Score Analysis: The Strategic Profile
The radar chart reveals the fundamental DNA and trade-offs of Becton, Dickinson and Company and AptarGroup, Inc., highlighting their financial strengths and weaknesses:
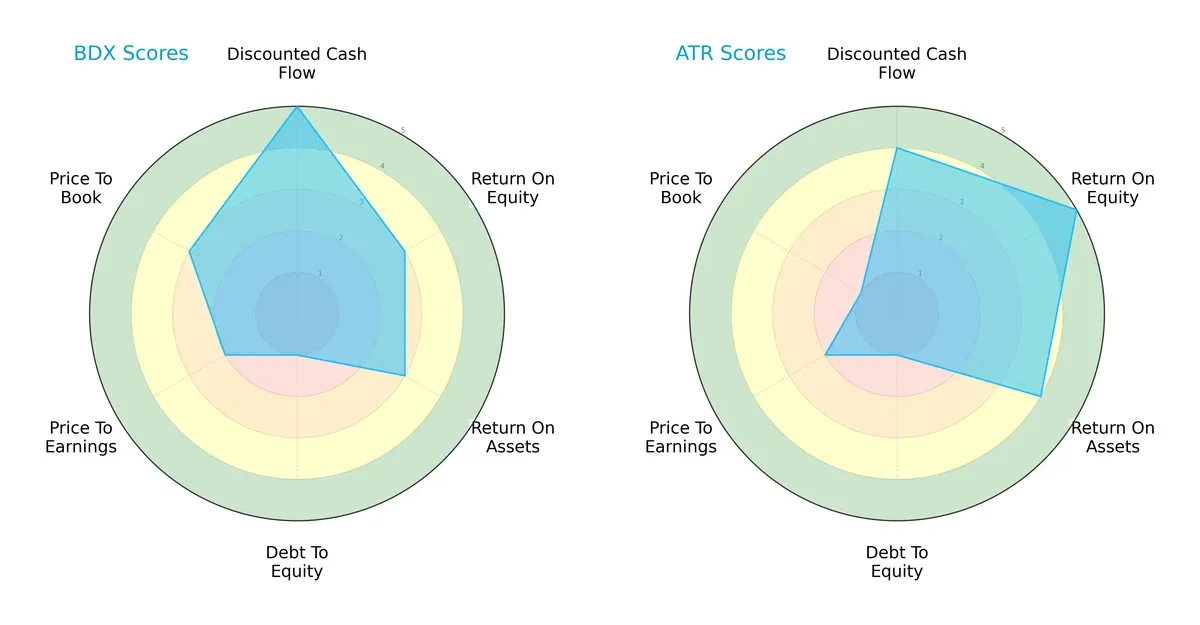
Becton, Dickinson excels in discounted cash flow with a top score of 5 but struggles with debt, scoring a very unfavorable 1. AptarGroup shows superior profitability metrics—ROE at 5 and ROA at 4—and has a more favorable DCF score of 4. Both suffer from weak debt-to-equity profiles, but Becton, Dickinson offers a more balanced valuation with moderate P/B and P/E scores. AptarGroup relies heavily on its profitability edge, while Becton, Dickinson’s strength lies in cash flow generation.
Bankruptcy Risk: Solvency Showdown
The Altman Z-Score gap reveals contrasting solvency outlooks for the two firms in this cycle:
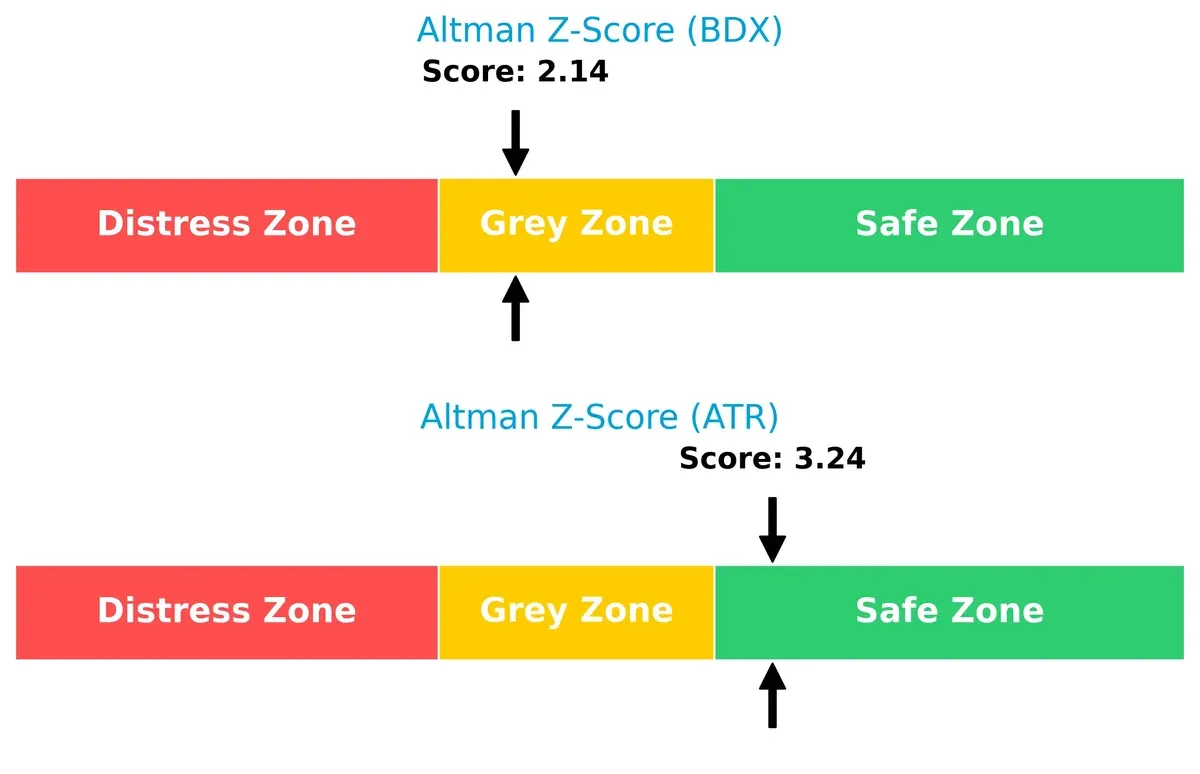
AptarGroup’s score of 3.24 places it firmly in the safe zone, signaling strong long-term survival prospects. Becton, Dickinson’s 2.14 score falls in the grey zone, indicating moderate bankruptcy risk and financial caution required.
Financial Health: Quality of Operations
Piotroski F-Scores highlight operational quality and internal financial health differences:
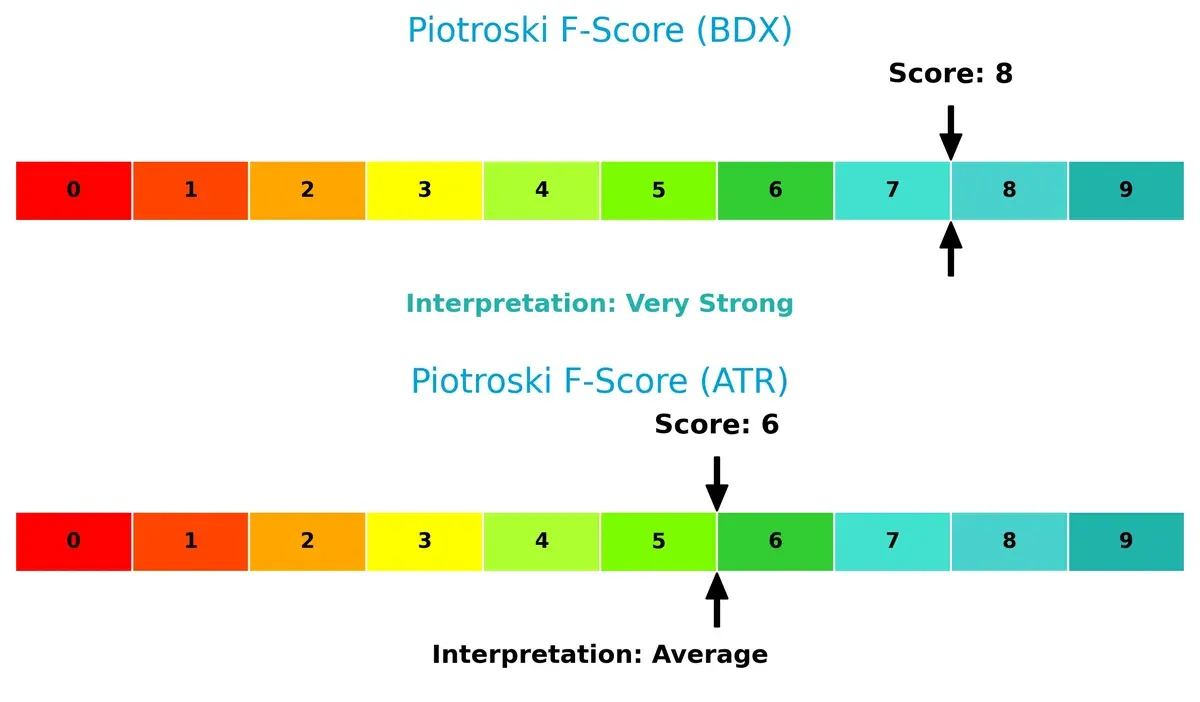
Becton, Dickinson’s strong score of 8 reflects robust profitability and efficiency, signaling peak financial health. AptarGroup’s average score of 6 suggests some internal financial weaknesses, warranting closer scrutiny despite better solvency.
How are the two companies positioned?
This section dissects the operational DNA of BDX and ATR by comparing revenue distribution and internal dynamics. The goal is to confront their economic moats to identify the most resilient and sustainable competitive advantage in today’s market.
Revenue Segmentation: The Strategic Mix
This visual comparison dissects how Becton, Dickinson and Company and AptarGroup, Inc. diversify their income streams and where their primary sector bets lie:
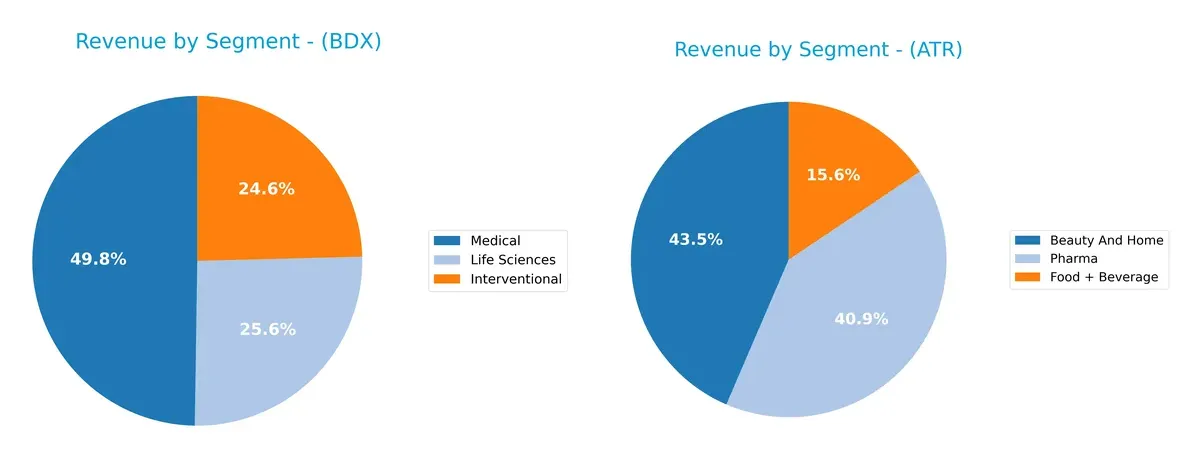
Becton, Dickinson and Company anchors revenue in its Medical segment with $10B in 2024, followed by Life Sciences at $5.2B and Interventional at $5B. This mix shows solid diversification across healthcare verticals. AptarGroup, Inc. pivots heavily on Beauty And Home at $1.46B, with Pharma close behind at $1.37B and Food + Beverage at $524M, indicating a more balanced portfolio but with less scale. BDX’s dominance in Medical signals infrastructure lock-in, while ATR’s spread reduces concentration risk but lacks a single powerhouse segment.
Strengths and Weaknesses Comparison
This table compares the strengths and weaknesses of Becton, Dickinson and Company (BDX) and AptarGroup, Inc. (ATR) based on diversification, profitability, financial statement, innovation, global presence, and market share:
BDX Strengths
- Diversified revenue across Interventional, Life Sciences, and Medical segments
- Strong U.S. market presence with $11.7B revenue
- Favorable fixed asset turnover and dividend yield
- Debt levels and interest coverage at neutral status
ATR Strengths
- Favorable net margin at 10.4%
- Strong interest coverage at 10.32x
- Favorable debt to equity and debt to assets ratios
- Diverse product segments in Beauty, Food & Beverage, and Pharma
- Global presence across U.S., Europe, and Asia with growing revenues
BDX Weaknesses
- Unfavorable ROE and ROIC indicating weak capital efficiency
- Unfavorable quick ratio and asset turnover suggest liquidity and asset use issues
- High P/E ratio at 31.97 may imply overvaluation
- Slightly unfavorable overall financial ratios opinion
ATR Weaknesses
- Zero ROE and ROIC highlight profitability challenges
- Unfavorable current and quick ratios indicate liquidity risks
- Unfavorable asset and fixed asset turnover metrics
- Neutral dividend yield and zero P/B value may concern investors
BDX exhibits broad diversification and a solid U.S. footprint but faces capital efficiency and liquidity challenges. ATR shows strong profitability margins and conservative leverage but struggles with asset utilization and liquidity, affecting its overall financial balance.
The Moat Duel: Analyzing Competitive Defensibility
A structural moat is the only barrier protecting long-term profits from relentless competitive erosion. Let’s examine how Becton, Dickinson and Company and AptarGroup, Inc. defend their turf:
Becton, Dickinson and Company: Intangible Assets and Product Breadth
BDX’s moat stems from its extensive portfolio of medical devices and diagnostic products. This manifests as stable margins around 7.7% net and a slightly growing ROIC, signaling improving profitability. New product innovations and global expansion in emerging markets could deepen its moat in 2026.
AptarGroup, Inc.: Cost Advantage and Specialized Dispensing Solutions
ATR relies on manufacturing efficiencies and specialized pharma and consumer packaging solutions to maintain its cost advantage. Despite solid net margins near 10.4%, its declining ROIC and value destruction trend sharply contrast BDX. Future growth hinges on scaling partnerships and entering digital health applications.
Profitability Stability vs. Cost Efficiency: Who Holds the Moat Edge?
BDX exhibits a wider and more sustainable moat with improving ROIC and diversified revenue streams. ATR’s shrinking ROIC and value destruction undermine its competitive position. I see BDX better equipped to defend and grow its market share through innovation and global reach.
Which stock offers better returns?
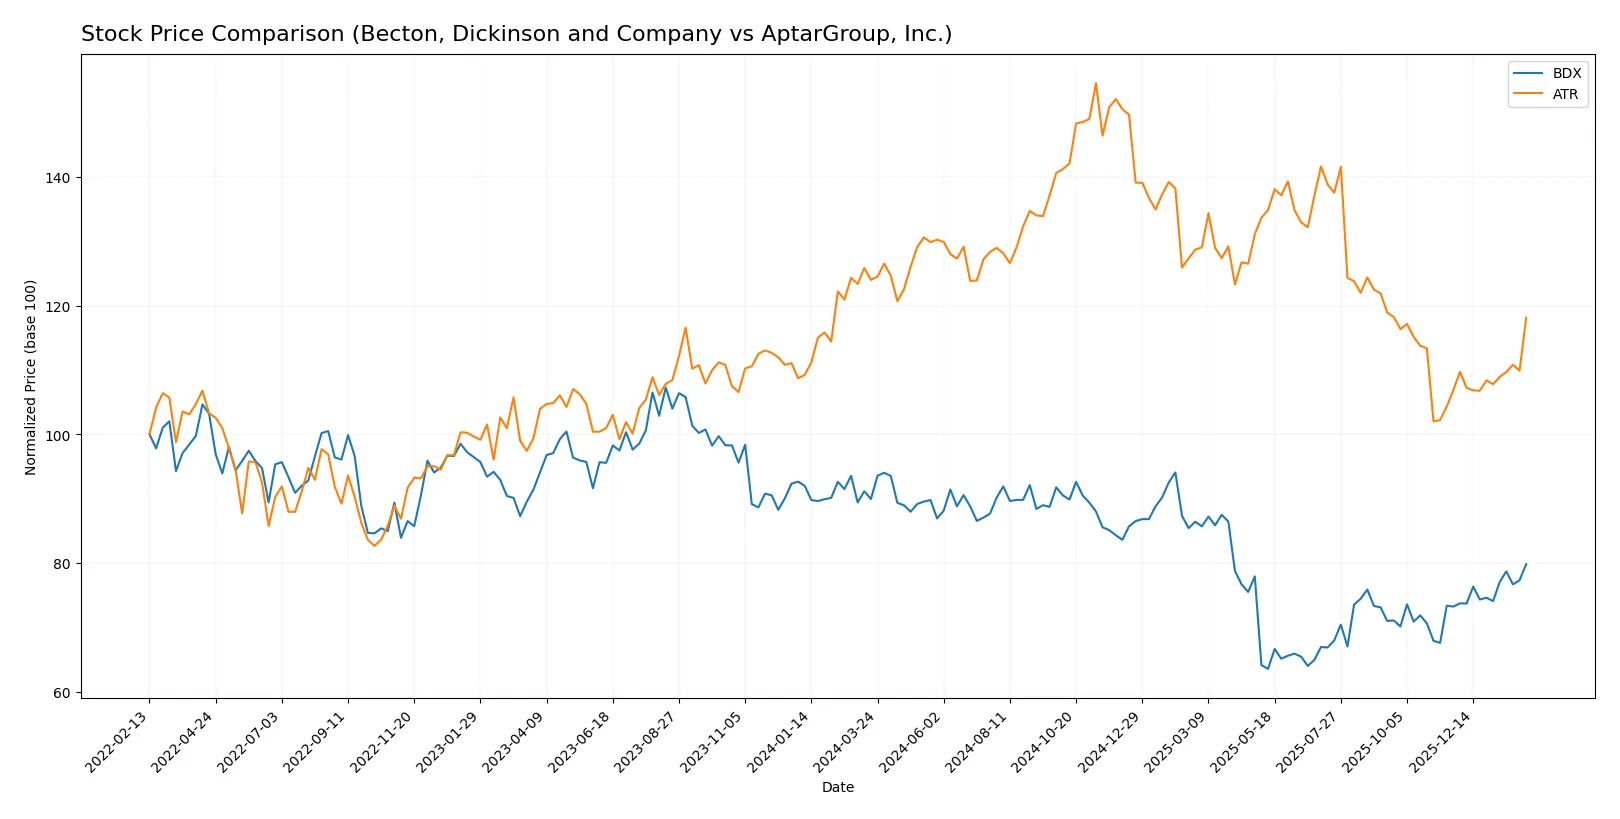
Over the past year, both Becton, Dickinson and Company and AptarGroup, Inc. showed bearish trends with accelerating declines, followed by recent positive price recoveries starting late 2025.
Trend Comparison
Becton, Dickinson and Company’s stock declined 11.28% over the past year, showing an accelerating bearish trend with a high volatility of 24.49%. It rebounded 8.98% recently.
AptarGroup, Inc.’s stock fell 4.74% over the past year, also with accelerating bearish momentum but lower volatility at 13.76%. It gained 10.53% in the latest period.
Both stocks experienced accelerating declines over the year, but AptarGroup’s smaller loss and stronger recent rebound delivered comparatively better market performance.
Target Prices
Analysts offer a clear consensus on target prices for Becton, Dickinson and Company and AptarGroup, Inc.
| Company | Target Low | Target High | Consensus |
|---|---|---|---|
| Becton, Dickinson and Company | 205 | 215 | 210 |
| AptarGroup, Inc. | 133 | 220 | 166 |
Becton, Dickinson trades near its consensus target, indicating limited upside. AptarGroup shows a wider range, suggesting greater uncertainty but potential growth above the current 134 price.

Don’t Let Luck Decide Your Entry Point
Optimize your entry points with our advanced ProRealTime indicators. You’ll get efficient buy signals with precise price targets for maximum performance. Start outperforming now!
How do institutions grade them?
This section compares the latest institutional grades assigned to both companies:
Becton, Dickinson and Company Grades
The following table lists recent grades from reputable financial institutions for Becton, Dickinson and Company.
| Grading Company | Action | New Grade | Date |
|---|---|---|---|
| Piper Sandler | Maintain | Neutral | 2026-01-28 |
| Stifel | Maintain | Buy | 2026-01-07 |
| B of A Securities | Maintain | Neutral | 2026-01-05 |
| RBC Capital | Maintain | Sector Perform | 2025-12-17 |
| Morgan Stanley | Maintain | Overweight | 2025-12-02 |
AptarGroup, Inc. Grades
The table below shows recent grades from credible institutions for AptarGroup, Inc.
| Grading Company | Action | New Grade | Date |
|---|---|---|---|
| Wells Fargo | Downgrade | Equal Weight | 2026-01-06 |
| Baird | Maintain | Outperform | 2025-11-03 |
| Wells Fargo | Maintain | Overweight | 2025-11-03 |
| Raymond James | Maintain | Outperform | 2025-08-04 |
| Wells Fargo | Maintain | Overweight | 2025-09-10 |
Which company has the best grades?
Becton, Dickinson and Company’s grades cluster around Neutral to Overweight, while AptarGroup mostly holds Outperform and Overweight ratings, with a recent downgrade. AptarGroup’s generally higher grades suggest stronger analyst conviction, potentially influencing investor confidence and valuation.
Risks specific to each company
The following categories identify critical pressure points and systemic threats facing Becton, Dickinson and Company (BDX) and AptarGroup, Inc. (ATR) in the complex 2026 market environment:
1. Market & Competition
Becton, Dickinson and Company
- Operates in highly competitive medical supplies sector with moderate net margin (7.68%) and neutral growth outlook.
AptarGroup, Inc.
- Faces niche competition in dispensing and sealing solutions with higher net margin (10.4%) but limited ROE and ROIC visibility.
2. Capital Structure & Debt
Becton, Dickinson and Company
- Debt-to-assets moderate at 34.67%, interest coverage at 4.07x; debt-to-equity neutral but with some leverage risk.
AptarGroup, Inc.
- Displays very favorable debt profile with low leverage and strong interest coverage of 10.32x, indicating robust capital structure.
3. Stock Volatility
Becton, Dickinson and Company
- Exhibits very low beta (0.285), indicating low stock volatility and defensive market position.
AptarGroup, Inc.
- Slightly higher beta (0.48) but still below market average, suggesting moderate volatility in line with sector.
4. Regulatory & Legal
Becton, Dickinson and Company
- Operates in heavily regulated healthcare industry, facing ongoing compliance costs and litigation risks.
AptarGroup, Inc.
- Also subject to regulatory scrutiny in pharma and consumer health segments, but less exposure than BDX.
5. Supply Chain & Operations
Becton, Dickinson and Company
- Complex global supply chain with 70K employees; risks include disruptions and raw material costs.
AptarGroup, Inc.
- Smaller workforce (13K) and diversified product lines reduce but do not eliminate supply chain vulnerabilities.
6. ESG & Climate Transition
Becton, Dickinson and Company
- Increasing pressure to meet ESG standards; waste management and product safety remain key challenges.
AptarGroup, Inc.
- Strategic partnership on recycled materials signals proactive approach but climate transition risks persist.
7. Geopolitical Exposure
Becton, Dickinson and Company
- Global footprint exposes BDX to geopolitical tensions, especially in emerging markets and trade policies.
AptarGroup, Inc.
- Geographically diversified with less direct exposure, but still vulnerable to international supply chain disruptions.
Which company shows a better risk-adjusted profile?
BDX’s largest risk lies in its moderate leverage and operational complexity amid regulatory pressures. ATR’s main concern is its weak profitability metrics despite a strong capital base. ATR’s superior Altman Z-Score and debt management reflect a safer financial position. However, BDX’s defensive stock volatility and strong Piotroski score indicate resilience. Overall, ATR holds a slightly better risk-adjusted profile due to lower financial distress risk and robust interest coverage. The recent surge in ATR’s stock price (+8.3%) highlights market confidence despite profitability uncertainties, warranting watchful risk management.
Final Verdict: Which stock to choose?
Becton, Dickinson and Company (BDX) showcases a robust operational backbone with its growing return on invested capital. Its superpower lies in steadily enhancing profitability despite sector headwinds. A point of vigilance is its moderate leverage, which could pressure returns if interest rates rise. BDX suits portfolios targeting steady, slightly conservative growth.
AptarGroup, Inc. (ATR) stands out with a strategic moat built on recurring revenue and superior interest coverage. Its efficient capital structure offers better financial safety than BDX, despite weaker capital reinvestment metrics. ATR fits investors seeking GARP (Growth at a Reasonable Price) exposure, blending moderate growth with defensive qualities.
If you prioritize resilient value creation and improving operational efficiency, BDX is the compelling choice due to its upward ROIC trend. However, if you seek a safer balance sheet with steady income streams and growth potential, ATR offers better stability and financial resilience. Both present unique scenarios that merit consideration aligned with your risk tolerance and investment horizon.
Disclaimer: Investment carries a risk of loss of initial capital. The past performance is not a reliable indicator of future results. Be sure to understand risks before making an investment decision.
Go Further
I encourage you to read the complete analyses of Becton, Dickinson and Company and AptarGroup, Inc. to enhance your investment decisions: