Home > Comparison > Healthcare > BAX vs ATR
The strategic rivalry between Baxter International Inc. and AptarGroup, Inc. shapes the healthcare instruments and supplies sector. Baxter operates as a diversified medical products provider with a broad clinical portfolio. AptarGroup focuses on specialized dispensing and sealing solutions across pharma and consumer markets. This analysis pits Baxter’s scale and integration against AptarGroup’s niche innovation to identify which offers superior risk-adjusted returns for a balanced portfolio.
Table of contents
Companies Overview
Baxter International and AptarGroup both hold significant positions in the medical instruments and supplies sector.
Baxter International Inc.: Global Healthcare Solutions Leader
Baxter International dominates the healthcare products market with a diverse portfolio including dialysis, infusion therapies, and critical care devices. Its revenue engine centers on delivering advanced medical devices and connected care solutions worldwide. In 2026, Baxter focuses strategically on expanding integrated patient monitoring and digital health technologies to enhance clinical outcomes.
AptarGroup, Inc.: Innovative Dispensing & Material Sciences Provider
AptarGroup specializes in dispensing, sealing, and material science solutions across pharma, beauty, and food markets. Its core revenue comes from pumps and valves tailored for respiratory and injectable pharmaceuticals alongside consumer products. In 2026, Aptar emphasizes sustainability through partnerships developing ultra-pure recycled materials and digital therapy platforms.
Strategic Collision: Similarities & Divergences
Both firms operate in healthcare-related segments but differ in scope—Baxter pursues a broad clinical solutions strategy while Aptar focuses on specialized dispensing technology. Their primary battleground lies in innovation-driven medical device markets. Investors should note Baxter’s expansive healthcare ecosystem contrasts sharply with Aptar’s niche material science expertise and sustainability-driven growth profile.
Income Statement Comparison
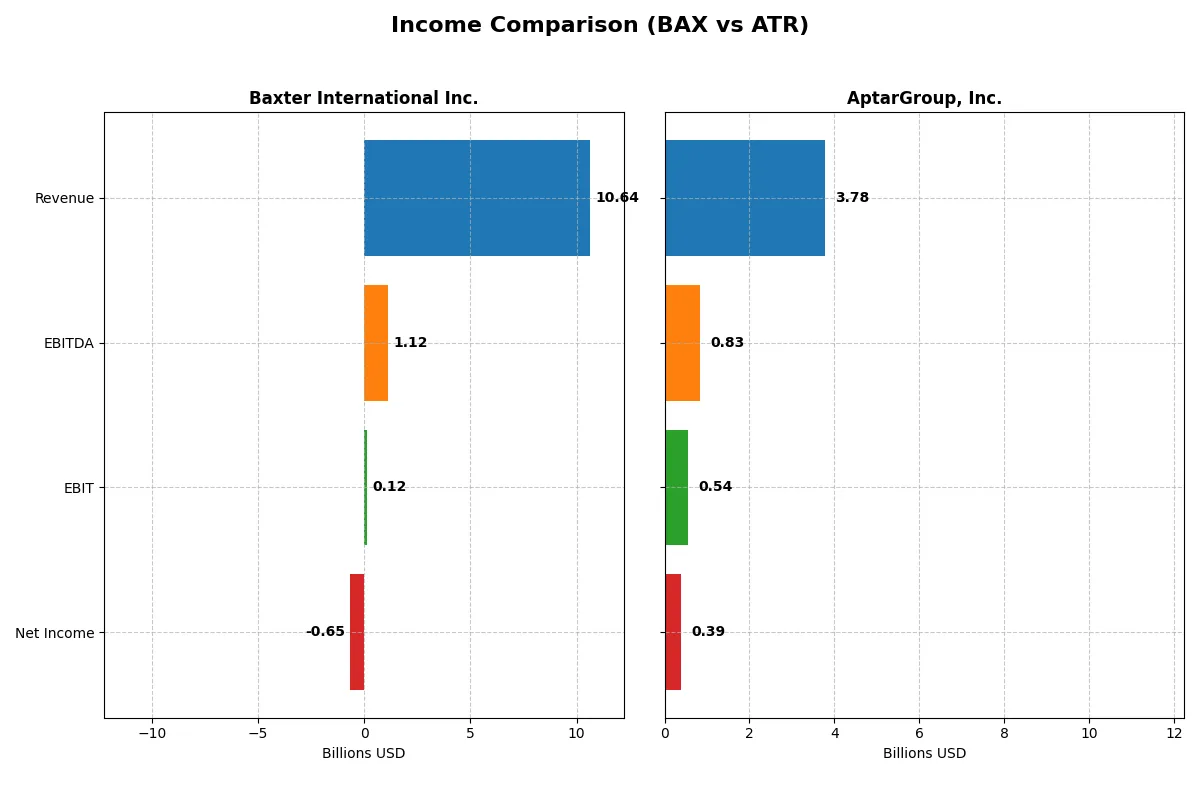
The following data dissects the core profitability and scalability of both corporate engines to reveal who dominates the bottom line:
| Metric | Baxter International Inc. (BAX) | AptarGroup, Inc. (ATR) |
|---|---|---|
| Revenue | 10.64B | 3.58B |
| Cost of Revenue | 6.65B | 2.23B |
| Operating Expenses | 3.97B | 859M |
| Gross Profit | 3.98B | 1.36B |
| EBITDA | 1.12B | 777M |
| EBIT | 119M | 514M |
| Interest Expense | 408M | 44M |
| Net Income | -649M | 375M |
| EPS | -1.27 | 5.65 |
| Fiscal Year | 2024 | 2024 |
Income Statement Analysis: The Bottom-Line Duel
This income statement comparison reveals which company operates more efficiently and sustains profitability under current market conditions.
Baxter International Inc. Analysis
Baxter’s revenue shows a slight growth of 2.7% in 2024 but net income plunges sharply to a -$649M loss, reversing a strong $2.66B profit in 2023. Gross margins remain solid at 37.5%, but net margins collapse to -6.1%. The steep EBIT decline signals deteriorating operational efficiency and margin pressure.
AptarGroup, Inc. Analysis
AptarGroup’s revenue climbs steadily by 5.4% to $3.78B in 2025 with net income rising to $393M. Gross margin is healthy at 29.6%, complemented by a robust EBIT margin of 14.4%. The company maintains strong profitability momentum, improving EPS by 6.5%, reflecting disciplined cost control and consistent operating leverage.
Margin Resilience vs. Profit Recovery
AptarGroup outperforms Baxter in profitability and margin stability despite lower revenue scale. Baxter’s income volatility and negative net margin highlight operational challenges, while AptarGroup’s consistent growth and margin expansion mark it as the clearer fundamental winner. Investors seeking steady profit growth should favor AptarGroup’s profile.
Financial Ratios Comparison
These vital ratios serve as a diagnostic tool to expose the underlying fiscal health, valuation premiums, and capital efficiency of the companies compared below:
| Ratios | Baxter International Inc. (BAX) | AptarGroup, Inc. (ATR) |
|---|---|---|
| ROE | -9.3% (2024) | 15.2% (2024) |
| ROIC | 0.06% (2024) | 10.7% (2024) |
| P/E | -22.9 (2024) | 27.8 (2024) |
| P/B | 2.14 (2024) | 4.22 (2024) |
| Current Ratio | 1.36 (2024) | 1.38 (2024) |
| Quick Ratio | 1.05 (2024) | 0.95 (2024) |
| D/E | 1.93 (2024) | 0.44 (2024) |
| Debt-to-Assets | 52.2% (2024) | 24.3% (2024) |
| Interest Coverage | 0.03 (2024) | 11.3 (2024) |
| Asset Turnover | 0.41 (2024) | 0.81 (2024) |
| Fixed Asset Turnover | 3.35 (2024) | 2.37 (2024) |
| Payout ratio | -90.9% (2024) | 30.5% (2024) |
| Dividend yield | 3.97% (2024) | 1.09% (2024) |
| Fiscal Year | 2024 | 2024 |
Efficiency & Valuation Duel: The Vital Signs
Financial ratios act as the company’s DNA, exposing hidden risks and operational strengths essential for investment analysis.
Baxter International Inc.
Baxter shows unfavorable profitability with a negative ROE of -9.32% and a net margin of -6.1%, signaling operational challenges. Valuation metrics appear favorable with a negative P/E of -22.91, indicating a market discount. The 3.97% dividend yield reflects solid shareholder returns despite profitability issues, balancing income with reinvestment needs.
AptarGroup, Inc.
Aptar posts a favorable net margin of 10.4% but an ROE of 0%, suggesting limited equity efficiency. Its P/E ratio at 20.41 is neutral, indicating fair valuation. The modest 1.5% dividend yield hints at cautious shareholder returns, while favorable debt metrics and strong interest coverage suggest financial stability.
Profitability Drag vs. Balanced Stability
Baxter’s high dividend yield contrasts its poor profitability and stretched debt levels, risking operational fragility. Aptar offers steadier margins and healthier leverage but with lower shareholder payouts. Investors prioritizing income might lean Baxter’s profile, while those favoring financial stability may find Aptar better suited.
Which one offers the Superior Shareholder Reward?
I compare Baxter International Inc. (BAX) and AptarGroup, Inc. (ATR) focusing on dividends, payout ratios, and buybacks. BAX yields 3.97% with a negative payout ratio due to recent losses, signaling an unsustainable dividend despite a 0.55 FCF coverage. ATR yields 1.5% with a prudent 30% payout, supported by steady free cash flow and strong operating margins. BAX’s buyback intensity is unclear but high leverage (debt/equity 1.93) raises risk. ATR maintains moderate debt and consistent buybacks, enhancing total shareholder return sustainably. I conclude ATR offers a more attractive and durable shareholder reward in 2026.
Comparative Score Analysis: The Strategic Profile
The radar chart reveals the fundamental DNA and trade-offs of Baxter International Inc. and AptarGroup, Inc., highlighting their strategic strengths and vulnerabilities:
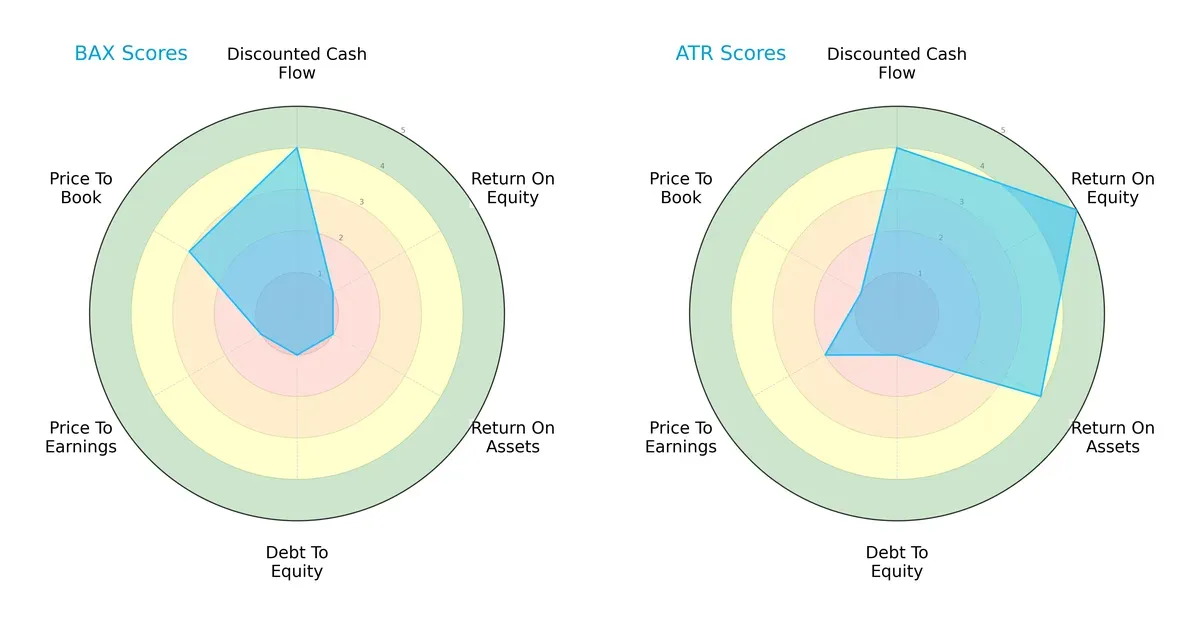
AptarGroup boasts superior operational efficiency, scoring high in ROE (5) and ROA (4), signaling robust profitability and asset use. Baxter International, conversely, struggles with profitability metrics (ROE and ROA both at 1). Both firms share a strong discounted cash flow score (4), but Aptar’s valuation metrics (P/E at 2, P/B at 1) suggest less attractive pricing compared to Baxter’s moderate price-to-book score (3). Baxter’s debt-to-equity score (1) indicates higher leverage risk, making Aptar’s profile more balanced despite its weak balance sheet.
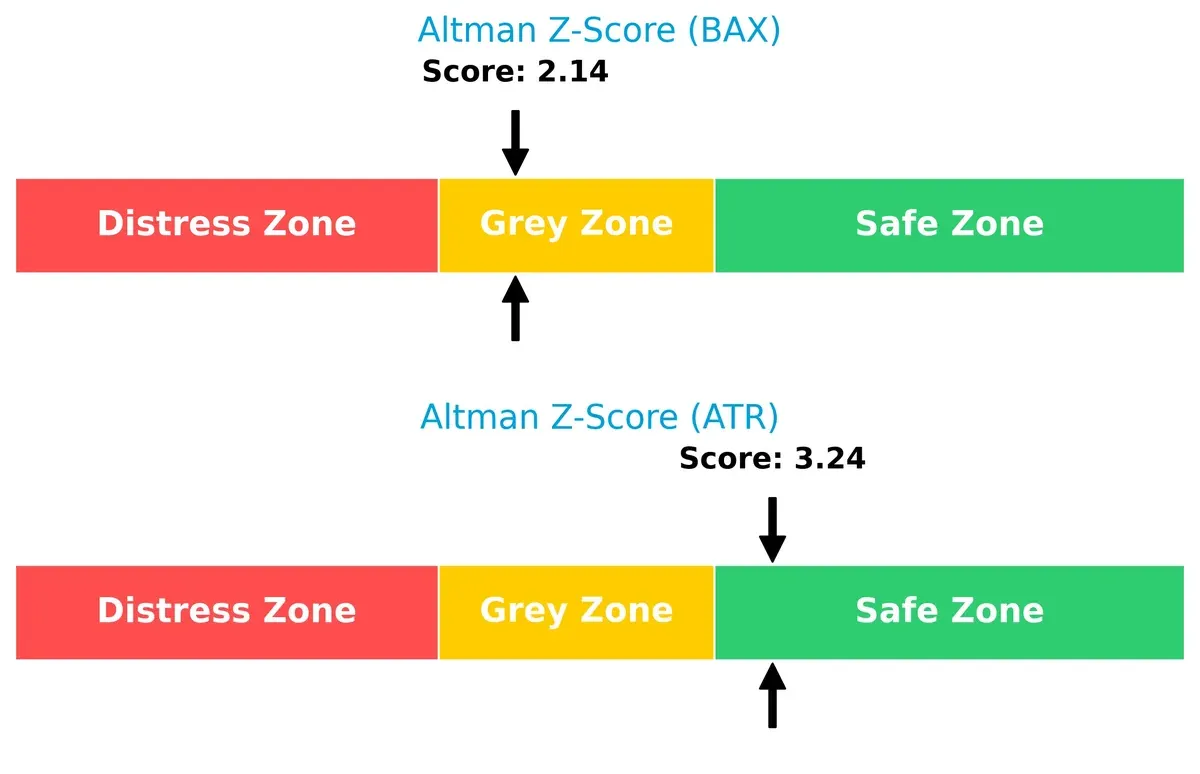
Bankruptcy Risk: Solvency Showdown
AptarGroup’s Altman Z-Score at 3.24 places it safely above the distress threshold, reflecting strong solvency. Baxter’s 2.14 score situates it in the grey zone, implying moderate bankruptcy risk amid current market cycles:
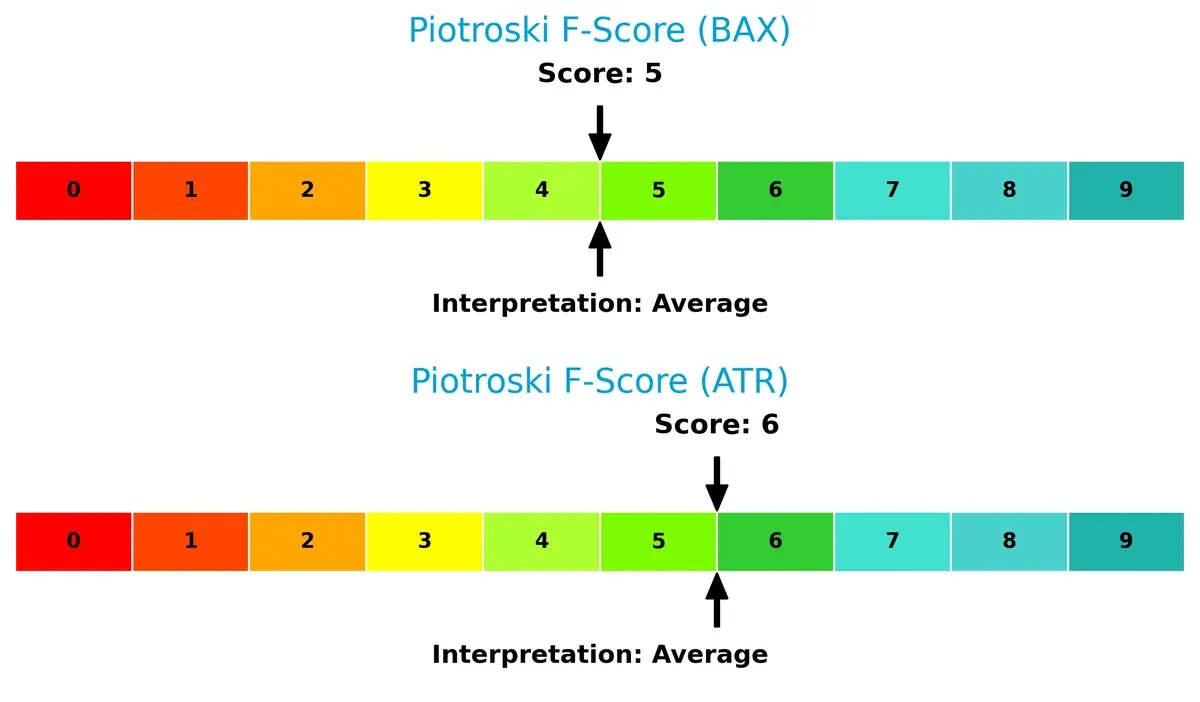
Financial Health: Quality of Operations
Both Baxter and AptarGroup score in the average range for Piotroski F-Score, with Aptar slightly ahead at 6 versus Baxter’s 5. This suggests Aptar maintains marginally stronger internal financial health, while Baxter shows no immediate red flags but lacks robustness:
How are the two companies positioned?
This section dissects the operational DNA of Baxter and Aptar by comparing their revenue distribution by segment and internal dynamics. The final goal is to confront their economic moats to identify which business model offers the most resilient, sustainable competitive advantage today.
Revenue Segmentation: The Strategic Mix
This visual comparison dissects how Baxter International Inc. and AptarGroup, Inc. diversify their income streams and where their primary sector bets lie:
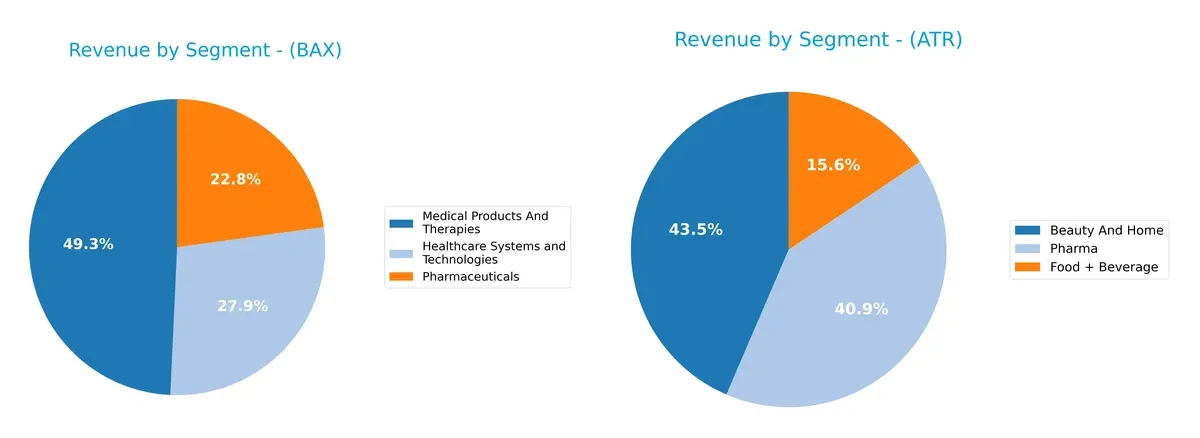
Baxter leans on a balanced mix with Medical Products and Therapies at $5.2B, Healthcare Systems at $2.95B, and Pharmaceuticals at $2.41B in 2024. AptarGroup centers revenue more narrowly, with Beauty and Home dominating at $1.46B, followed by Pharma at $1.37B. Baxter’s diversification reduces concentration risk and supports ecosystem lock-in, while Aptar’s focus signals infrastructure dominance but higher vulnerability to sector-specific shifts.
Strengths and Weaknesses Comparison
This table compares the Strengths and Weaknesses of Baxter International Inc. and AptarGroup, Inc.:
Baxter International Inc. Strengths
- Diversified product segments with Healthcare, Medical, and Pharmaceuticals
- Strong global presence with significant US and international revenue
- Favorable fixed asset turnover and dividend yield
- WACC below ROIC indicating efficient capital use
AptarGroup, Inc. Strengths
- Positive net margin and strong interest coverage ratio
- Favorable debt metrics with low leverage
- Diverse product range in Beauty, Food, Pharma
- Solid global presence including US and Europe
- Neutral P/E reflects market stability
Baxter International Inc. Weaknesses
- Negative profitability ratios including net margin and ROE
- High debt-to-assets ratio and weak interest coverage
- Low asset turnover impacting efficiency
- Elevated debt/equity ratio signals financial risk
AptarGroup, Inc. Weaknesses
- Zero ROE and ROIC signaling weak profitability
- Unfavorable liquidity ratios including current and quick ratio
- Asset turnover and fixed asset turnover unfavorable
- Moderate dividend yield may limit income appeal
Both companies showcase diversification and global reach but differ sharply in profitability and financial health. Baxter’s leverage and profitability challenges contrast with AptarGroup’s liquidity and return on capital concerns, shaping distinct strategic focuses.
The Moat Duel: Analyzing Competitive Defensibility
A structural moat is the only true shield preserving long-term profits from relentless competitive pressure and market disruption:
Baxter International Inc.: Intangible Assets with Global Reach
Baxter’s moat lies in its broad portfolio of patented medical devices and therapies, reflected in stable gross margins near 37%. However, declining ROIC signals weakening capital efficiency. Expansion into connected care tech may deepen its moat if execution improves.
AptarGroup, Inc.: Specialized Dispensing Solutions and Innovation
AptarGroup’s moat centers on its proprietary dispensing technologies serving pharma and consumer markets, delivering a strong 14% EBIT margin and growing net income. Its innovation pipeline and sustainability focus offer robust growth pathways distinct from Baxter’s healthcare device portfolio.
Moat Strength: Patents vs. Product Specialization
Both firms show deteriorating ROIC trends, indicating value erosion. Yet, AptarGroup’s superior margin stability and revenue growth suggest a deeper moat. AptarGroup is better positioned to defend market share through ongoing innovation and diversified end markets.
Which stock offers better returns?
The past year reveals contrasting price dynamics between Baxter International Inc. and AptarGroup, Inc., highlighting steep declines tempered by recent upward momentum for both stocks.
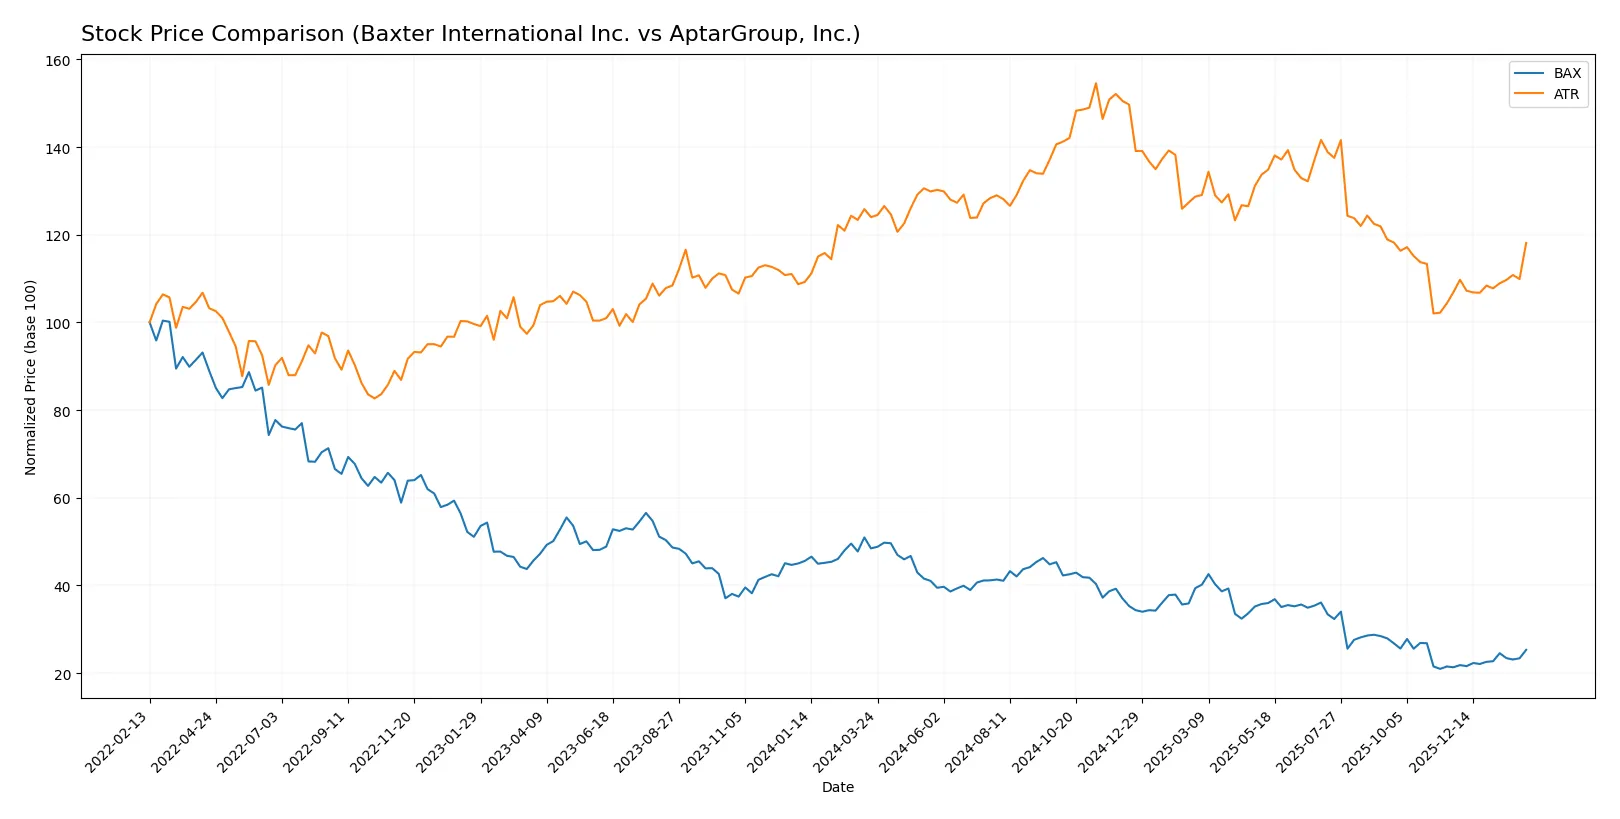
Trend Comparison
Baxter International Inc. shows a 47.78% price decline over the past 12 months, marking a bearish trend with accelerating losses. The stock ranged from a high of 42.74 to a low of 18.0, with recent recovery gaining 18.68%.
AptarGroup, Inc. experienced a milder 4.74% drop over the same period, maintaining a bearish yet accelerating trend. It fluctuated between 175.76 and 116.01, with recent gains of 10.53% indicating a partial rebound.
Comparing both, Baxter’s sharper decline contrasts with AptarGroup’s moderate loss, but Baxter’s recent stronger recovery suggests higher short-term market performance.
Target Prices
Analysts project a moderate to strong upside for Baxter International Inc. and AptarGroup, Inc.
| Company | Target Low | Target High | Consensus |
|---|---|---|---|
| Baxter International Inc. | 15 | 30 | 22.6 |
| AptarGroup, Inc. | 133 | 220 | 166 |
Baxter’s target consensus of 22.6 suggests a slight upside from the current 21.73 price. AptarGroup’s consensus at 166 implies significant growth potential beyond its current 134.31 price.

Don’t Let Luck Decide Your Entry Point
Optimize your entry points with our advanced ProRealTime indicators. You’ll get efficient buy signals with precise price targets for maximum performance. Start outperforming now!
How do institutions grade them?
The following tables summarize the latest grades assigned by reputable financial institutions for both companies:
Baxter International Inc. Grades
This table lists recent grades from leading analysts on Baxter International Inc.:
| Grading Company | Action | New Grade | Date |
|---|---|---|---|
| Barclays | Maintain | Overweight | 2026-01-09 |
| Morgan Stanley | Maintain | Underweight | 2025-12-02 |
| Argus Research | Downgrade | Hold | 2025-10-31 |
| UBS | Maintain | Neutral | 2025-10-31 |
| Citigroup | Maintain | Neutral | 2025-10-31 |
| Goldman Sachs | Maintain | Neutral | 2025-10-31 |
| Evercore ISI Group | Maintain | Outperform | 2025-10-07 |
| Barclays | Maintain | Overweight | 2025-08-04 |
| UBS | Maintain | Neutral | 2025-08-04 |
| Stifel | Downgrade | Hold | 2025-08-04 |
AptarGroup, Inc. Grades
This table presents the latest analyst grades for AptarGroup, Inc.:
| Grading Company | Action | New Grade | Date |
|---|---|---|---|
| Wells Fargo | Downgrade | Equal Weight | 2026-01-06 |
| Baird | Maintain | Outperform | 2025-11-03 |
| Wells Fargo | Maintain | Overweight | 2025-11-03 |
| Wells Fargo | Maintain | Overweight | 2025-09-10 |
| Wells Fargo | Maintain | Overweight | 2025-08-04 |
| Raymond James | Maintain | Outperform | 2025-08-04 |
| Wells Fargo | Maintain | Overweight | 2025-07-18 |
| Raymond James | Maintain | Outperform | 2025-07-15 |
| Wells Fargo | Maintain | Overweight | 2025-05-06 |
| Raymond James | Maintain | Outperform | 2025-04-22 |
Which company has the best grades?
AptarGroup consistently receives Outperform and Overweight ratings, with only one recent downgrade to Equal Weight. Baxter shows a wider range from Underweight to Outperform, with multiple Neutral and Hold grades. AptarGroup’s stronger consensus may suggest higher market confidence, influencing investor sentiment positively.
Risks specific to each company
The following categories identify the critical pressure points and systemic threats facing both firms in the 2026 market environment:
1. Market & Competition
Baxter International Inc.
- Faces pressure from medical device innovation and pricing competition in dialysis and critical care sectors.
AptarGroup, Inc.
- Competes in diverse segments, with strong pharma focus but exposed to shifting consumer trends in beauty and food markets.
2. Capital Structure & Debt
Baxter International Inc.
- High debt-to-equity ratio (1.93) and weak interest coverage (0.29) raise financial risk concerns.
AptarGroup, Inc.
- Exhibits low leverage with favorable debt metrics and strong interest coverage (10.32), indicating robust capital structure.
3. Stock Volatility
Baxter International Inc.
- Beta of 0.585 suggests moderate stock volatility, somewhat less sensitive than the market.
AptarGroup, Inc.
- Lower beta at 0.48 indicates less volatility, reflecting stability relative to market swings.
4. Regulatory & Legal
Baxter International Inc.
- Subject to stringent healthcare regulations globally, including product safety and reimbursement policies.
AptarGroup, Inc.
- Faces regulatory oversight in pharma packaging and environmental compliance, with increasing scrutiny on material sourcing.
5. Supply Chain & Operations
Baxter International Inc.
- Global supply chain complexity in critical care products may lead to disruptions and cost inflation.
AptarGroup, Inc.
- Supply chain exposed to raw material price volatility and dependence on manufacturing in multiple regions.
6. ESG & Climate Transition
Baxter International Inc.
- Increasing pressure to improve sustainability in manufacturing and product lifecycle management.
AptarGroup, Inc.
- Active partnerships targeting recycled materials and sustainable solutions support climate transition efforts.
7. Geopolitical Exposure
Baxter International Inc.
- Operations in ~100 countries expose it to currency fluctuations and geopolitical tensions, especially in emerging markets.
AptarGroup, Inc.
- International footprint across Asia, Europe, and Americas entails exposure to trade policies and geopolitical risks.
Which company shows a better risk-adjusted profile?
Baxter’s most significant risk is its strained capital structure, marked by high leverage and poor interest coverage, threatening financial flexibility. Aptar’s chief risk lies in regulatory and supply chain vulnerabilities amid evolving environmental standards and raw material dependencies. Aptar presents a better risk-adjusted profile, supported by safer debt metrics and lower stock volatility. Its recent surge in stock price (+8.3%) signals market confidence but warrants caution given debt concerns reflected in its moderate ratings. Baxter’s grey-zone Altman Z-score and unfavorable profitability ratios underscore elevated financial distress risk, demanding investor vigilance.
Final Verdict: Which stock to choose?
Baxter International Inc. (BAX) boasts a superpower in its resilient dividend yield and solid fixed asset turnover, reflecting operational steadiness despite recent profitability challenges. Its main point of vigilance lies in deteriorating returns and elevated debt levels, signaling caution. BAX may suit investors targeting income generation within a recovery-focused portfolio.
AptarGroup, Inc. (ATR) stands out with a strategic moat built on consistent net margin strength and a clean balance sheet, underscoring financial discipline and growth potential. Compared to BAX, ATR offers better stability and healthier cash flow dynamics. It aligns well with a GARP (Growth at a Reasonable Price) portfolio seeking balanced risk and reward.
If you prioritize reliable income and can tolerate cyclical headwinds, Baxter International presents a compelling scenario due to its dividend resilience and operational asset use. However, if you seek steadier growth and financial health, AptarGroup outshines with superior margin quality and balance sheet strength, albeit commanding a more moderate valuation. Both profiles warrant close monitoring for evolving fundamentals.
Disclaimer: Investment carries a risk of loss of initial capital. The past performance is not a reliable indicator of future results. Be sure to understand risks before making an investment decision.
Go Further
I encourage you to read the complete analyses of Baxter International Inc. and AptarGroup, Inc. to enhance your investment decisions: