In the dynamic world of technology, AppLovin Corporation (APP) and Workday, Inc. (WDAY) stand out as influential players in the software application sector. Both companies develop innovative platforms—AppLovin focuses on mobile app marketing and monetization, while Workday specializes in enterprise cloud applications for finance and human capital management. This comparison aims to identify which company offers the most compelling investment opportunity in 2026. Let’s explore their strengths and potential together.
Table of contents
Companies Overview
I will begin the comparison between AppLovin Corporation and Workday, Inc. by providing an overview of these two companies and their main differences.
AppLovin Corporation Overview
AppLovin Corporation operates a software platform aimed at mobile app developers to enhance app marketing and monetization globally. Its solutions include marketing software, analytics platforms, and in-app bidding technology. Founded in 2011 and based in Palo Alto, California, AppLovin serves advertisers, publishers, and internet platforms, positioning itself as a key player in mobile application software.
Workday, Inc. Overview
Workday, Inc. offers enterprise cloud applications designed to help organizations manage business operations, including financial management, human capital management, and analytics. Founded in 2005 and headquartered in Pleasanton, California, Workday serves various industries such as healthcare, education, and retail, focusing on operational efficiency and data-driven insights through cloud technology.
Key similarities and differences
Both AppLovin and Workday operate in the software application industry with a technology focus, serving clients internationally. AppLovin specializes in mobile app marketing and monetization platforms, while Workday concentrates on enterprise cloud applications for business management. Workforce size differs significantly, with Workday employing over 20K staff compared to AppLovin’s 1.5K, reflecting their distinct market scopes and operational models.
Income Statement Comparison
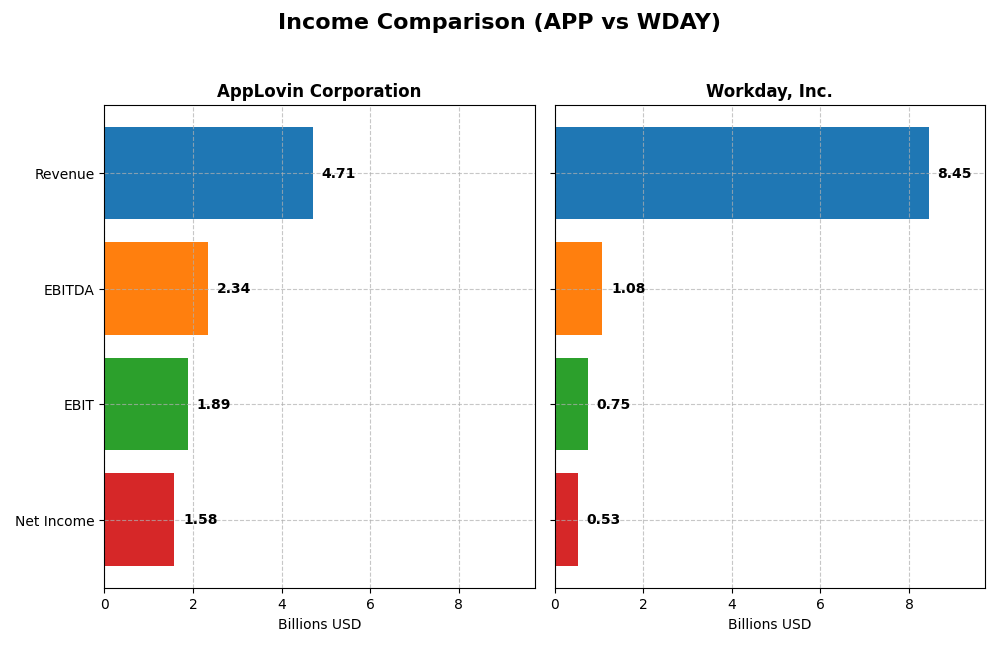
This table presents a side-by-side comparison of key income statement metrics for AppLovin Corporation and Workday, Inc. for their most recent fiscal years.
| Metric | AppLovin Corporation | Workday, Inc. |
|---|---|---|
| Market Cap | 194B | 50.7B |
| Revenue | 4.71B | 8.45B |
| EBITDA | 2.34B | 1.08B |
| EBIT | 1.89B | 752M |
| Net Income | 1.58B | 526M |
| EPS | 4.68 | 1.98 |
| Fiscal Year | 2024 | 2025 |
Income Statement Interpretations
AppLovin Corporation
AppLovin demonstrated strong revenue growth from $1.45B in 2020 to $4.71B in 2024, with net income turning positive and soaring to $1.58B in 2024. Margins notably improved, with a gross margin of 75.22% and net margin at 33.55%. The latest year showed robust expansion, with revenue up 43.44% and net income increasing over 200%, indicating accelerating profitability.
Workday, Inc.
Workday’s revenue rose steadily from $4.32B in 2021 to $8.45B in 2025, while net income recovered significantly after a loss in 2023, reaching $526M in 2025. Gross margin remained stable at 75.5%, but EBIT margin was moderate at 8.9%. The most recent year showed solid revenue growth of 16.35%, though net margin declined 67.26%, reflecting margin pressure despite higher top-line results.
Which one has the stronger fundamentals?
AppLovin shows stronger fundamentals with higher and more rapidly improving margins, robust profitability growth, and a more favorable income statement evaluation (92.86% positive). Workday, while growing revenues consistently, has faced margin compression and recent net income volatility, with a lower overall favorable score (78.57%) and some unfavorable margin trends.
Financial Ratios Comparison
The table below compares key financial ratios for AppLovin Corporation (APP) and Workday, Inc. (WDAY) based on their most recent fiscal year data, providing insights into profitability, liquidity, valuation, and leverage.
| Ratios | AppLovin Corporation (2024) | Workday, Inc. (2025) |
|---|---|---|
| ROE | 145% | 5.8% |
| ROIC | 39% | 2.7% |
| P/E | 69.1 | 132.2 |
| P/B | 100.1 | 7.7 |
| Current Ratio | 2.19 | 1.85 |
| Quick Ratio | 2.19 | 1.85 |
| D/E (Debt-to-Equity) | 3.26 | 0.37 |
| Debt-to-Assets | 61% | 19% |
| Interest Coverage | 5.89 | 3.64 |
| Asset Turnover | 0.80 | 0.47 |
| Fixed Asset Turnover | 23.7 | 5.36 |
| Payout ratio | 0 | 0 |
| Dividend yield | 0 | 0 |
Interpretation of the Ratios
AppLovin Corporation
AppLovin shows a mixed profile with strong profitability ratios such as a net margin of 33.55% and an exceptional ROE of 144.96%, indicating high returns on equity. However, high leverage is a concern with a debt-to-equity ratio of 3.26 and debt-to-assets at 60.59%. Liquidity is solid, with a current ratio of 2.19. The company does not pay dividends, reflecting a possible reinvestment strategy or focus on growth.
Workday, Inc.
Workday has moderate profitability, with net margin at 6.23% and a low ROE of 5.82%, suggesting limited returns for shareholders. Financial leverage is conservative, with debt-to-equity at 0.37 and debt-to-assets at 18.7%, supporting stability. Liquidity ratios are favorable, close to 1.85. Like AppLovin, Workday pays no dividends, likely prioritizing reinvestment and R&D given its high SG&A and R&D expenses.
Which one has the best ratios?
AppLovin displays stronger profitability and returns compared to Workday but assumes greater financial risk due to higher leverage. Workday maintains a more conservative capital structure with lower profitability. Both companies show no dividend payments. Overall, AppLovin is slightly favored on profitability metrics, while Workday scores better on leverage and risk control.
Strategic Positioning
This section compares the strategic positioning of AppLovin Corporation and Workday, Inc., focusing on market position, key segments, and exposure to technological disruption:
AppLovin Corporation
- Large market cap of $194B with high beta of 2.5, indicating significant competitive pressure.
- Focused on mobile app marketing and monetization software, with advertising and app segments driving revenue.
- Operates in software platform and in-app bidding, exposed to evolving mobile advertising technology.
Workday, Inc.
- Market cap of $51B with moderate beta of 1.14, facing moderate competitive pressure in enterprise cloud.
- Concentrated on enterprise cloud applications, mainly subscription services and professional services.
- Uses cloud and machine learning for business and financial management, exposed to cloud technology shifts.
AppLovin Corporation vs Workday, Inc. Positioning
AppLovin has a more diversified revenue base across advertising and apps, while Workday concentrates on enterprise cloud subscriptions and services. AppLovin’s broader market exposure contrasts with Workday’s specialized focus on business management solutions.
Which has the best competitive advantage?
AppLovin shows a very favorable moat with a strong and growing ROIC well above WACC, indicating durable competitive advantage. Workday’s moat is slightly unfavorable, reflecting value destruction despite improving profitability.
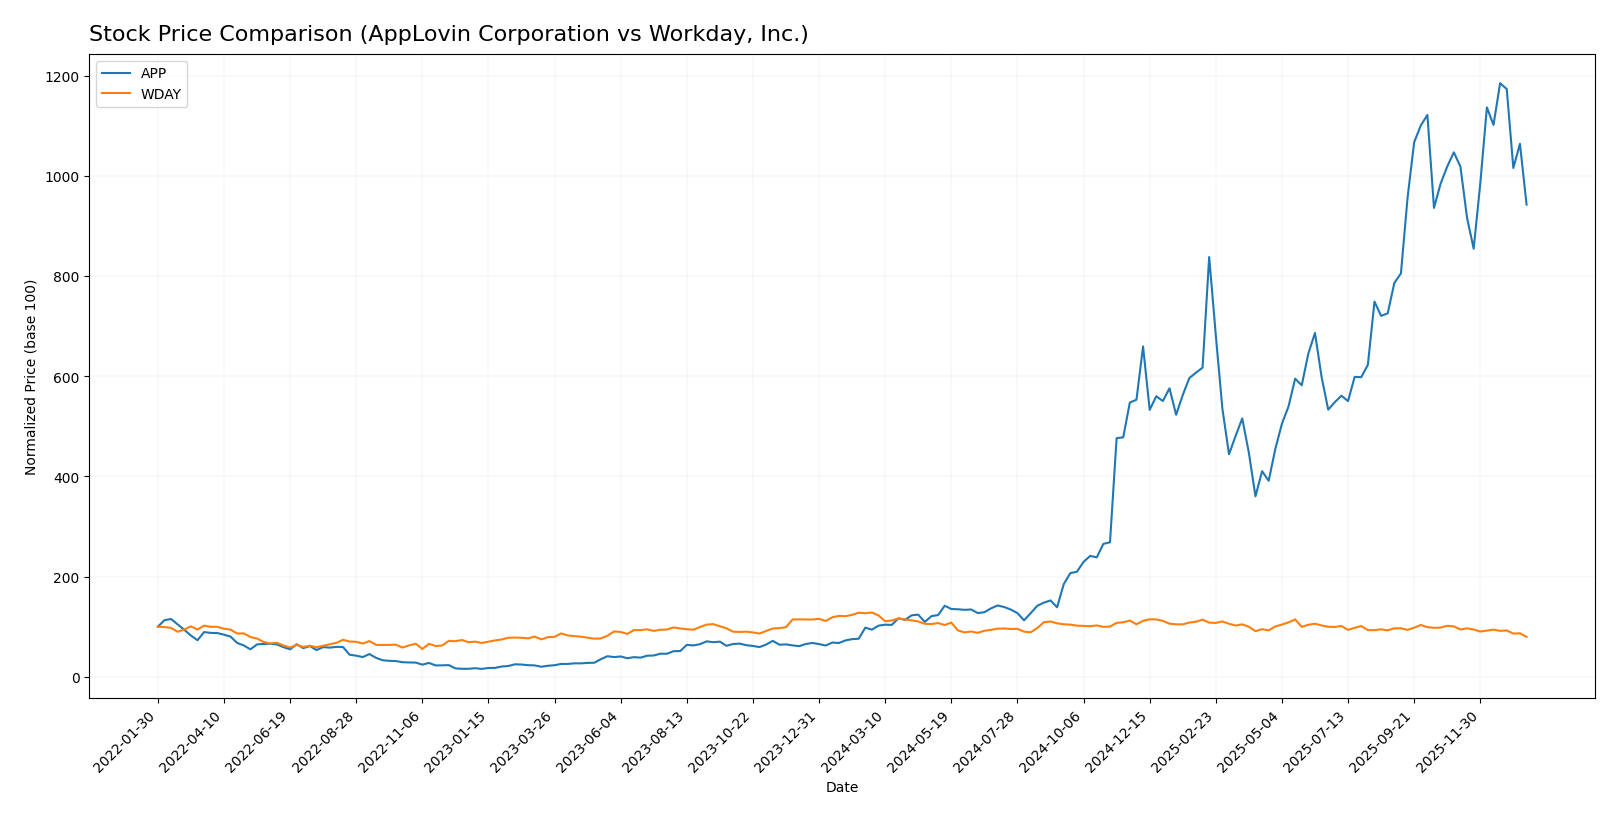
Stock Comparison
The stock price chart highlights significant divergence in the past year, with AppLovin Corporation exhibiting a strong bullish trend despite recent deceleration, while Workday, Inc. has faced a prolonged bearish trajectory.
Trend Analysis
AppLovin Corporation’s stock showed an overall bullish trend over the past 12 months with an 899.9% increase, though recent weeks indicate a slight decline of -9.96% and decelerating momentum. Workday, Inc. experienced a bearish trend over the same period with a -37.84% decrease and recent acceleration of the downward slope by -20.75%. Comparing both, AppLovin Corporation delivered the highest market performance with a substantially positive price change versus Workday’s decline.
Target Prices
Analysts present a clear consensus on target prices for AppLovin Corporation and Workday, Inc.
| Company | Target High | Target Low | Consensus |
|---|---|---|---|
| AppLovin Corporation | 860 | 630 | 756.33 |
| Workday, Inc. | 320 | 235 | 274.47 |
The consensus target prices for both companies suggest upside potential compared to current prices ($573 for AppLovin, $190 for Workday), indicating analysts expect growth in their valuations.
Analyst Opinions Comparison
This section compares analysts’ ratings and financial scores for AppLovin Corporation and Workday, Inc.:
Rating Comparison
AppLovin Corporation Rating
- Rating: B, classified as Very Favorable overall.
- Discounted Cash Flow Score: 3, Moderate valuation outlook.
- ROE Score: 5, showing very strong efficiency in equity use.
- ROA Score: 5, very effective asset utilization.
- Debt To Equity Score: 1, very unfavorable due to high debt.
- Overall Score: 3, Moderate overall financial standing.
Workday, Inc. Rating
- Rating: B-, also Very Favorable overall.
- Discounted Cash Flow Score: 4, indicating a Favorable view.
- ROE Score: 3, moderate efficiency in equity use.
- ROA Score: 3, moderate asset utilization.
- Debt To Equity Score: 2, moderate financial risk.
- Overall Score: 2, Moderate financial standing but lower than APP.
Which one is the best rated?
Based on the data, AppLovin Corporation holds higher scores in ROE and ROA, reflecting stronger operational efficiency, but has a weaker debt position. Workday shows better discounted cash flow and debt metrics, though overall scores are lower than AppLovin’s.
Scores Comparison
The following table compares the key financial scores of AppLovin Corporation (APP) and Workday, Inc. (WDAY):
APP Scores
- Altman Z-Score: 30.7, indicating a very safe zone.
- Piotroski Score: 7, reflecting strong financial health.
WDAY Scores
- Altman Z-Score: 4.41, indicating a safe zone.
- Piotroski Score: 6, reflecting average financial health.
Which company has the best scores?
Based on the provided data, APP has a significantly higher Altman Z-Score and a stronger Piotroski Score than WDAY. APP demonstrates a better financial safety margin and stronger financial health indicators compared to WDAY.
Grades Comparison
The following grades summary presents ratings from reputable financial institutions for both AppLovin Corporation and Workday, Inc.:
AppLovin Corporation Grades
This table shows recent grades assigned by major financial firms for AppLovin Corporation.
| Grading Company | Action | New Grade | Date |
|---|---|---|---|
| Morgan Stanley | Maintain | Overweight | 2026-01-13 |
| Wells Fargo | Maintain | Overweight | 2026-01-08 |
| Jefferies | Maintain | Buy | 2025-12-11 |
| Benchmark | Maintain | Buy | 2025-12-11 |
| Citigroup | Maintain | Buy | 2025-11-12 |
| Wells Fargo | Maintain | Overweight | 2025-11-07 |
| Goldman Sachs | Maintain | Neutral | 2025-11-07 |
| JP Morgan | Maintain | Neutral | 2025-11-06 |
| Wedbush | Maintain | Outperform | 2025-11-06 |
| Piper Sandler | Maintain | Overweight | 2025-11-06 |
Overall, AppLovin’s grades lean strongly toward Buy and Overweight ratings, with a few Neutral and Outperform assessments, indicating positive analyst sentiment.
Workday, Inc. Grades
This table outlines recent ratings from leading financial analysts for Workday, Inc.
| Grading Company | Action | New Grade | Date |
|---|---|---|---|
| Barclays | Maintain | Overweight | 2026-01-12 |
| RBC Capital | Maintain | Outperform | 2026-01-05 |
| TD Cowen | Maintain | Buy | 2025-11-26 |
| DA Davidson | Maintain | Neutral | 2025-11-26 |
| Wells Fargo | Maintain | Overweight | 2025-11-26 |
| Barclays | Maintain | Overweight | 2025-11-26 |
| Keybanc | Maintain | Overweight | 2025-11-26 |
| Citigroup | Maintain | Neutral | 2025-11-26 |
| JP Morgan | Maintain | Overweight | 2025-11-26 |
| UBS | Maintain | Neutral | 2025-11-26 |
Workday shows a consistent pattern of Overweight and Buy ratings, complemented by several Neutral opinions, reflecting generally favorable analyst views.
Which company has the best grades?
Both AppLovin and Workday maintain a consensus of Buy ratings, but Workday has a higher volume of Overweight and Outperform grades from top-tier analysts. This suggests Workday may offer stronger perceived growth or stability potential for investors, while AppLovin also holds positive but slightly more mixed sentiment.
Strengths and Weaknesses
Below is a comparative table highlighting the key strengths and weaknesses of AppLovin Corporation (APP) and Workday, Inc. (WDAY) based on the latest financial and operational data.
| Criterion | AppLovin Corporation (APP) | Workday, Inc. (WDAY) |
|---|---|---|
| Diversification | Moderate diversification: strong in advertising (3.22B) and apps (1.49B) segments | High reliance on subscription services (7.72B) with professional services as smaller part (728M) |
| Profitability | High profitability: net margin 33.55%, ROIC 38.7%, ROE 144.96% | Low profitability: net margin 6.23%, ROIC 2.73%, ROE 5.82% |
| Innovation | Strong innovation with growing ROIC and very favorable moat status | Innovation improving with growing ROIC but still shedding value; slightly unfavorable moat |
| Global presence | Established global footprint with scalable software platform | Global presence via cloud-based subscription services |
| Market Share | Significant market share in mobile advertising and app monetization | Leading market share in enterprise cloud applications for HR and finance |
Key takeaways: AppLovin exhibits robust profitability and a very favorable economic moat, driven by diversified revenue streams in advertising and apps. Workday shows improving profitability but still faces challenges in value creation, relying heavily on subscription services. Investors should weigh APP’s strong financials against WDAY’s growth potential and improving operational metrics.
Risk Analysis
Below is a comparative table outlining key risks for AppLovin Corporation (APP) and Workday, Inc. (WDAY) based on the most recent financial and operational data from 2025-2026.
| Metric | AppLovin Corporation (APP) | Workday, Inc. (WDAY) |
|---|---|---|
| Market Risk | High beta (2.50) implies high volatility and sensitivity to market swings | Moderate beta (1.14), lower volatility but still exposed |
| Debt Level | Elevated debt-to-equity ratio (3.26) and high debt to assets (60.6%) pose leverage risk | Low debt-to-equity (0.37) and moderate debt to assets (18.7%), stronger balance sheet |
| Regulatory Risk | Moderate, operates globally with data privacy concerns in mobile ad tech | Moderate, subject to cloud service and data privacy regulations globally |
| Operational Risk | Medium risk related to platform reliance and competition in mobile app monetization | Medium risk due to complexity of cloud software and integration challenges |
| Environmental Risk | Low to moderate, tech industry with limited direct environmental impact | Low, cloud services have modest environmental footprint |
| Geopolitical Risk | Moderate, international operations expose it to trade tensions and regulation changes | Moderate, global client base with exposure to geopolitical disruptions |
Synthesis: AppLovin faces significant market and leverage risks due to high volatility and elevated debt levels, which could impact financial stability in downturns. Workday’s risks are more balanced with a solid balance sheet but faces pressure from high valuation multiples and market competition. Investors should prioritize risk management for APP’s debt and market sensitivity while monitoring WDAY’s valuation and operational execution.
Which Stock to Choose?
AppLovin Corporation (APP) has shown a strong income evolution with a 224.53% revenue growth over 2020-2024 and favorable profitability metrics, including a 33.55% net margin and a very favorable ROE of 144.96%. Its debt metrics appear less favorable with a high debt-to-equity ratio of 3.26 and a 60.59% debt to assets, yet it maintains a solid current ratio of 2.19 and a very favorable credit rating of B. The company’s MOAT evaluation is very favorable, indicating durable competitive advantage and value creation.
Workday, Inc. (WDAY) reports moderate income growth with a 95.6% revenue increase over 2021-2025 and a lower net margin of 6.23%. Its financial ratios are mixed, featuring favorable debt levels (debt-to-equity 0.37, debt to assets 18.7%) and a strong current ratio of 1.85, but relatively weak profitability with unfavorable ROE and ROIC. Despite these challenges, WDAY holds a very favorable overall rating of B- and a slightly unfavorable MOAT score, signaling improving profitability but ongoing value destruction.
Investors prioritizing growth and robust profitability may find APP’s highly favorable income and MOAT evaluations more appealing, while those seeking financial stability with lower leverage might view WDAY’s solid debt profile and moderate earnings growth as more suitable. The contrasting risk profiles suggest APP could be interpreted as fitting for risk-tolerant investors focused on value creation, whereas WDAY might appear more aligned with risk-averse investors emphasizing financial stability.
Disclaimer: Investment carries a risk of loss of initial capital. The past performance is not a reliable indicator of future results. Be sure to understand risks before making an investment decision.
Go Further
I encourage you to read the complete analyses of AppLovin Corporation and Workday, Inc. to enhance your investment decisions: