Home > Comparison > Technology > APP vs U
The strategic rivalry between AppLovin Corporation and Unity Software Inc. shapes the evolution of the technology sector’s application software industry. AppLovin operates a platform focused on mobile app marketing and monetization, leveraging real-time bidding and analytics. Unity Software delivers a versatile real-time 3D content platform for interactive media across devices. This analysis contrasts their distinct growth trajectories to identify which offers superior risk-adjusted returns for a diversified portfolio.
Table of contents
Companies Overview
AppLovin and Unity Software stand as pivotal players in the evolving software application market.
AppLovin Corporation: Mobile Marketing Powerhouse
AppLovin dominates the mobile app ecosystem by offering a software-based platform that boosts app marketing and monetization. Its core revenue comes through AppDiscovery, Adjust, and MAX—tools that optimize advertising demand, analytics, and in-app bidding. In 2026, AppLovin focuses on refining real-time auctions to maximize app advertising efficiency globally.
Unity Software Inc.: Real-Time 3D Content Leader
Unity Software leads in interactive real-time 2D and 3D content creation for diverse devices, including VR and AR. It generates revenue by licensing its platform to developers, artists, and designers worldwide. The company’s 2026 strategy prioritizes expanding its ecosystem to serve creators with comprehensive development and monetization tools.
Strategic Collision: Similarities & Divergences
Both companies leverage software platforms but target different facets of digital content—AppLovin focuses on mobile app monetization, while Unity drives content creation and interactivity. Their primary battleground is the expanding digital entertainment and advertising space, where user engagement and developer tools are key. Their investment profiles differ: AppLovin is a marketing tech dynamo with high beta, whereas Unity is a creative platform builder with broader content ambitions.
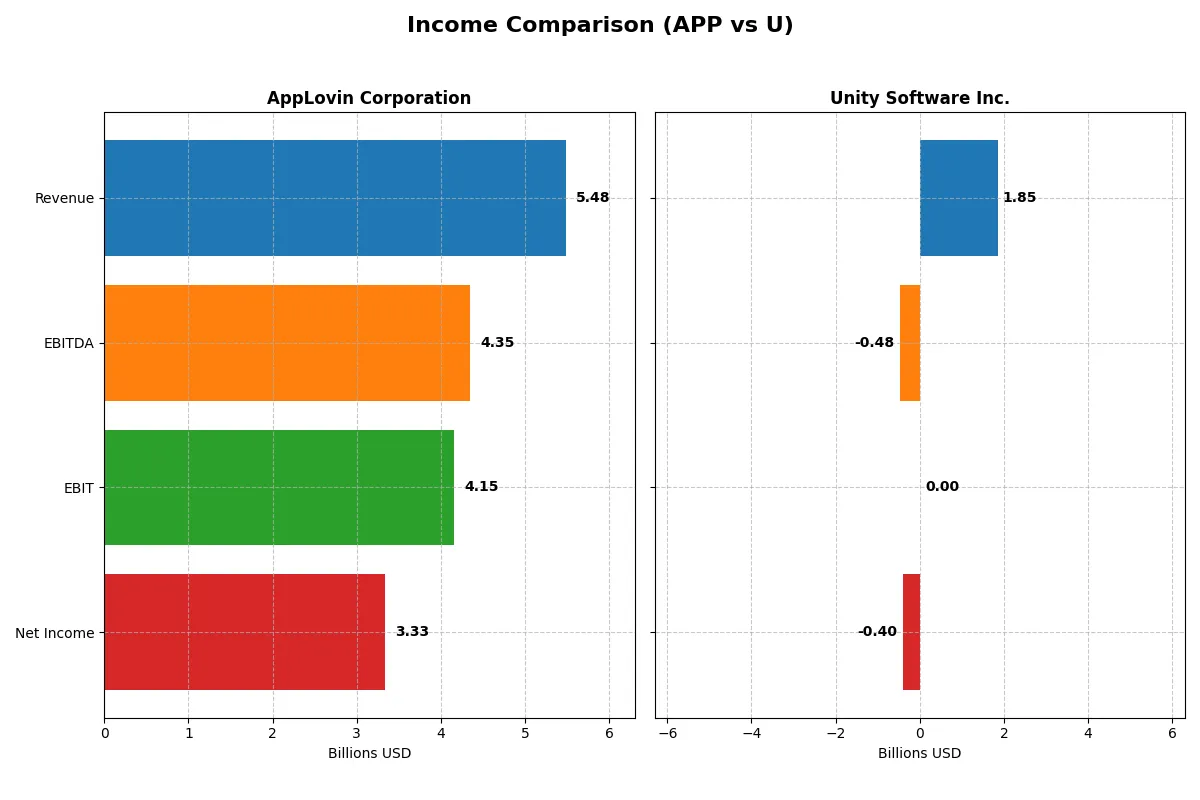
Income Statement Comparison
This data dissects the core profitability and scalability of both corporate engines to reveal who dominates the bottom line:
| Metric | AppLovin Corporation (APP) | Unity Software Inc. (U) |
|---|---|---|
| Revenue | 5.48B | 1.85B |
| Cost of Revenue | 665.1M | 477.7M |
| Operating Expenses | 663.7M | 1.85B |
| Gross Profit | 4.82B | 1.37B |
| EBITDA | 4.35B | -479.1M |
| EBIT | 4.15B | 0 |
| Interest Expense | 207.0M | -24.0M |
| Net Income | 3.33B | -402.8M |
| EPS | 9.84 | -0.96 |
| Fiscal Year | 2025 | 2025 |
Income Statement Analysis: The Bottom-Line Duel
This income statement comparison reveals which company operates with superior efficiency and profitability in a competitive market environment.
AppLovin Corporation Analysis
AppLovin’s revenue surged from 3.28B in 2023 to 5.48B in 2025, with net income rocketing from 355M to 3.33B, showcasing remarkable margin expansion. Gross margin climbed to 87.9%, and net margin hit 60.8% in 2025, reflecting outstanding operational leverage and cost control. The company accelerated growth sharply in 2025, doubling EBIT and net income, signaling efficient capital allocation and strong momentum.
Unity Software Inc. Analysis
Unity’s revenue grew modestly from 2.19B in 2023 to 1.85B in 2025, but net income remained negative at -403M in 2025 despite a 2% revenue increase. Gross margin held a healthy 74.2%, yet the company struggled with consistent operating losses and a negative net margin of -21.8%. Its 2025 performance shows slight improvement in EBIT but continued net losses, indicating challenges in scaling profitability despite revenue growth.
Margin Dominance vs. Struggling Profitability
AppLovin clearly outperforms Unity with robust revenue growth and exceptional margin expansion, translating into strong net profits. Unity, while maintaining decent gross margins, continues to operate at a loss with limited top-line growth. For investors, AppLovin’s profile offers a proven track record of scaling profits efficiently, whereas Unity still faces significant hurdles to achieve sustainable profitability.
Financial Ratios Comparison
These vital ratios act as a diagnostic tool to expose the underlying fiscal health, valuation premiums, and capital efficiency of the companies compared below:
| Ratios | AppLovin Corporation (APP) | Unity Software Inc. (U) |
|---|---|---|
| ROE | 1.56 | -0.12 |
| ROIC | 0.61 | -0.08 |
| P/E | 68.47 | -46.16 |
| P/B | 106.94 | 5.74 |
| Current Ratio | 3.32 | 1.84 |
| Quick Ratio | 3.32 | 1.84 |
| D/E | 1.66 | 0.69 |
| Debt-to-Assets | 0.49 | 0.33 |
| Interest Coverage | 20.06 | 19.95 |
| Asset Turnover | 0.75 | 0.27 |
| Fixed Asset Turnover | 37.06 | 27.09 |
| Payout ratio | 0 | 0 |
| Dividend yield | 0 | 0 |
| Fiscal Year | 2025 | 2025 |
Efficiency & Valuation Duel: The Vital Signs
Financial ratios serve as a company’s DNA, exposing hidden risks and operational strengths critical for informed investment decisions.
AppLovin Corporation
AppLovin delivers stellar profitability with a 156% ROE and a robust 60.8% net margin, signaling exceptional operational efficiency. Yet, its valuation appears stretched, with a high P/E of 68.5 and a price-to-book of 107. The firm retains earnings for growth, foregoing dividends but fueling innovation and expansion.
Unity Software Inc.
Unity struggles with negative profitability metrics: a -12.4% ROE and a -21.8% net margin, reflecting operational challenges. Its negative P/E contrasts with a moderate P/B of 5.7, highlighting valuation complexity. Unity preserves capital without dividends, heavily reinvesting in R&D to pursue future growth opportunities.
Premium Profitability vs. Growth Risk
AppLovin’s superior profitability and efficiency contrast with Unity’s ongoing losses and reinvestment focus. AppLovin offers a more balanced risk-reward profile, suited for investors prioritizing operational strength. Unity’s profile fits those seeking speculative growth despite heightened financial risks.
Which one offers the Superior Shareholder Reward?
AppLovin Corporation (APP) and Unity Software Inc. (U) both forgo dividends, opting instead to reinvest in growth. APP boasts robust free cash flow of 11.7/share in 2025, fueling aggressive buybacks and sustaining a 0 payout ratio. Unity’s free cash flow is under 1/share, reflecting weaker margins and less capacity for buybacks. I see APP’s capital allocation as superior, balancing high-margin cash generation with disciplined leverage (debt-to-equity 1.66). Unity’s negative profitability and weaker cash flow coverage pose risks to shareholder reward. In 2026, APP offers a more attractive total return profile, driven by sustainable buyback intensity and solid free cash flow coverage.
Comparative Score Analysis: The Strategic Profile
The radar chart reveals the fundamental DNA and trade-offs of AppLovin Corporation and Unity Software Inc., highlighting their distinctive financial strengths and vulnerabilities:
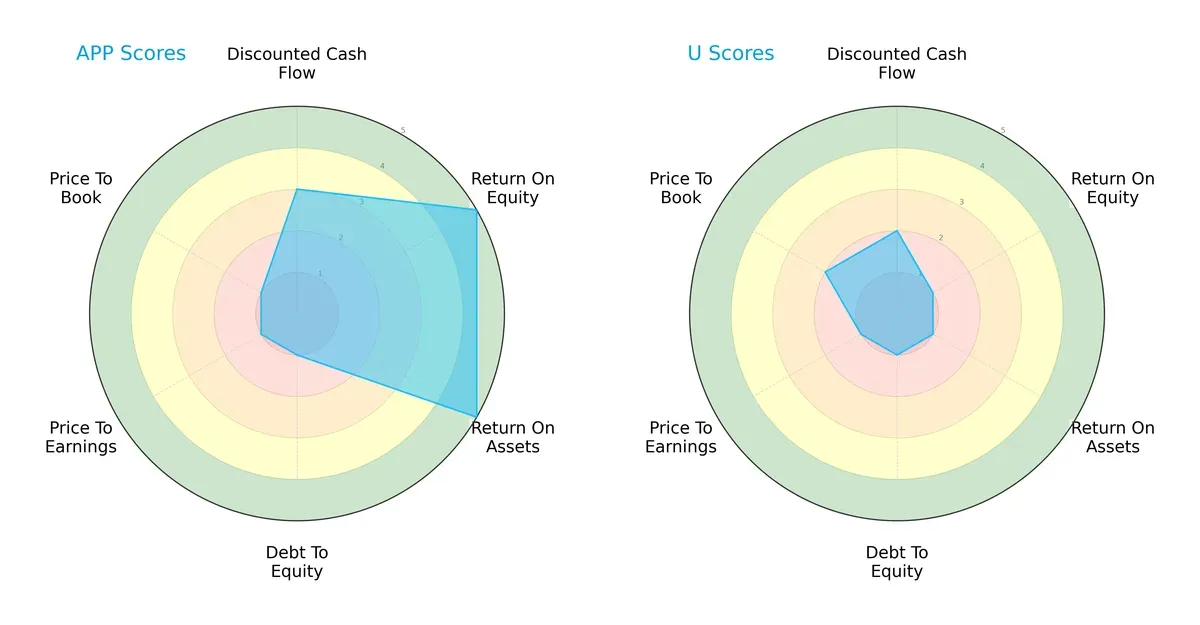
AppLovin shows a more balanced profile with very favorable ROE and ROA scores (5 each), signaling strong profitability and asset efficiency. However, it struggles with debt and valuation metrics, scoring very unfavorable (1) in debt-to-equity, P/E, and P/B ratios, indicating high financial leverage and overvaluation risks. Unity, by contrast, scores uniformly low across all categories, reflecting a weaker overall financial stance and no clear competitive edge. AppLovin’s mix of operational strength and financial risk contrasts sharply with Unity’s broad underperformance.
Bankruptcy Risk: Solvency Showdown
AppLovin’s Altman Z-Score far exceeds Unity’s, placing it securely in the safe zone while Unity falls into the distress zone, signaling a significant solvency gap between the two firms:
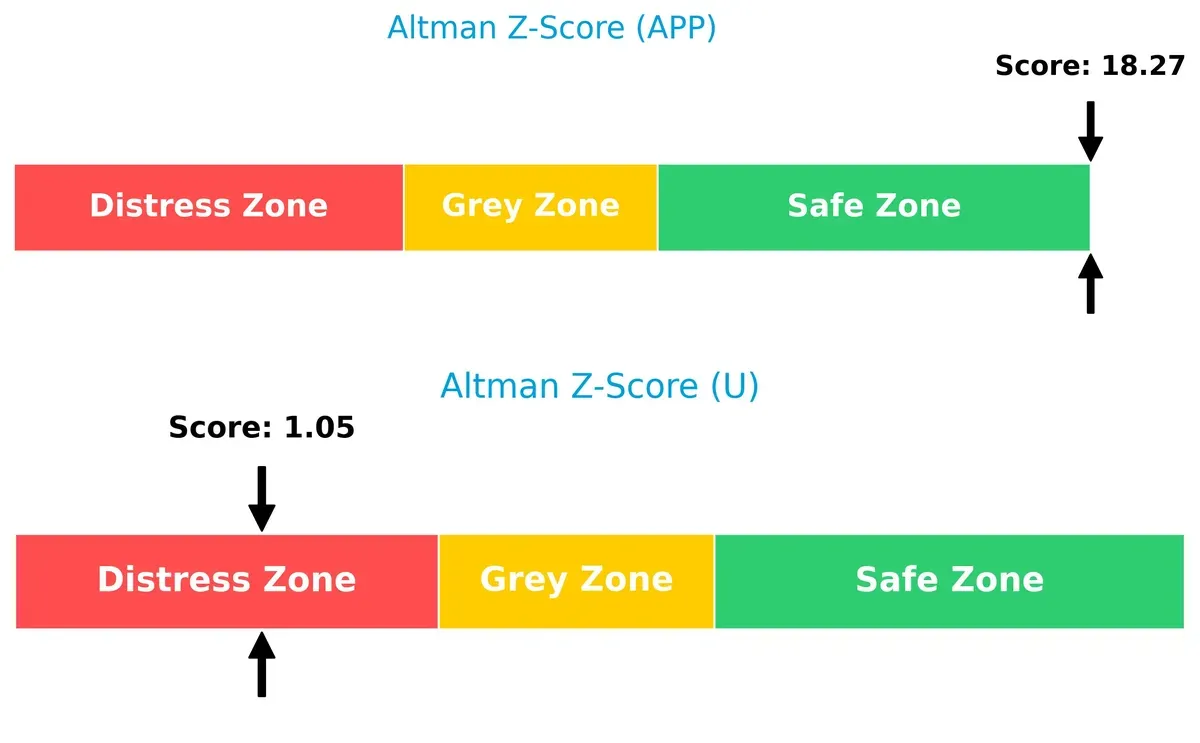
AppLovin’s robust 18.3 Z-Score suggests it is well-positioned to weather long-term economic cycles. Unity’s 1.05 score flags severe bankruptcy risk, cautioning investors about its financial fragility amidst current market volatility.
Financial Health: Quality of Operations
AppLovin’s Piotroski F-Score of 8 versus Unity’s 4 underscores a stark contrast in operational quality and internal financial strength:
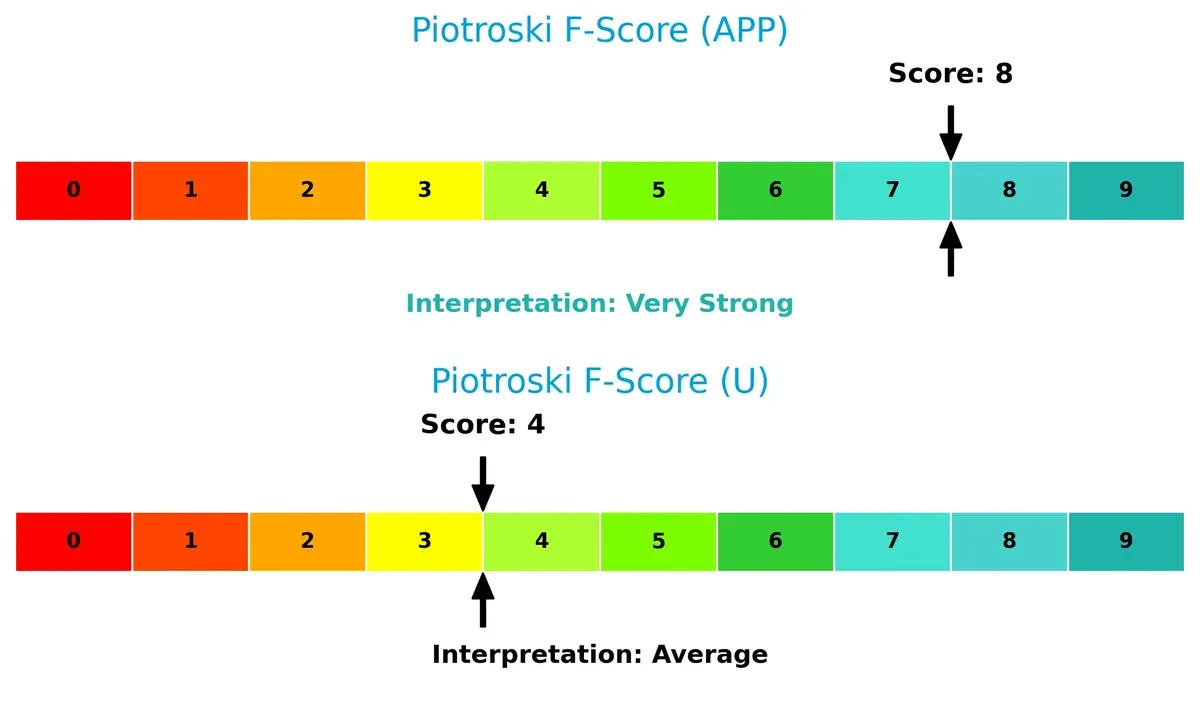
AppLovin exhibits very strong financial health, with efficient profitability, liquidity, and leverage management. Unity’s average score indicates moderate operational challenges and potential red flags in its internal metrics. This gap highlights AppLovin’s superior quality of earnings and balance sheet management.
How are the two companies positioned?
This section dissects the operational DNA of APP and U by comparing revenue distribution by segment and analyzing their internal strengths and weaknesses. The final goal is to confront their economic moats to identify which business model offers the most resilient, sustainable competitive advantage today.
Revenue Segmentation: The Strategic Mix
This visual comparison dissects how AppLovin and Unity diversify their income streams and where their primary sector bets lie:
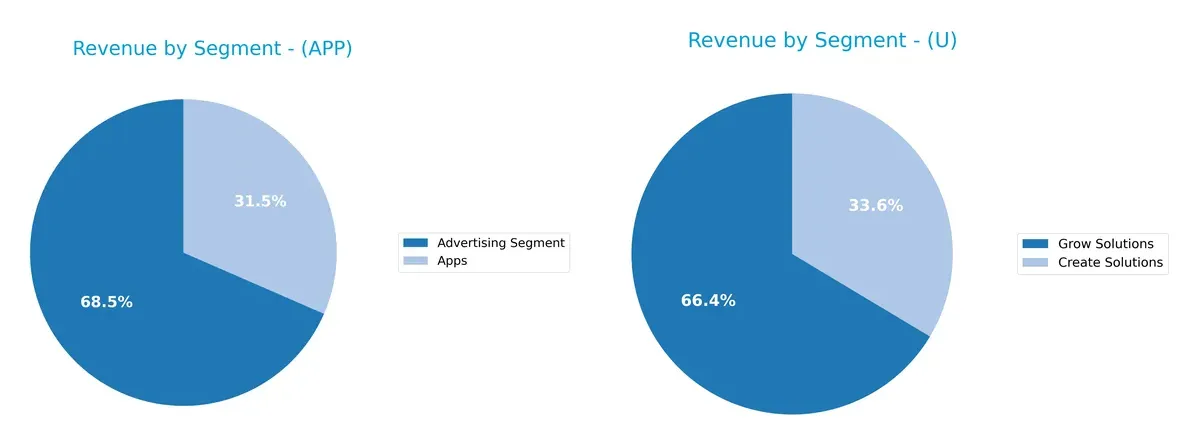
AppLovin anchors revenue in Advertising, with $3.2B in 2024, dwarfing its Apps segment at $1.5B. Unity shows a more balanced mix: $1.2B in Grow/Operate Solutions and around $620M in Create Solutions. AppLovin’s reliance on Advertising signals concentration risk but strong ecosystem lock-in. Unity’s diversified streams suggest infrastructure dominance, spreading risk across creation and operation platforms.
Strengths and Weaknesses Comparison
This table compares the Strengths and Weaknesses of AppLovin Corporation (APP) and Unity Software Inc. (U):
APP Strengths
- High net margin (60.83%) and ROE (156.17%) demonstrate strong profitability
- Favorable quick ratio (3.32) indicates good short-term liquidity
- Significant advertising segment revenue (3.22B in 2024) shows product diversification
- Growing global presence with 2.69B US and 2.02B Rest of World revenues
- Strong asset turnover and fixed asset turnover ratios
U Strengths
- Favorable price-to-earnings ratio despite negative earnings suggests market growth potential
- Positive current and quick ratios (1.84) signal adequate liquidity
- Diverse revenue streams from Create and Grow Solutions totaling 1.85B in 2025
- Broad geographic sales across US, EMEA, Asia Pacific and Greater China
- Favorable fixed asset turnover ratio (27.09) indicates efficient asset use
APP Weaknesses
- High price-to-earnings (68.47) and price-to-book (106.94) ratios may raise valuation concerns
- Unfavorable debt-to-equity ratio (1.66) suggests higher leverage risk
- Current ratio flagged as unfavorable despite strong quick ratio
- WACC (15.1%) significantly below ROIC but high debt levels may pressure costs
- No dividend yield limits income for investors
U Weaknesses
- Negative net margin (-21.78%), ROE (-12.44%), and ROIC (-8.16%) reflect profitability challenges
- Interest coverage near zero indicates risk in servicing debt
- Lower asset turnover (0.27) highlights operational inefficiency
- High price-to-book ratio (5.74) and negative P/E reflect valuation and earnings risks
- No dividend yield offered, limiting shareholder returns
Both companies show distinct profiles: APP’s strengths lie in robust profitability and global scale, offset by valuation and leverage concerns. U struggles with profitability metrics but maintains liquidity and geographic diversification. These contrasts shape their strategic priorities moving forward.
The Moat Duel: Analyzing Competitive Defensibility
A structural moat is the only true shield protecting long-term profits from relentless competitive erosion in dynamic markets:
AppLovin Corporation: Data-Driven Marketing Dominance
AppLovin’s moat stems from high switching costs linked to its integrated marketing and monetization platform. Its stellar 60.8% net margin and soaring ROIC confirm strong value creation. Expansion into global app markets in 2026 could deepen this advantage.
Unity Software Inc.: Platform Ecosystem with Growth Challenges
Unity relies on network effects within its real-time 3D content platform, contrasting AppLovin’s marketing focus. Despite growing ROIC, Unity’s negative net margin and lower profitability indicate a narrower moat. New AR/VR avenues may offer upside in 2026.
Margin Mastery vs. Ecosystem Expansion
AppLovin exhibits a wider, more sustainable moat through superior profitability and capital efficiency. Unity shows promise but remains vulnerable. AppLovin is better positioned to defend and grow its market share.
Which stock offers better returns?
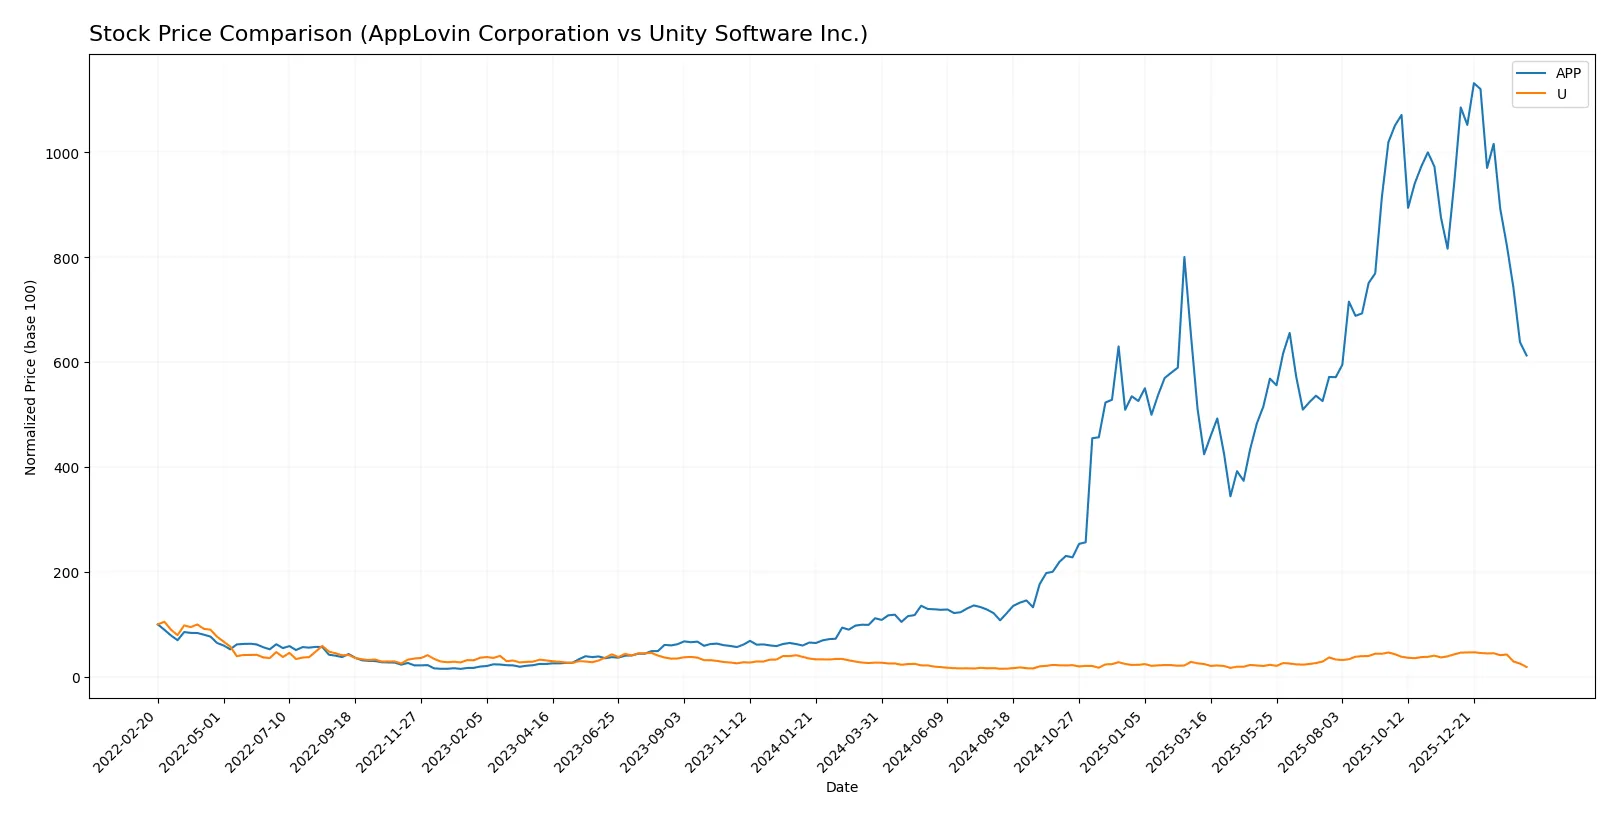
Over the past year, AppLovin Corporation’s stock surged dramatically before slowing, while Unity Software Inc.’s price declined steadily with growing bearish momentum.
Trend Comparison
AppLovin Corporation’s stock rose 448.29% over the past 12 months, showing a bullish trend but with decelerating momentum and high volatility. The price peaked at 721.37 and bottomed at 66.8.
Unity Software Inc. recorded a 30.79% decline over the same period, reflecting a bearish trend with deceleration. Its price fluctuated narrowly between 15.32 and 46.42, indicating lower volatility.
AppLovin outperformed Unity significantly, delivering the highest market return despite recent price weakness in both stocks.
Target Prices
Analysts present a broad consensus on target prices for AppLovin Corporation and Unity Software Inc.
| Company | Target Low | Target High | Consensus |
|---|---|---|---|
| AppLovin Corporation | 543 | 835 | 690.93 |
| Unity Software Inc. | 26 | 60 | 37.7 |
AppLovin’s consensus target of 691 implies a substantial upside from its current 391 price. Unity’s target consensus of 37.7 also signals significant appreciation potential from 18.68.

Don’t Let Luck Decide Your Entry Point
Optimize your entry points with our advanced ProRealTime indicators. You’ll get efficient buy signals with precise price targets for maximum performance. Start outperforming now!
How do institutions grade them?
The following tables summarize recent institutional grades for both companies:
AppLovin Corporation Grades
This table lists recent grades from recognized financial institutions for AppLovin Corporation:
| Grading Company | Action | New Grade | Date |
|---|---|---|---|
| Wells Fargo | maintain | Overweight | 2026-02-12 |
| Citigroup | maintain | Buy | 2026-02-12 |
| RBC Capital | maintain | Outperform | 2026-02-12 |
| UBS | maintain | Buy | 2026-02-12 |
| Wedbush | maintain | Outperform | 2026-02-12 |
| Piper Sandler | maintain | Overweight | 2026-02-12 |
| Jefferies | maintain | Buy | 2026-02-12 |
| Scotiabank | maintain | Sector Outperform | 2026-02-12 |
| BTIG | maintain | Buy | 2026-02-12 |
| Goldman Sachs | maintain | Neutral | 2026-02-12 |
Unity Software Inc. Grades
This table shows recent institutional grades for Unity Software Inc.:
| Grading Company | Action | New Grade | Date |
|---|---|---|---|
| Goldman Sachs | maintain | Neutral | 2026-02-12 |
| BTIG | maintain | Buy | 2026-02-12 |
| Needham | maintain | Buy | 2026-02-12 |
| Wells Fargo | maintain | Overweight | 2026-02-12 |
| Wedbush | maintain | Outperform | 2026-02-12 |
| Macquarie | maintain | Outperform | 2026-02-12 |
| UBS | maintain | Neutral | 2026-02-12 |
| Citigroup | maintain | Buy | 2026-02-12 |
| Barclays | maintain | Equal Weight | 2026-02-12 |
| Citizens | maintain | Market Outperform | 2026-02-12 |
Which company has the best grades?
AppLovin Corporation consistently receives higher and more positive grades, including multiple “Buy” and “Outperform” ratings. Unity Software has mixed ratings with some “Neutral” and “Equal Weight” grades. Investors may view AppLovin’s stronger consensus as a sign of greater institutional confidence.
Risks specific to each company
The following categories identify the critical pressure points and systemic threats facing both firms in the 2026 market environment:
1. Market & Competition
AppLovin Corporation
- Dominates mobile app marketing with strong monetization tools but faces intense competition in ad tech.
Unity Software Inc.
- Specializes in real-time 3D content platforms, competing with established players in gaming and AR/VR software.
2. Capital Structure & Debt
AppLovin Corporation
- High debt-to-equity ratio (1.66) signals leverage risk despite strong interest coverage.
Unity Software Inc.
- Moderate debt levels with debt-to-equity at 0.69, but poor interest coverage raises solvency concerns.
3. Stock Volatility
AppLovin Corporation
- Beta of 2.49 indicates high sensitivity to market swings; stock price range is wide (200.5–745.61).
Unity Software Inc.
- Beta of 2.085 shows elevated volatility; recent price dropped 4.9%, with a range of 15.33–52.15.
4. Regulatory & Legal
AppLovin Corporation
- Operates globally with exposure to evolving data privacy laws, especially in advertising.
Unity Software Inc.
- Faces regulatory scrutiny in multiple jurisdictions due to diverse content and platform distribution.
5. Supply Chain & Operations
AppLovin Corporation
- Relies on software platform stability and data infrastructure, vulnerable to tech disruptions.
Unity Software Inc.
- Complex operations across hardware-agnostic platforms may face integration and scalability challenges.
6. ESG & Climate Transition
AppLovin Corporation
- Limited direct environmental impact but must address data security and privacy as ESG factors.
Unity Software Inc.
- Needs to enhance ESG focus amid growing investor pressure on sustainability and ethical content creation.
7. Geopolitical Exposure
AppLovin Corporation
- International presence subjects it to risks from US-China tensions and cross-border data regulations.
Unity Software Inc.
- Broad global footprint increases vulnerability to geopolitical instability and trade restrictions.
Which company shows a better risk-adjusted profile?
AppLovin’s largest risk is its elevated leverage, which contrasts with its strong profitability and liquidity metrics. Unity’s primary risk lies in its financial distress, evident from negative returns and weak interest coverage despite moderate debt. AppLovin offers a better risk-adjusted profile, supported by a robust Altman Z-score of 18.3 and a very strong Piotroski score of 8. Unity’s Z-score of 1.05 signals distress, underscoring its precarious financial health. Recent market reactions reflect these risks: AppLovin’s stock recently surged 6.4%, while Unity’s declined nearly 5%, mirroring investor concern over its weaker fundamentals.
Final Verdict: Which stock to choose?
AppLovin Corporation’s superpower lies in its exceptional capital efficiency and robust profitability, showcasing a very favorable economic moat. Its aggressive growth potential is tempered by a point of vigilance: elevated valuation multiples and leverage. This stock suits investors seeking high-growth exposure willing to accept premium pricing and some risk.
Unity Software Inc. benefits from a strategic moat based on its entrenched position in real-time 3D development, driving recurring revenue streams. Compared to AppLovin, it offers a safer balance sheet but struggles with consistent profitability. It fits well within a GARP (Growth at a Reasonable Price) portfolio seeking improving fundamentals and a turnaround narrative.
If you prioritize sustained value creation and aggressive growth, AppLovin outshines Unity due to its superior ROIC and profitability metrics despite higher risk. However, if you seek a more stable investment with potential for operational improvement, Unity offers better stability and a clearer path to margin expansion. Both present analytical scenarios depending on your risk tolerance and growth expectations.
Disclaimer: Investment carries a risk of loss of initial capital. The past performance is not a reliable indicator of future results. Be sure to understand risks before making an investment decision.
Go Further
I encourage you to read the complete analyses of AppLovin Corporation and Unity Software Inc. to enhance your investment decisions: