Home > Comparison > Technology > APP vs UBER
The strategic rivalry between AppLovin Corporation and Uber Technologies defines the evolving landscape of the technology sector. AppLovin operates as a specialized software platform focused on mobile app marketing and monetization, while Uber commands a diversified application portfolio spanning mobility, delivery, and freight services. This face-off highlights a contrast between niche software innovation and broad-based platform integration. This analysis will reveal which trajectory offers superior risk-adjusted returns for a diversified portfolio.
Table of contents
Companies Overview
AppLovin and Uber hold pivotal roles in the software application sector, shaping digital consumer experiences.
AppLovin Corporation: Mobile App Marketing Innovator
AppLovin dominates mobile app marketing with its software platform that matches advertiser demand to publisher supply via real-time auctions. Its revenue stems from marketing tools like AppDiscovery and analytics through Adjust, enhancing app monetization globally. In 2026, AppLovin emphasizes optimizing in-app ad bidding to maximize publisher revenue and advertiser ROI.
Uber Technologies, Inc.: Global On-Demand Mobility Leader
Uber leads in connecting consumers with ride and delivery services across multiple continents. Its core revenue comes from its Mobility, Delivery, and Freight segments, leveraging proprietary tech to link riders, restaurants, and shippers. In 2026, Uber focuses on expanding service breadth while improving operational efficiency and user experience in its key markets.
Strategic Collision: Similarities & Divergences
Both firms leverage technology-driven platforms but differ in focus—AppLovin centers on app marketing, while Uber prioritizes transportation and logistics. Their battle unfolds in customer engagement and platform scalability. AppLovin’s asset-light model contrasts with Uber’s capital-intensive operations, defining unique investment risk and growth profiles for each.
Income Statement Comparison
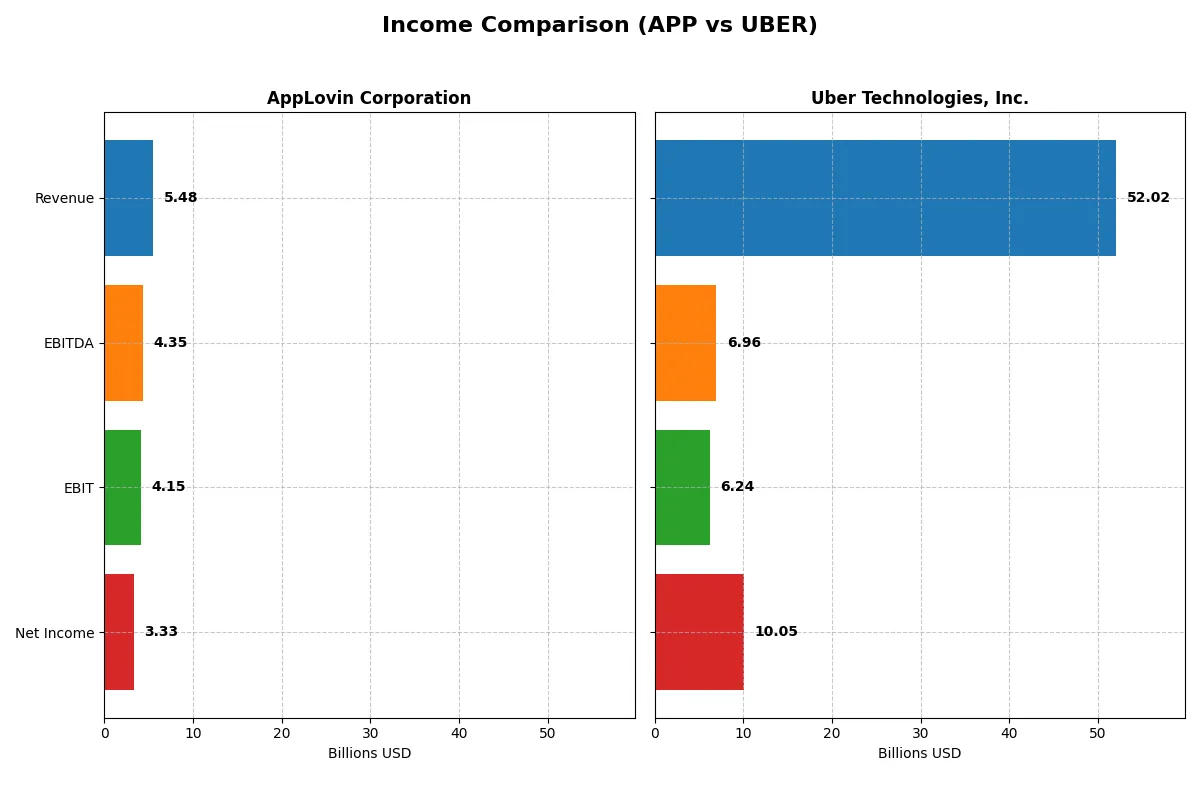
The following data dissects the core profitability and scalability of both corporate engines to reveal who dominates the bottom line:
| Metric | AppLovin Corporation (APP) | Uber Technologies, Inc. (UBER) |
|---|---|---|
| Revenue | 5.48B | 52.02B |
| Cost of Revenue | 665.1M | 31.34B |
| Operating Expenses | 663.7M | 15.11B |
| Gross Profit | 4.82B | 20.68B |
| EBITDA | 4.35B | 6.96B |
| EBIT | 4.15B | 6.24B |
| Interest Expense | 207.0M | 440.0M |
| Net Income | 3.33B | 10.03B |
| EPS | 9.84 | 4.82 |
| Fiscal Year | 2025 | 2025 |
Income Statement Analysis: The Bottom-Line Duel
This income statement comparison reveals which company operates with superior efficiency and profit quality amidst their growth trajectories.
AppLovin Corporation Analysis
AppLovin nearly doubled its revenue from 2021 to 2025, reaching $5.48B in 2025 with a stellar net income of $3.33B. Its gross margin expanded impressively to 87.9%, and net margin surged to 60.8%, signaling exceptional cost control and profitability. The company’s EBIT growth of 119% in the latest year highlights accelerating operational momentum and efficiency gains.
Uber Technologies, Inc. Analysis
Uber’s revenue climbed 198% over five years, hitting $52B in 2025, while net income soared to $10B. Despite robust top-line growth, Uber operates with a thinner gross margin of 39.8% and a more modest net margin of 19.3%. Uber’s EBIT margin improved to 12%, reflecting operational leverage, but a slight net margin decline last year poses a caution on profitability consistency.
Margin Power vs. Revenue Scale
AppLovin demonstrates superior margin expansion and operational efficiency, generating strong profits from a smaller revenue base. Uber boasts much larger revenue scale and absolute net income but with significantly thinner margins. For investors prioritizing profit quality and margin strength, AppLovin’s profile is more attractive. Uber appeals to those focused on dominant market share and top-line growth potential.
Financial Ratios Comparison
These vital ratios act as a diagnostic tool to expose the underlying fiscal health, valuation premiums, and capital efficiency of the companies compared below:
| Ratios | AppLovin Corporation (APP) | Uber Technologies, Inc. (UBER) |
|---|---|---|
| ROE | 156.2% | 37.2% |
| ROIC | 60.7% | 11.2% |
| P/E | 68.5 | 16.9 |
| P/B | 106.9 | 6.3 |
| Current Ratio | 3.32 | 1.14 |
| Quick Ratio | 3.32 | 1.14 |
| D/E | 1.66 | 0.50 |
| Debt-to-Assets | 48.8% | 21.8% |
| Interest Coverage | 20.1 | 12.6 |
| Asset Turnover | 0.75 | 0.84 |
| Fixed Asset Turnover | 37.1 | 17.3 |
| Payout Ratio | 0 | 0 |
| Dividend Yield | 0% | 0% |
| Fiscal Year | 2025 | 2025 |
Efficiency & Valuation Duel: The Vital Signs
Ratios act as a company’s DNA, exposing hidden operational strengths and risks critical to investment decisions.
AppLovin Corporation
AppLovin delivers exceptional profitability with a 156% ROE and a strong 60.8% net margin, signaling operational excellence. However, its valuation is stretched, marked by a high 68.5 P/E and an inflated 107 P/B ratio. The company offers no dividends, focusing on reinvestment into growth and innovation, which supports its robust capital returns.
Uber Technologies, Inc.
Uber presents solid profitability with a 37.2% ROE and a healthy 19.3% net margin, reflecting efficient operations. Its valuation is more reasonable at a 16.9 P/E and a moderate 6.3 P/B ratio. Uber also pays no dividends but balances shareholder returns through steady free cash flow and disciplined debt management, fueling continued expansion.
Premium Valuation vs. Operational Safety
AppLovin’s extraordinary returns come at a premium valuation and higher leverage risk. Uber offers a more balanced profile with favorable profitability and lower valuation multiples. Investors seeking growth with moderate risk may prefer AppLovin’s innovation focus, while those prioritizing operational safety might lean toward Uber’s steadier fundamentals.
Which one offers the Superior Shareholder Reward?
AppLovin Corporation (APP) and Uber Technologies, Inc. (UBER) both forgo dividends, focusing on growth reinvestment and buybacks. APP shows zero dividend payout but delivers robust free cash flow per share at 11.7, fully covering its buybacks, signaling disciplined capital allocation. UBER also pays no dividend, with free cash flow per share at 4.7, slightly lower but supports steady buybacks. APP’s payout ratio is zero with no dividend yield, relying on aggressive buybacks to reward shareholders sustainably. UBER’s lower leverage and moderate buyback intensity indicate a balanced distribution strategy. I view APP’s higher FCF and buyback scale as offering superior total shareholder return potential in 2026.
Comparative Score Analysis: The Strategic Profile
The radar chart reveals the fundamental DNA and trade-offs of AppLovin Corporation and Uber Technologies, Inc., highlighting their core financial strengths and weaknesses:
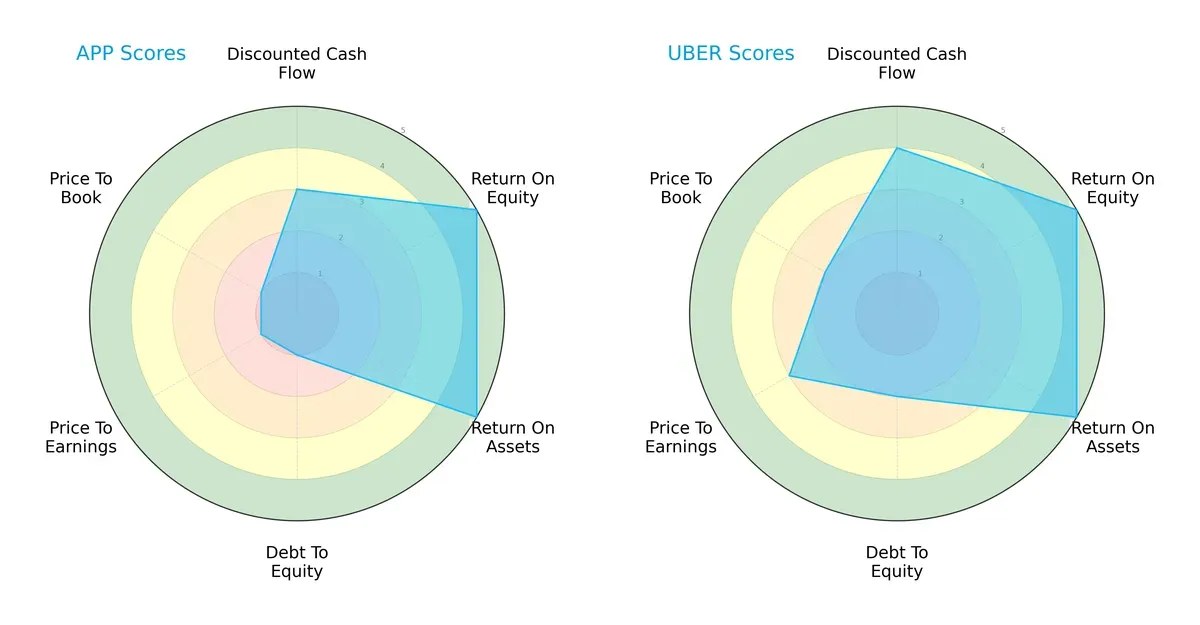
AppLovin shows strong operational efficiency with top ROE and ROA scores but suffers from a weak balance sheet and valuation metrics. Uber delivers a more balanced profile with favorable DCF, better debt management, and moderately attractive valuation scores. Uber’s diversified strengths suggest greater resilience, while AppLovin relies heavily on operational excellence despite financial leverage risks.
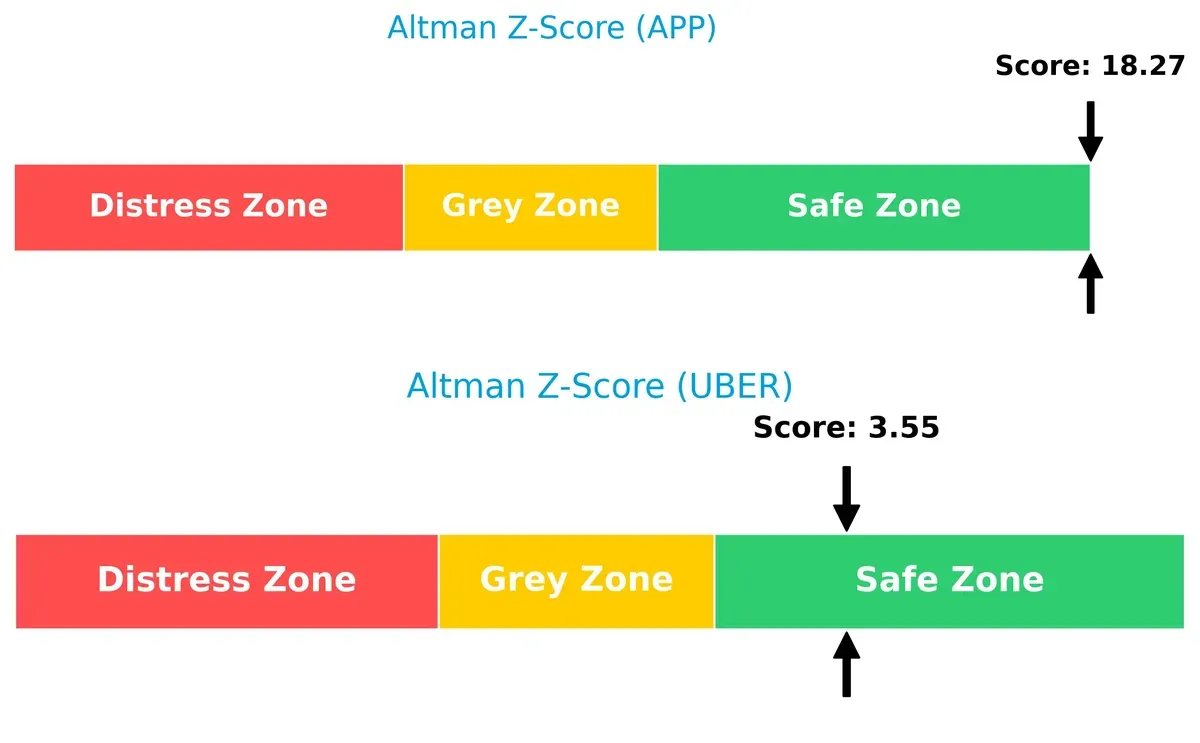
Bankruptcy Risk: Solvency Showdown
AppLovin’s Altman Z-Score of 18.3 vastly exceeds Uber’s 3.6, signaling a substantially stronger solvency position and a safer long-term survival outlook in this cycle:
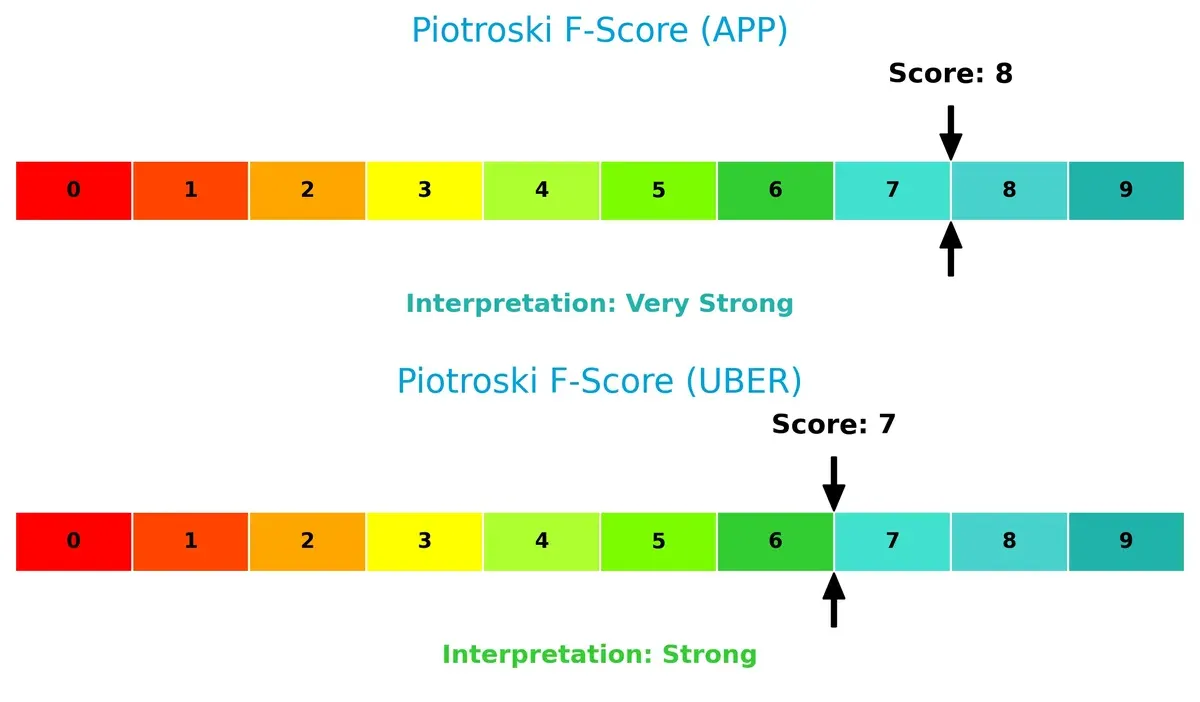
Financial Health: Quality of Operations
AppLovin’s Piotroski F-Score of 8 indicates peak financial health, slightly edging out Uber’s strong score of 7. This suggests AppLovin maintains marginally better internal financial robustness:
How are the two companies positioned?
This section dissects the operational DNA of AppLovin and Uber by comparing their revenue distribution and internal dynamics. The goal is to confront their economic moats and pinpoint which model offers the most resilient, sustainable competitive advantage today.
Revenue Segmentation: The Strategic Mix
This visual comparison dissects how AppLovin Corporation and Uber Technologies diversify their income streams and where their primary sector bets lie:
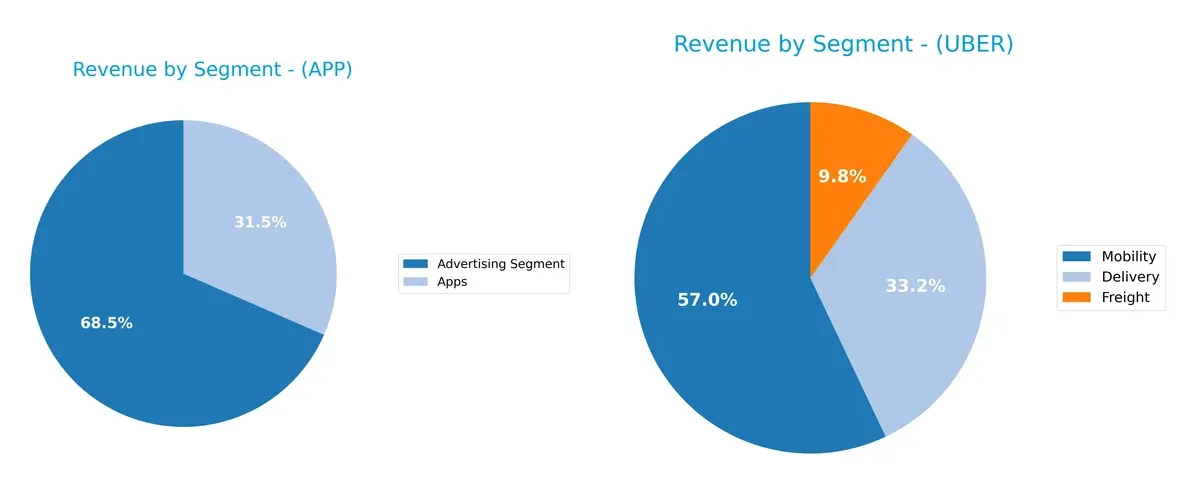
AppLovin pivots mainly on two segments: Advertising at $3.2B and Apps at $1.5B in 2024, showing moderate diversification. Uber dwarfs AppLovin with a broad mix—Mobility anchors $29.7B, Delivery $17.2B, and Freight $5.1B in 2025. Uber’s multi-segment dominance signals ecosystem lock-in, while AppLovin’s reliance on advertising heightens concentration risk amid market shifts.
Strengths and Weaknesses Comparison
This table compares the strengths and weaknesses of AppLovin Corporation (APP) and Uber Technologies, Inc. (UBER):
APP Strengths
- High net margin at 60.83%
- Exceptional ROE of 156.17%
- Strong ROIC at 60.71%
- High quick ratio at 3.32
- Significant interest coverage ratio of 20.06
- Revenue diversified across Advertising and Apps
- Solid global presence with growing US and Rest of World sales
UBER Strengths
- Favorable net margin at 19.33%
- Robust ROE of 37.18%
- Positive ROIC of 11.21%
- Moderate debt-to-assets ratio at 21.8%
- Strong interest coverage at 14.18
- Extensive global footprint including US, EMEA, Asia Pacific, Latin America
- Large diversified revenue streams: Mobility, Delivery, Freight
APP Weaknesses
- Unfavorable WACC at 15.1% exceeding ROIC risk
- High PE at 68.47 and PB at 106.94 indicate overvaluation
- Elevated debt-to-equity at 1.66
- Unfavorable current ratio despite strong quick ratio
- Zero dividend yield
- Moderate asset turnover at 0.75
UBER Weaknesses
- Lower net margin compared to APP
- PB ratio unfavorable at 6.27
- Neutral current ratio at 1.14 indicates limited liquidity buffer
- Zero dividend yield
- ROIC modest at 11.21% close to WACC
- Asset turnover neutral at 0.84
Both companies showcase strong profitability metrics, though APP’s extremely high ROE and ROIC come with valuation and leverage concerns. UBER presents a more balanced risk profile with a broader global reach and diversified revenue but faces pressure on margins and liquidity. Understanding these contrasts is critical for assessing each firm’s strategic positioning.
The Moat Duel: Analyzing Competitive Defensibility
A structural moat is the only reliable shield protecting long-term profits from relentless competitive erosion. Let’s uncover the nature of each company’s moat:
AppLovin Corporation: Data-Driven Switching Costs
AppLovin’s moat stems from high switching costs embedded in its mobile marketing platform. Its exceptional ROIC at 45.6% outpaces WACC by a wide margin, confirming strong value creation. The company’s expanding global footprint and product innovation in in-app bidding deepen this advantage in 2026.
Uber Technologies, Inc.: Network Effects and Market Scale
Uber leverages powerful network effects across mobility, delivery, and freight. Its ROIC modestly exceeds WACC by 2.4%, reflecting value creation but at a thinner margin than AppLovin. Uber’s geographic expansion and segment diversification offer growth, yet competition and regulatory risks could pressure margins.
Moat Strength: Switching Costs vs. Network Effects
AppLovin’s robust switching cost moat is deeper and more defensible, supported by its superior ROIC and margin stability. Uber’s network effect moat remains significant but narrower, facing higher operational risks. AppLovin is better positioned to defend and grow its market share in 2026.
Which stock offers better returns?
Over the past 12 months, AppLovin Corporation surged over 448%, while Uber Technologies, Inc. declined nearly 13%, reflecting contrasting market dynamics and investor sentiment.
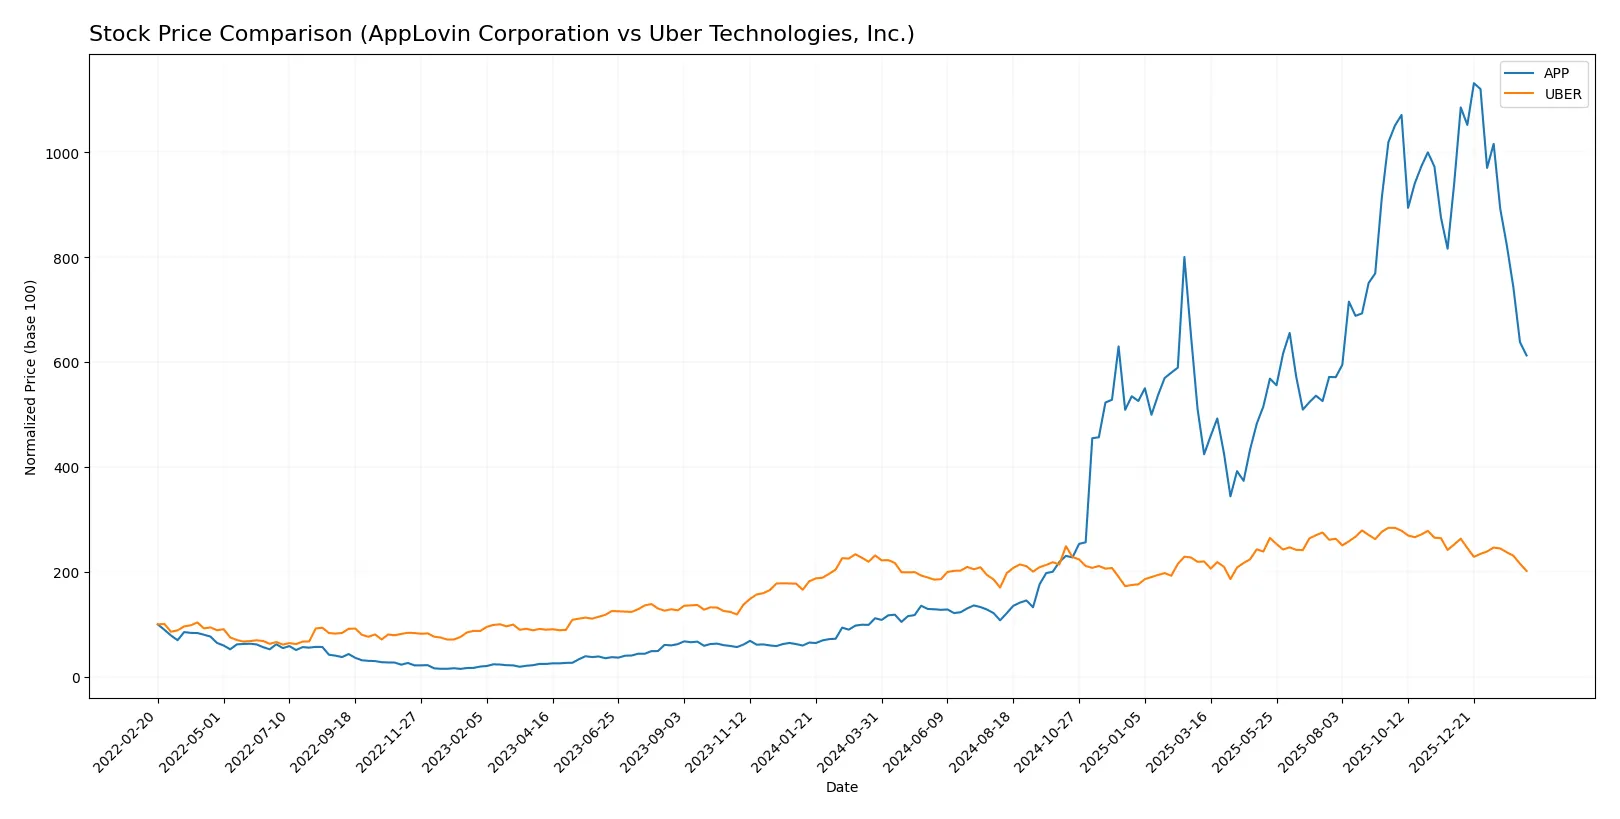
Trend Comparison
AppLovin’s stock shows a strong bullish trend with a 448.29% increase over 12 months, though recent months reveal a 34.85% decline and decelerating momentum from a peak of 721.37.
Uber’s stock exhibits a bearish trend, falling 12.76% over the year with continued deceleration. Its highest price reached 98.51, but recent declines accelerated to a 20.05% drop.
Comparing both, AppLovin delivered the highest market performance despite recent weakness, while Uber’s trend remains negative throughout the period.
Target Prices
Analysts present a bullish consensus for both AppLovin Corporation and Uber Technologies, indicating significant upside potential from current prices.
| Company | Target Low | Target High | Consensus |
|---|---|---|---|
| AppLovin Corporation | 543 | 835 | 690.93 |
| Uber Technologies, Inc. | 72 | 140 | 105.76 |
AppLovin’s consensus target of 690.93 suggests a substantial 77% premium to its current 390.55 price, reflecting confidence in its growth and monetization capabilities. Uber’s target consensus of 105.76 implies a 51% upside from 69.99, underscoring optimism about its diversified mobility and delivery model.

Don’t Let Luck Decide Your Entry Point
Optimize your entry points with our advanced ProRealTime indicators. You’ll get efficient buy signals with precise price targets for maximum performance. Start outperforming now!
How do institutions grade them?
Here is a comparison of recent institutional grades for AppLovin Corporation and Uber Technologies, Inc.:
AppLovin Corporation Grades
The following table summarizes recent grades from major financial institutions for AppLovin Corporation.
| Grading Company | Action | New Grade | Date |
|---|---|---|---|
| Wells Fargo | Maintain | Overweight | 2026-02-12 |
| Citigroup | Maintain | Buy | 2026-02-12 |
| RBC Capital | Maintain | Outperform | 2026-02-12 |
| UBS | Maintain | Buy | 2026-02-12 |
| Wedbush | Maintain | Outperform | 2026-02-12 |
| Piper Sandler | Maintain | Overweight | 2026-02-12 |
| Jefferies | Maintain | Buy | 2026-02-12 |
| Scotiabank | Maintain | Sector Outperform | 2026-02-12 |
| BTIG | Maintain | Buy | 2026-02-12 |
| Goldman Sachs | Maintain | Neutral | 2026-02-12 |
Uber Technologies, Inc. Grades
The following table summarizes recent grades from major financial institutions for Uber Technologies, Inc.
| Grading Company | Action | New Grade | Date |
|---|---|---|---|
| Citigroup | Maintain | Buy | 2026-02-06 |
| Morgan Stanley | Maintain | Overweight | 2026-02-05 |
| Wedbush | Maintain | Neutral | 2026-02-05 |
| Benchmark | Maintain | Hold | 2026-02-05 |
| JP Morgan | Maintain | Overweight | 2026-02-05 |
| Citizens | Upgrade | Market Outperform | 2026-02-05 |
| RBC Capital | Maintain | Outperform | 2026-02-05 |
| Wells Fargo | Maintain | Overweight | 2026-02-05 |
| Mizuho | Maintain | Outperform | 2026-02-05 |
| Needham | Maintain | Buy | 2026-02-05 |
Which company has the best grades?
AppLovin consistently receives strong buy and outperform ratings, while Uber’s grades mix buy, overweight, and neutral assessments. Investors may see AppLovin’s consensus as slightly more favorable, reflecting broader institutional confidence.
Risks specific to each company
The following categories identify the critical pressure points and systemic threats facing both firms in the 2026 market environment:
1. Market & Competition
AppLovin Corporation
- Faces intense competition in mobile app marketing with high innovation pace.
Uber Technologies, Inc.
- Competes in ride-sharing and delivery with regulatory and market pressure.
2. Capital Structure & Debt
AppLovin Corporation
- High debt-to-equity ratio (1.66) signals elevated financial leverage risk.
Uber Technologies, Inc.
- Moderate leverage (0.5 D/E), indicating a more conservative capital structure.
3. Stock Volatility
AppLovin Corporation
- High beta (2.49) reflects significant stock price volatility and market sensitivity.
Uber Technologies, Inc.
- Lower beta (1.206) implies more stable share price movements versus market.
4. Regulatory & Legal
AppLovin Corporation
- Subject to data privacy regulations impacting ad targeting capabilities.
Uber Technologies, Inc.
- Faces complex regulatory risks around labor laws and gig economy classification.
5. Supply Chain & Operations
AppLovin Corporation
- Relies on technology infrastructure and developer ecosystem stability.
Uber Technologies, Inc.
- Dependent on global driver and delivery partner networks, vulnerable to disruption.
6. ESG & Climate Transition
AppLovin Corporation
- Moderate ESG risks related to data security and user privacy.
Uber Technologies, Inc.
- Faces pressure to reduce carbon footprint amid transportation sector scrutiny.
7. Geopolitical Exposure
AppLovin Corporation
- International operations expose it to shifting tech trade policies.
Uber Technologies, Inc.
- Significant global footprint subjects it to diverse geopolitical tensions.
Which company shows a better risk-adjusted profile?
AppLovin’s most impactful risk stems from its high financial leverage and volatile stock, increasing vulnerability during market downturns. Uber faces significant regulatory and operational risks but maintains a stronger capital structure and lower stock volatility. Uber’s balanced financials and safer debt profile grant it a better risk-adjusted position in 2026. This is underscored by Uber’s favorable debt-to-assets ratio (21.8% vs. AppLovin’s 48.8%) and a much lower beta, suggesting more resilience in turbulent markets.
Final Verdict: Which stock to choose?
AppLovin Corporation’s superpower lies in its exceptional capital efficiency and soaring returns, signaling a stellar ability to generate value above its cost of capital. Its point of vigilance is the stretched valuation multiples and elevated leverage, which could amplify volatility. APP suits aggressive growth portfolios willing to tolerate elevated risk for outsized upside.
Uber Technologies, Inc. holds a strategic moat in its diversified platform and steady free cash flow generation, underpinned by manageable debt levels. It offers a more balanced risk profile compared to AppLovin, reflecting in its favorable financial stability scores. Uber fits well within GARP portfolios seeking growth tempered by relative safety and reasonable valuation.
If you prioritize rapid value creation and high return on invested capital, AppLovin stands out for delivering exceptional profitability despite higher leverage. However, if you seek a steadier growth trajectory with better balance sheet resilience, Uber offers better stability and a compelling moat at a more moderate valuation. Both present strong cases, but your choice hinges on your risk tolerance and investment horizon.
Disclaimer: Investment carries a risk of loss of initial capital. The past performance is not a reliable indicator of future results. Be sure to understand risks before making an investment decision.
Go Further
I encourage you to read the complete analyses of AppLovin Corporation and Uber Technologies, Inc. to enhance your investment decisions: