Home > Comparison > Technology > APP vs TYL
The strategic rivalry between AppLovin Corporation and Tyler Technologies, Inc. shapes the technology sector’s competitive landscape. AppLovin, a nimble mobile app marketing platform, contrasts with Tyler’s robust, integrated public sector software solutions. This clash highlights a growth-versus-stability dynamic within software applications. This analysis aims to identify which company’s business model offers superior risk-adjusted returns for a diversified portfolio navigating evolving digital demands.
Table of contents
Companies Overview
AppLovin and Tyler Technologies both hold significant positions in the software application market, shaping different verticals within the sector.
AppLovin Corporation: Mobile App Marketing Powerhouse
AppLovin dominates the mobile app marketing space by providing a software platform that connects advertisers and publishers through real-time auctions. Its core revenue stems from monetizing mobile app advertising via solutions like AppDiscovery and MAX. In 2026, its strategic focus centers on enhancing its auction-based marketing software to optimize ad inventory value globally.
Tyler Technologies, Inc.: Public Sector Software Leader
Tyler Technologies specializes in integrated information management for public sector agencies, covering financial management, judicial, and public safety software. Its revenue relies on modular software solutions and services for governments and schools. In 2026, it emphasizes cloud hosting collaborations, particularly with AWS, to modernize and scale its public sector software offerings.
Strategic Collision: Similarities & Divergences
AppLovin pursues a dynamic, demand-driven ad tech marketplace, while Tyler Technologies builds comprehensive, modular public sector software ecosystems. Both compete indirectly by targeting distinct customer bases but share a reliance on SaaS models. Their primary battleground lies in software innovation—AppLovin in mobile ad optimization, Tyler in government digital transformation. This contrast defines their unique investment profiles: high-growth tech versus stable, mission-critical software.
Income Statement Comparison
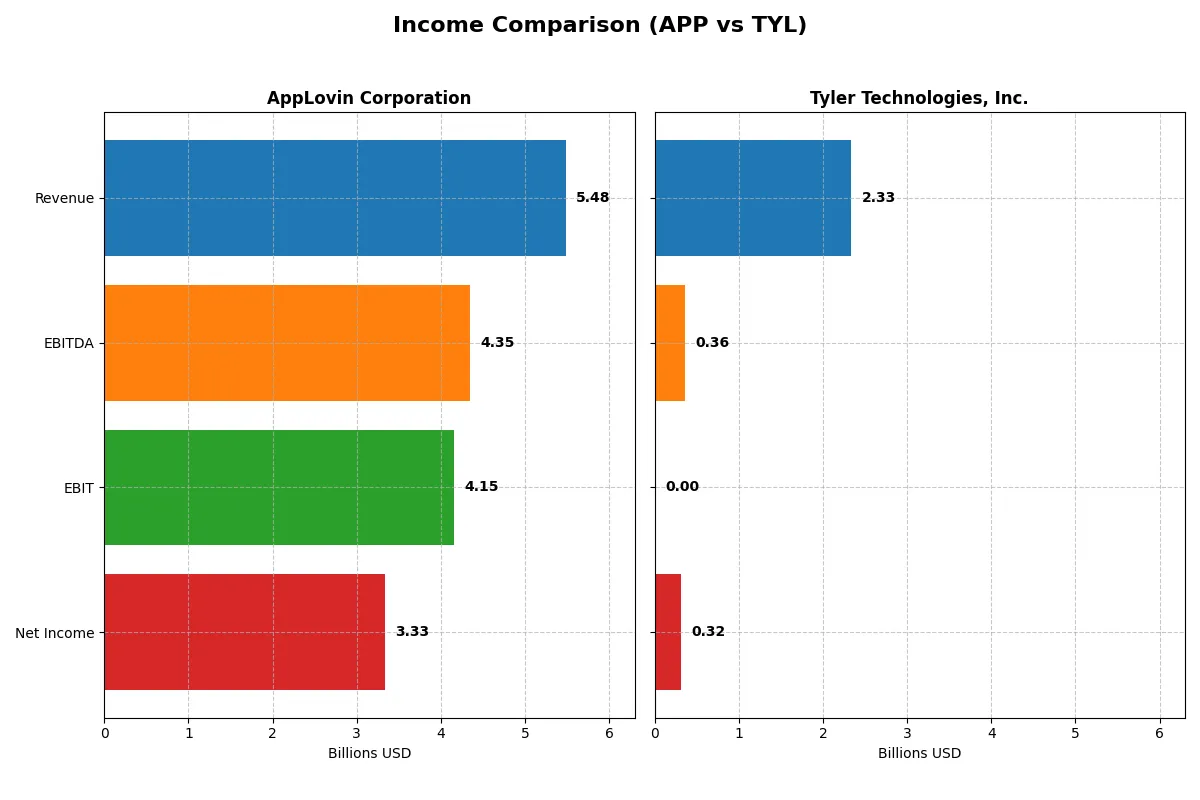
This data dissects the core profitability and scalability of both corporate engines to reveal who dominates the bottom line:
| Metric | AppLovin Corporation (APP) | Tyler Technologies, Inc. (TYL) |
|---|---|---|
| Revenue | 5.48B | 2.33B |
| Cost of Revenue | 665.1M | 1.25B |
| Operating Expenses | 663.7M | 669.6M |
| Gross Profit | 4.82B | 1.08B |
| EBITDA | 4.35B | 357.7M |
| EBIT | 4.15B | 0 |
| Interest Expense | 207.0M | -5.0M |
| Net Income | 3.33B | 315.6M |
| EPS | 9.84 | 7.32 |
| Fiscal Year | 2025 | 2025 |
Income Statement Analysis: The Bottom-Line Duel
This income statement comparison reveals the true efficiency of AppLovin and Tyler Technologies’ corporate engines over recent years.
AppLovin Corporation Analysis
AppLovin’s revenue nearly doubled from 2.8B in 2021 to 5.5B in 2025, with net income surging from a loss of 193M to 3.3B. Gross margin stands at a stellar 87.9%, and net margin at 60.8%, both reflecting exceptional profitability. The 2025 figures highlight impressive margin expansion and operating leverage unleashing strong momentum.
Tyler Technologies, Inc. Analysis
Tyler’s revenue grew steadily from 1.6B in 2021 to 2.3B in 2025, while net income almost doubled to 316M. Gross margin is a healthy 46.5%, but the EBIT margin fell to zero in 2025, signaling operational challenges. Despite strong net margin growth of 13.5%, the company’s operating efficiency appears pressured, tempering momentum.
Margin Mastery vs. Steady Growth
AppLovin dominates with superior margins, rapid profit escalation, and robust operating leverage. Tyler shows solid revenue gains and respectable net income growth but struggles with operating income consistency. Investors prioritizing margin power and profit acceleration find AppLovin’s profile more compelling, while Tyler suits those favoring steady, moderate growth.
Financial Ratios Comparison
These vital ratios act as a diagnostic tool to expose the underlying fiscal health, valuation premiums, and capital efficiency of the companies analyzed:
| Ratios | AppLovin Corporation (APP) | Tyler Technologies, Inc. (TYL) |
|---|---|---|
| ROE | 156.2% | 0% |
| ROIC | 60.7% | 0% |
| P/E | 68.5 | 62.0 |
| P/B | 106.9 | 0 |
| Current Ratio | 3.32 | 0 |
| Quick Ratio | 3.32 | 0 |
| D/E | 1.66 | 0 |
| Debt-to-Assets | 48.8% | 0% |
| Interest Coverage | 20.1 | -71.6 |
| Asset Turnover | 0.75 | 0 |
| Fixed Asset Turnover | 37.1 | 0 |
| Payout Ratio | 0 | 0 |
| Dividend Yield | 0 | 0 |
| Fiscal Year | 2025 | 2025 |
Efficiency & Valuation Duel: The Vital Signs
Financial ratios act as a company’s DNA, uncovering hidden risks and pinpointing operational strengths often missed in headline metrics.
AppLovin Corporation
AppLovin posts a stellar 156% ROE and a robust 60.8% net margin, signaling exceptional profitability. However, its valuation appears stretched with a P/E of 68.5 and a P/B of 107, reflecting high market expectations. The company pays no dividend, focusing instead on reinvestment in R&D, which supports growth but demands investor patience.
Tyler Technologies, Inc.
Tyler shows a modest 13.5% net margin but reports zero ROE and ROIC, indicating earnings challenges or accounting nuances. Its P/E stands at 62, suggesting a pricey valuation without strong profitability backing. Tyler offers no dividend and shows limited liquidity metrics, raising caution about its operational efficiency and shareholder returns.
Premium Valuation vs. Operational Safety
AppLovin exhibits superior profitability and reinvestment discipline despite stretched valuations, while Tyler’s metrics reveal operational weakness and less favorable financial health. AppLovin suits investors pursuing growth with risk tolerance; Tyler fits those awaiting turnaround signals or valuing lower leverage.
Which one offers the Superior Shareholder Reward?
AppLovin Corporation (APP) and Tyler Technologies, Inc. (TYL) both forgo dividends, focusing on reinvestment and buybacks to reward shareholders. APP boasts a higher free cash flow per share (11.7) versus TYL’s 14.8, but APP’s aggressive debt leverage (debt-to-equity 1.66) raises risk. APP lacks dividend payouts but maintains a robust buyback program fueled by strong operating margins (76%). TYL shows steadier profit margins (~13.5%) and a consistent buyback strategy supported by solid free cash flow coverage (97%). I observe that TYL’s conservative leverage and balanced reinvestment position it for sustainable shareholder value. In 2026, I favor Tyler Technologies for a superior total return profile given its prudent capital allocation and lower financial risk.
Comparative Score Analysis: The Strategic Profile
The radar chart reveals the fundamental DNA and trade-offs of AppLovin Corporation and Tyler Technologies, Inc.:
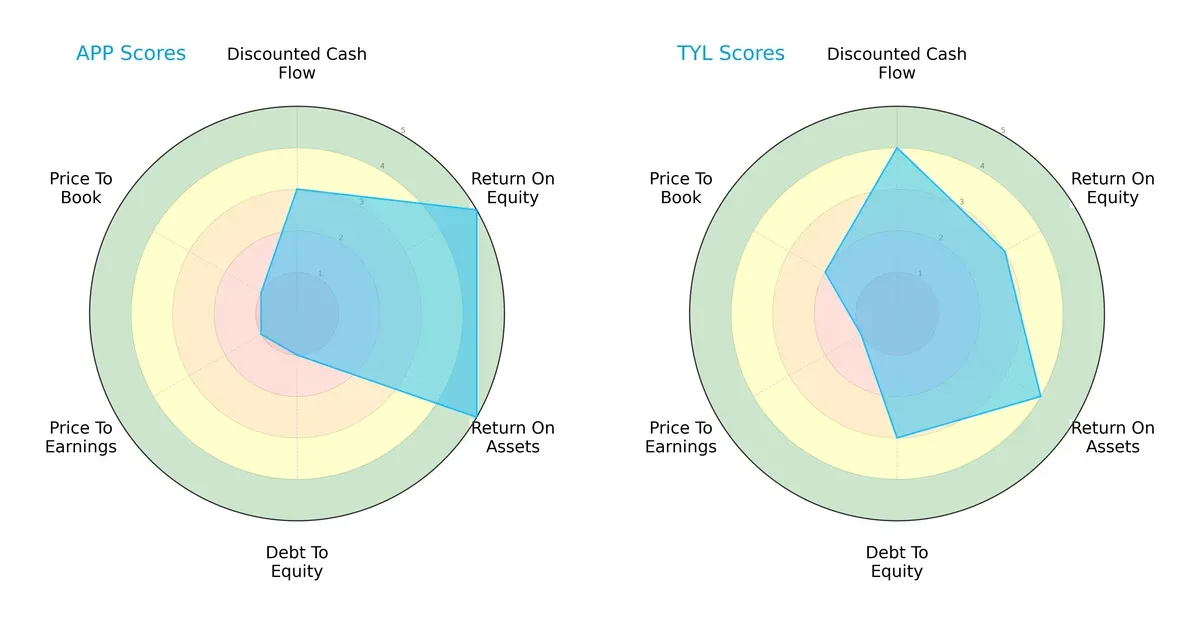
AppLovin excels in profitability metrics with top ROE and ROA scores (5 each), indicating efficient asset and equity use. Tyler Technologies shows a more balanced financial structure, with stronger debt management (Debt/Equity score 3 vs. 1) and better valuation metrics (Price-to-Book 2 vs. 1). AppLovin’s strengths lean heavily on operational efficiency but suffer from high leverage and rich valuation, while Tyler presents moderate performance across all categories, offering a steadier risk-reward profile.
Bankruptcy Risk: Solvency Showdown
The Altman Z-Score comparison signals a clear solvency advantage for AppLovin, scoring 18.3 versus Tyler’s 5.2, both safely above distress thresholds:
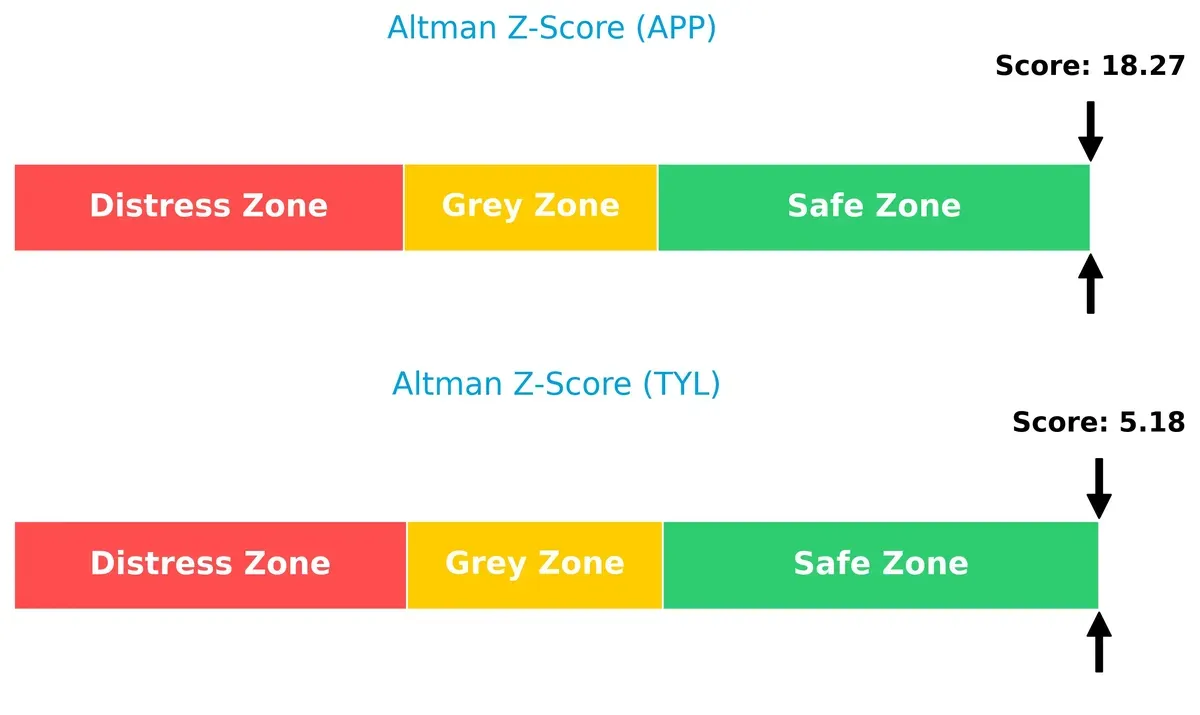
AppLovin’s exceptionally high Z-Score reflects superior financial stability and very low bankruptcy risk amid current market conditions. Tyler’s score, while safely in the zone, suggests more moderate resilience, implying investors should monitor its leverage and liquidity closely.
Financial Health: Quality of Operations
AppLovin’s Piotroski F-Score of 8 dwarfs Tyler’s 5, highlighting superior financial health and operational robustness:
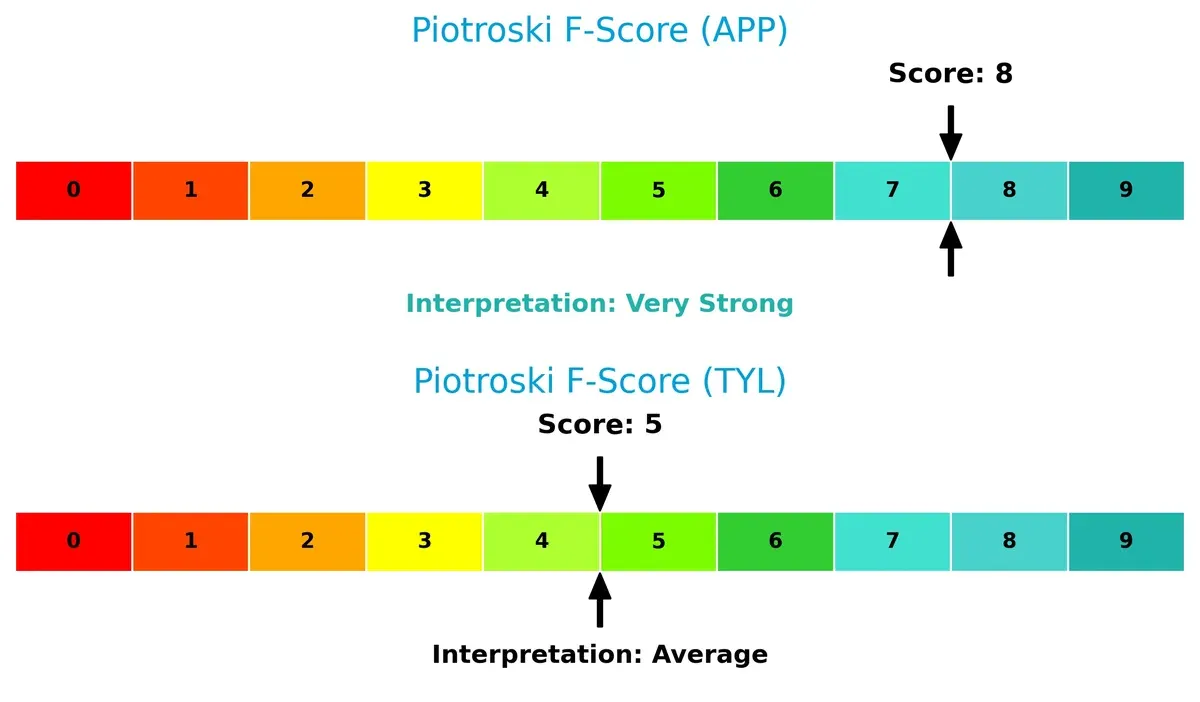
An F-Score of 8 positions AppLovin in peak financial shape, demonstrating strong profitability, liquidity, and efficiency. Tyler’s average score raises caution flags on internal metrics, suggesting room for improvement in operational quality and financial discipline.
How are the two companies positioned?
This section dissects APP and TYL’s operational DNA by comparing their revenue distribution and internal strengths and weaknesses. The goal is to confront their economic moats to identify which business model offers the most resilient and sustainable advantage today.
Revenue Segmentation: The Strategic Mix
The following visual comparison dissects how AppLovin Corporation and Tyler Technologies diversify their income streams and where their primary sector bets lie:
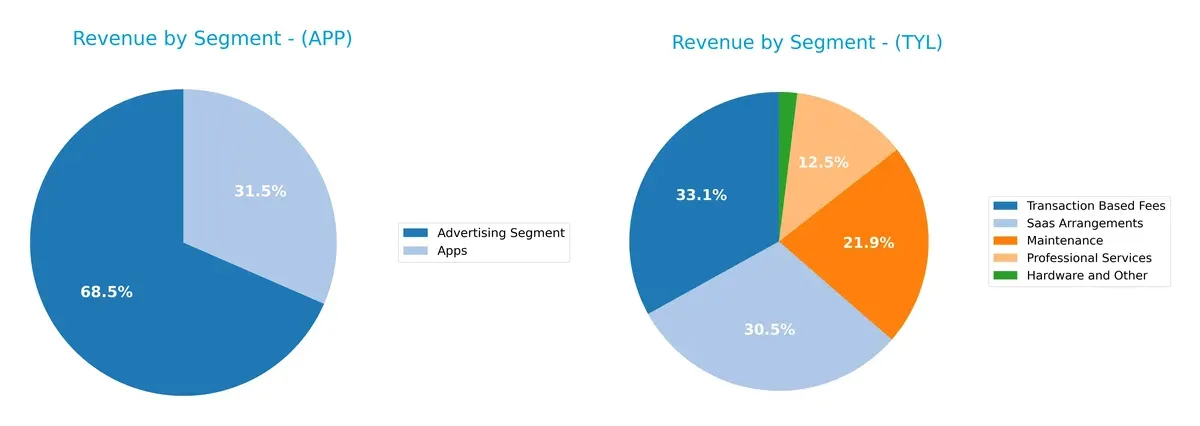
AppLovin anchors its revenue in Advertising with $3.22B, supplemented by $1.49B from Apps, showing a strong focus on digital marketing and app ecosystems. Tyler Technologies displays a far more diversified mix, splitting $698M in Transaction Based Fees, $645M in SaaS, $463M in Maintenance, and $264M in Professional Services. Tyler’s broad segmentation reduces concentration risk, while AppLovin’s dominance in advertising suggests reliance on ecosystem lock-in and market cycles.
Strengths and Weaknesses Comparison
This table compares the Strengths and Weaknesses of AppLovin Corporation and Tyler Technologies, Inc.:
AppLovin Corporation Strengths
- High net margin at 60.83%
- Exceptional ROE at 156.17%
- Strong ROIC at 60.71%
- Significant global presence with $2.7B US and $2B international revenue
- Diversified product segments including Advertising and Apps
- Favorable interest coverage at 20.06
Tyler Technologies, Inc. Strengths
- Favorable net margin at 13.53%
- Low debt-to-equity and debt-to-assets ratios
- Positive price-to-book ratio
- Diversified revenue streams including SaaS, professional services, and transaction fees
- Established enterprise software segment
AppLovin Corporation Weaknesses
- High WACC at 15.1%
- Unfavorable P/E at 68.47 and P/B at 106.94
- Elevated debt-to-equity at 1.66
- Unfavorable current ratio despite favorable quick ratio
- No dividend yield
- Neutral asset turnover
Tyler Technologies, Inc. Weaknesses
- Zero ROE and ROIC indicate weak profitability
- Unfavorable current and quick ratios
- Negative interest coverage
- Unavailable WACC data
- Unfavorable asset turnover and fixed asset turnover
- Zero dividend yield
Both companies show clear strengths in profitability and diversification but face challenges in financial leverage and liquidity. AppLovin’s global reach contrasts with Tyler’s domestic focus, influencing their strategic priorities.
The Moat Duel: Analyzing Competitive Defensibility
A structural moat alone protects long-term profits from relentless competition and market pressures. Let’s dissect the moats of two software industry players:
AppLovin Corporation: Data-Driven Network Effects
AppLovin leverages powerful network effects through its real-time auction platform, boosting marketing efficiency and monetization. Its very high ROIC and margin expansion confirm a solid moat. Expansion into new geographies and product innovation in 2026 should deepen this advantage.
Tyler Technologies, Inc.: Public Sector Integration
Tyler’s moat arises from deep integration with public sector workflows and high switching costs for government clients. However, declining ROIC and EBIT challenges signal weakening moat strength. Growth in SaaS offerings and cloud adoption in 2026 could stabilize but not yet strengthen its position.
Network Effects vs. Public Sector Entrenchment: A Moat Showdown
AppLovin’s moat is wider and growing, driven by scalable tech and robust financials. Tyler’s moat is narrower and under pressure, relying on legacy systems with slower innovation. AppLovin stands better equipped to defend and grow market share in the evolving software landscape.
Which stock offers better returns?
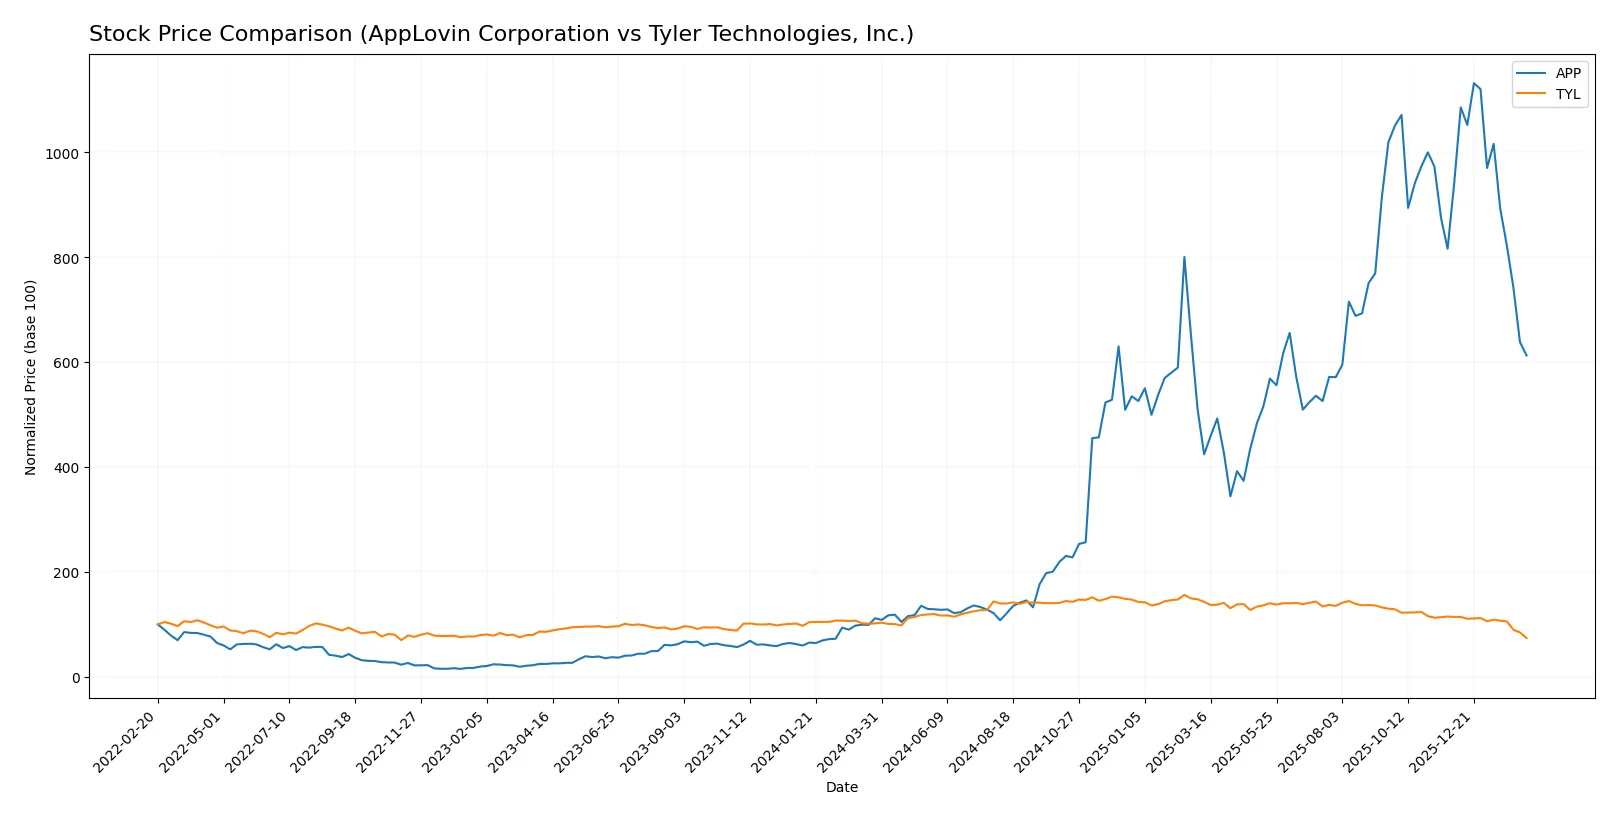
The past year saw AppLovin Corporation’s stock surge 448%, then decelerate sharply in recent months. Tyler Technologies, Inc. faced a steady decline of 27%, with recent losses accelerating.
Trend Comparison
AppLovin’s 12-month trend shows a strong 448% bullish gain with decelerating momentum. The stock hit a high of 721.37 and a low of 66.8, reflecting high volatility (std. dev. 197).
Tyler Technologies experienced a 27.5% bearish trend over 12 months, also decelerating. It ranged between 303.94 and 641.7, with moderate volatility (std. dev. 68).
AppLovin delivered the highest market performance with a significant bullish trend, while Tyler showed a consistent bearish decline over the past year.
Target Prices
Analysts show a bullish consensus on both AppLovin Corporation and Tyler Technologies, with target prices well above current levels.
| Company | Target Low | Target High | Consensus |
|---|---|---|---|
| AppLovin Corporation | 543 | 835 | 690.93 |
| Tyler Technologies, Inc. | 325 | 675 | 473.91 |
The target consensus implies significant upside potential for AppLovin and Tyler Technologies, currently trading at 390.55 and 303.94 respectively. This reflects strong analyst optimism versus present stock prices.

Don’t Let Luck Decide Your Entry Point
Optimize your entry points with our advanced ProRealTime indicators. You’ll get efficient buy signals with precise price targets for maximum performance. Start outperforming now!
How do institutions grade them?
AppLovin Corporation Grades
The following table shows recent analyst grades for AppLovin Corporation:
| Grading Company | Action | New Grade | Date |
|---|---|---|---|
| Wells Fargo | Maintain | Overweight | 2026-02-12 |
| Citigroup | Maintain | Buy | 2026-02-12 |
| RBC Capital | Maintain | Outperform | 2026-02-12 |
| UBS | Maintain | Buy | 2026-02-12 |
| Wedbush | Maintain | Outperform | 2026-02-12 |
| Piper Sandler | Maintain | Overweight | 2026-02-12 |
| Jefferies | Maintain | Buy | 2026-02-12 |
| Scotiabank | Maintain | Sector Outperform | 2026-02-12 |
| BTIG | Maintain | Buy | 2026-02-12 |
| Goldman Sachs | Maintain | Neutral | 2026-02-12 |
Tyler Technologies, Inc. Grades
The following table shows recent analyst grades for Tyler Technologies, Inc.:
| Grading Company | Action | New Grade | Date |
|---|---|---|---|
| Oppenheimer | Maintain | Outperform | 2026-02-13 |
| Piper Sandler | Maintain | Overweight | 2026-02-13 |
| Needham | Maintain | Buy | 2026-02-13 |
| TD Cowen | Maintain | Buy | 2026-02-13 |
| Evercore ISI Group | Maintain | In Line | 2026-02-13 |
| Wells Fargo | Maintain | Equal Weight | 2026-02-13 |
| Barclays | Maintain | Overweight | 2026-02-13 |
| Stifel | Maintain | Buy | 2026-02-13 |
| DA Davidson | Upgrade | Buy | 2026-02-11 |
| BTIG | Maintain | Buy | 2026-02-09 |
Which company has the best grades?
AppLovin receives consistently positive ratings, mainly Buy and Outperform, with one Neutral. Tyler Technologies also earns mostly Buy and Outperform grades, with a notable recent upgrade. Both show strong institutional confidence; investors should weigh these grades alongside other fundamentals.
Risks specific to each company
The following categories identify the critical pressure points and systemic threats facing both firms in the 2026 market environment:
1. Market & Competition
AppLovin Corporation
- Faces intense competition in mobile app marketing and monetization, requiring continuous innovation to maintain market share.
Tyler Technologies, Inc.
- Operates in public sector software with stable demand but faces pressure from emerging SaaS competitors and evolving government procurement practices.
2. Capital Structure & Debt
AppLovin Corporation
- High debt-to-equity ratio of 1.66 signals leverage risk; interest coverage is strong but debt burden limits financial flexibility.
Tyler Technologies, Inc.
- Low or no reported debt; strong balance sheet reduces financial risk but may limit growth leverage opportunities.
3. Stock Volatility
AppLovin Corporation
- Beta of 2.49 indicates high volatility, exposing investors to greater market swings amid tech sector cycles.
Tyler Technologies, Inc.
- Beta of 0.897 reflects lower volatility and defensive characteristics, appealing in uncertain markets.
4. Regulatory & Legal
AppLovin Corporation
- Subject to data privacy regulations impacting ad targeting and analytics; regulatory changes could disrupt business models.
Tyler Technologies, Inc.
- Faces compliance risk with public sector contracting and data security standards; slower regulatory shifts but significant impact if breached.
5. Supply Chain & Operations
AppLovin Corporation
- Relies on software platform stability and cloud infrastructure; operational risks include platform downtime and cyber threats.
Tyler Technologies, Inc.
- Depends on complex software integration and cloud hosting; operational risks stem from service disruptions and legacy system transitions.
6. ESG & Climate Transition
AppLovin Corporation
- ESG efforts in tech remain nascent; potential reputational risk if sustainability and data ethics are not proactively managed.
Tyler Technologies, Inc.
- Increasing demand for ESG-compliant public sector solutions; opportunity and risk tied to climate-related software and governance standards.
7. Geopolitical Exposure
AppLovin Corporation
- Global operations expose it to international regulatory conflicts, trade tensions, and currency fluctuations affecting revenues.
Tyler Technologies, Inc.
- Primarily US-focused reducing geopolitical risk but sensitive to federal and state policy shifts impacting contracts.
Which company shows a better risk-adjusted profile?
AppLovin’s highest risk lies in its leveraged capital structure and volatile stock price amid competitive pressures. Tyler Technologies faces operational complexity and regulatory compliance challenges but benefits from a stronger balance sheet and lower market volatility. Tyler’s risk-adjusted profile appears more stable in 2026. Recent data highlight AppLovin’s 1.66 debt-to-equity ratio as a key vulnerability, while Tyler’s safer Altman Z-score (5.18 vs. 18.27) and moderate Piotroski score reflect solid financial footing despite growth constraints.
Final Verdict: Which stock to choose?
AppLovin’s superpower lies in its exceptional value creation and accelerating profitability. It commands a steep premium, reflecting high expectations, while its elevated debt and stretched valuation are points of vigilance. This stock suits aggressive growth portfolios willing to tolerate volatility for outsized gains.
Tyler Technologies benefits from a durable strategic moat rooted in its niche software solutions and recurring revenue model. It offers a comparatively safer profile with steadier cash flows and moderate leverage. Tyler fits well within Growth at a Reasonable Price (GARP) portfolios focused on stable, long-term appreciation.
If you prioritize rapid value creation and can endure valuation risks, AppLovin outshines as a growth powerhouse. However, if you seek better stability and a resilient moat, Tyler Technologies offers a more conservative path with steady income potential. Each caters to distinct investor profiles navigating growth versus risk trade-offs.
Disclaimer: Investment carries a risk of loss of initial capital. The past performance is not a reliable indicator of future results. Be sure to understand risks before making an investment decision.
Go Further
I encourage you to read the complete analyses of AppLovin Corporation and Tyler Technologies, Inc. to enhance your investment decisions: