Home > Comparison > Technology > APP vs MSTR
The strategic rivalry between AppLovin Corporation and Strategy Inc shapes the evolving landscape of the technology sector. AppLovin operates as a dynamic platform builder for mobile app marketing and monetization, while Strategy Inc blends bitcoin treasury management with AI-driven enterprise analytics. This analysis pits AppLovin’s scalable software solutions against Strategy’s hybrid fintech approach to identify which corporate trajectory offers superior risk-adjusted returns for a diversified portfolio.
Table of contents
Companies Overview
AppLovin Corporation and Strategy Inc hold pivotal roles in the evolving software application sector, shaping digital marketing and analytics.
AppLovin Corporation: Mobile Marketing Innovator
AppLovin dominates the mobile app marketing space with its software platform that boosts app monetization and user acquisition. Its core revenue stems from auction-based advertising tools like AppDiscovery and MAX, which connect advertisers with publishers efficiently. In 2026, AppLovin sharpens its focus on real-time bidding and data-driven ad optimization to enhance client ROI globally.
Strategy Inc: Bitcoin Treasury and AI Insights Leader
Strategy Inc distinguishes itself as a bitcoin treasury company while expanding its footprint in AI-powered enterprise analytics. The firm generates revenue through bitcoin exposure instruments and software like Strategy One and Mosaic, which democratize data insight access for businesses. Its 2026 strategy emphasizes integrating blockchain asset management with cutting-edge AI analytics to empower decision-making across sectors.
Strategic Collision: Similarities & Divergences
Both companies leverage software innovation but diverge sharply in business models—AppLovin champions a data-driven advertising ecosystem, while Strategy Inc blends cryptocurrency treasury with AI analytics. Their primary competition lies in capturing enterprise tech budgets, albeit in distinct niches: mobile marketing versus blockchain and AI solutions. Investors face contrasting risk-reward profiles, reflecting AppLovin’s ad tech momentum and Strategy Inc’s bold crypto-analytics hybrid approach.
Income Statement Comparison
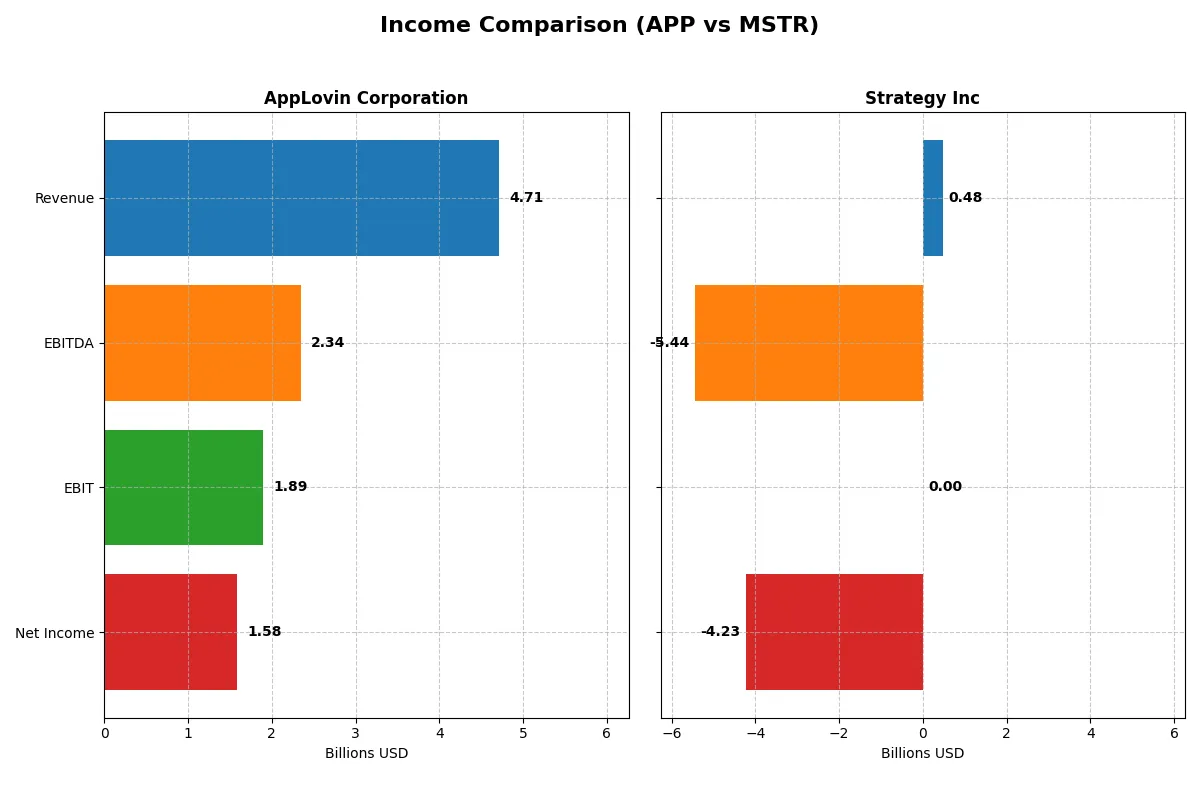
This data dissects the core profitability and scalability of both corporate engines to reveal who dominates the bottom line:
| Metric | AppLovin Corporation (APP) | Strategy Inc (MSTR) |
|---|---|---|
| Revenue | 4.71B | 477M |
| Cost of Revenue | 1.17B | 149M |
| Operating Expenses | 1.67B | 5.62B |
| Gross Profit | 3.54B | 328M |
| EBITDA | 2.34B | -5.44B |
| EBIT | 1.89B | 0 |
| Interest Expense | 318M | -65M |
| Net Income | 1.58B | -4.23B |
| EPS | 4.68 | -15.23 |
| Fiscal Year | 2024 | 2025 |
Income Statement Analysis: The Bottom-Line Duel
This income statement comparison exposes the true efficiency and profitability of each company’s business model over recent years.
AppLovin Corporation Analysis
AppLovin’s revenue surged from 1.45B in 2020 to 4.71B in 2024, reflecting strong top-line growth. Net income swung from losses early on to 1.58B in 2024, driving net margin up to 33.55%. Its gross margin remained robust above 75%, while operating efficiency and EPS growth accelerated sharply, signaling strong momentum and profitability.
Strategy Inc Analysis
Strategy Inc’s revenue hovered around 460M-510M from 2021 to 2025, showing minimal growth and a 6.56% decline over the period. The company posted steep net losses, culminating in a -4.23B net loss in 2025 with a negative net margin of -886%. Despite a decent gross margin near 69%, heavy operating expenses and other costs dragged down overall profitability.
Margin Strength vs. Structural Losses
AppLovin clearly outperforms Strategy Inc in revenue growth and profitability, boasting a superior 33.55% net margin versus Strategy’s deep losses. AppLovin’s efficient cost management and expanding margins mark it as the fundamental winner. Investors seeking sustainable earnings and growth will find AppLovin’s profile more compelling and resilient.
Financial Ratios Comparison
These vital ratios act as a diagnostic tool to expose the underlying fiscal health, valuation premiums, and capital efficiency of the companies compared below:
| Ratios | AppLovin Corporation (APP) | Strategy Inc (MSTR) |
|---|---|---|
| ROE | 1.45 | -0.06 |
| ROIC | 0.39 | -0.04 |
| P/E | 69.06 | -47.80 |
| P/B | 100.11 | 3.06 |
| Current Ratio | 2.19 | 0.71 |
| Quick Ratio | 2.19 | 0.71 |
| D/E | 3.26 | 0.40 |
| Debt-to-Assets | 0.61 | 0.28 |
| Interest Coverage | 5.89 | -29.92 |
| Asset Turnover | 0.80 | 0.02 |
| Fixed Asset Turnover | 23.71 | 5.73 |
| Payout ratio | 0 | 0 |
| Dividend yield | 0 | 0 |
| Fiscal Year | 2024 | 2024 |
Efficiency & Valuation Duel: The Vital Signs
Financial ratios act as a company’s DNA, exposing hidden risks and operational strengths that shape investor decisions.
AppLovin Corporation
AppLovin displays exceptional profitability with a 145% ROE and a robust 33.55% net margin, signaling operational efficiency. Its valuation appears stretched, reflected by a high 69.06 P/E and 100.11 P/B, indicating expensive stock pricing. The company eschews dividends, focusing on reinvestment in R&D and growth initiatives, which supports long-term shareholder value.
Strategy Inc
Strategy Inc suffers from poor profitability, with a negative 6.4% ROE and a sharply negative net margin of -251.73%, highlighting operational challenges. Its valuation is mixed: a favorable negative P/E contrasts with an unfavorable 3.06 P/B ratio. The company pays no dividends, and high expenses suggest limited free cash flow for shareholder returns, raising risk concerns.
Premium Valuation vs. Operational Safety
AppLovin offers superior profitability and operational metrics but at a premium valuation with leverage concerns. Strategy Inc struggles fundamentally, marked by weak returns and liquidity. AppLovin suits growth-seeking investors valuing operational excellence, while Strategy Inc fits those accepting higher risk for turnaround potential.
Which one offers the Superior Shareholder Reward?
AppLovin Corporation (APP) and Strategy Inc (MSTR) both eschew dividends, focusing on reinvestment and buybacks to drive shareholder value. APP boasts a strong free cash flow per share of 6.22 and maintains a robust buyback capacity with near 1.0 free cash flow to operating cash flow ratio. MSTR, however, suffers negative free cash flow (-115/share) and operating cash flow losses, limiting buyback potential. APP’s clean balance sheet and sustainable capital allocation contrast sharply with MSTR’s high leverage and cash constraints. I conclude APP offers a far superior total return profile in 2026 through disciplined reinvestment and sustainable buybacks.
Comparative Score Analysis: The Strategic Profile
The radar chart reveals the fundamental DNA and trade-offs of AppLovin Corporation and Strategy Inc, highlighting their competitive strengths and valuation contrasts:
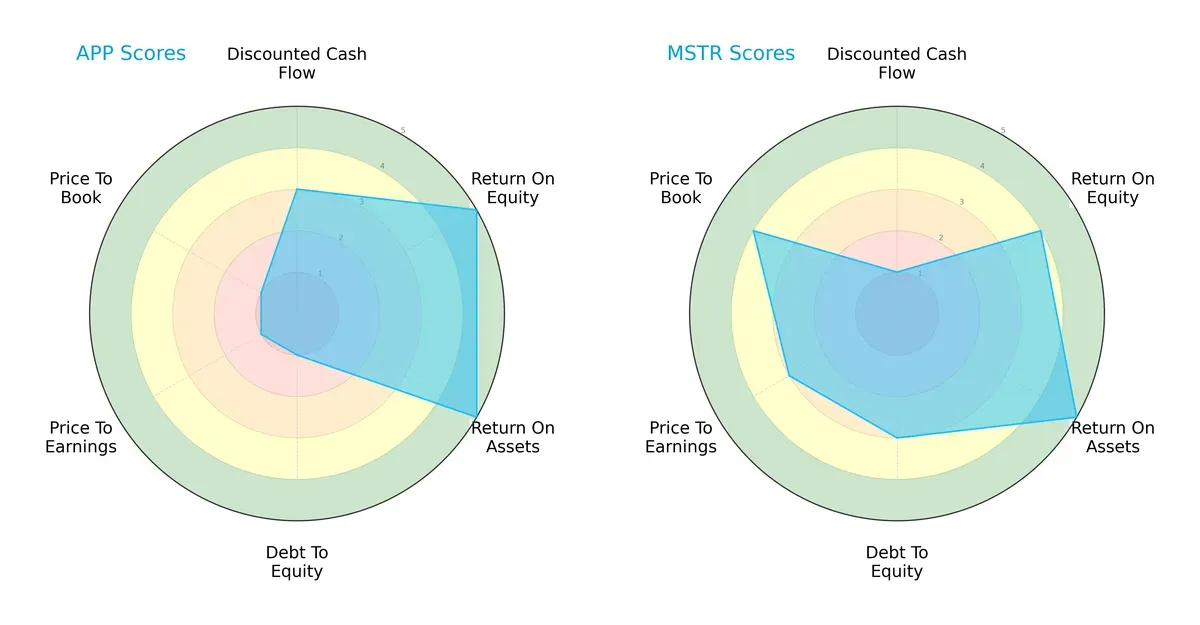
AppLovin excels in return metrics with top ROE and ROA scores (5 each), but suffers from high financial risk, reflected in its very unfavorable debt-to-equity and valuation scores (all 1s). Strategy Inc presents a more balanced profile, showing moderate debt risk (3) and favorable valuation (PE 3, PB 4), despite a weak DCF score (1). AppLovin relies on operational efficiency, while Strategy Inc offers steadier financial stability and valuation discipline.
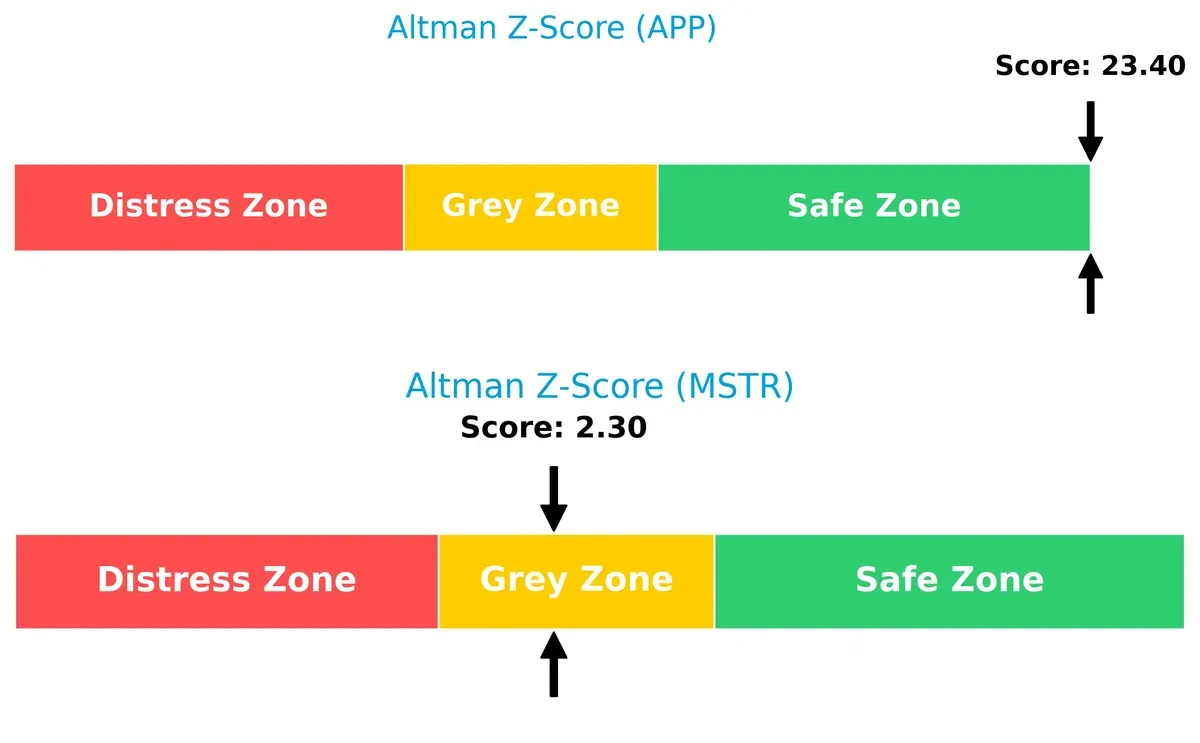
Bankruptcy Risk: Solvency Showdown
AppLovin’s Altman Z-Score of 23.4 signals a strong solvency position, while Strategy Inc’s 2.3 places it in a grey zone, implying moderate bankruptcy risk under current market conditions:
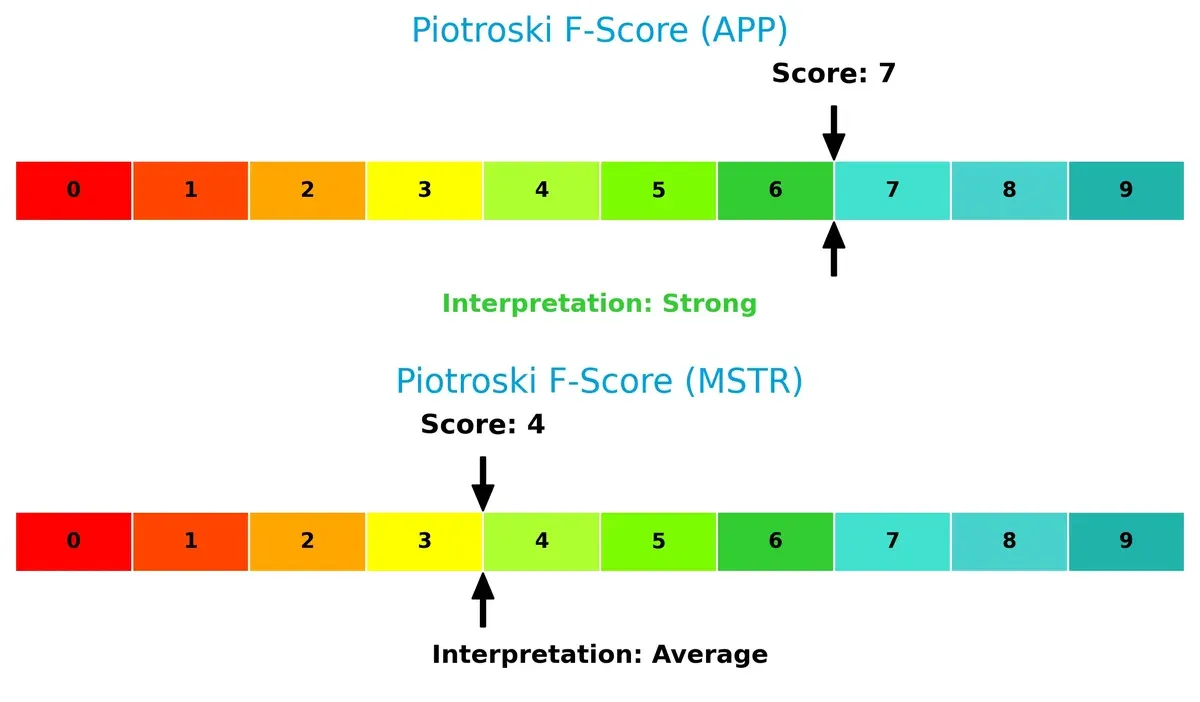
Financial Health: Quality of Operations
AppLovin’s Piotroski F-Score of 7 indicates robust financial health and strong internal metrics. Strategy Inc’s score of 4 suggests average financial strength with potential red flags:
How are the two companies positioned?
This section dissects the operational DNA of APP and MSTR by comparing their revenue distribution and internal dynamics. The goal is to confront their economic moats and identify which model offers the most resilient competitive advantage today.
Revenue Segmentation: The Strategic Mix
This visual comparison dissects how AppLovin Corporation and Strategy Inc diversify their income streams and highlights their primary sector bets:
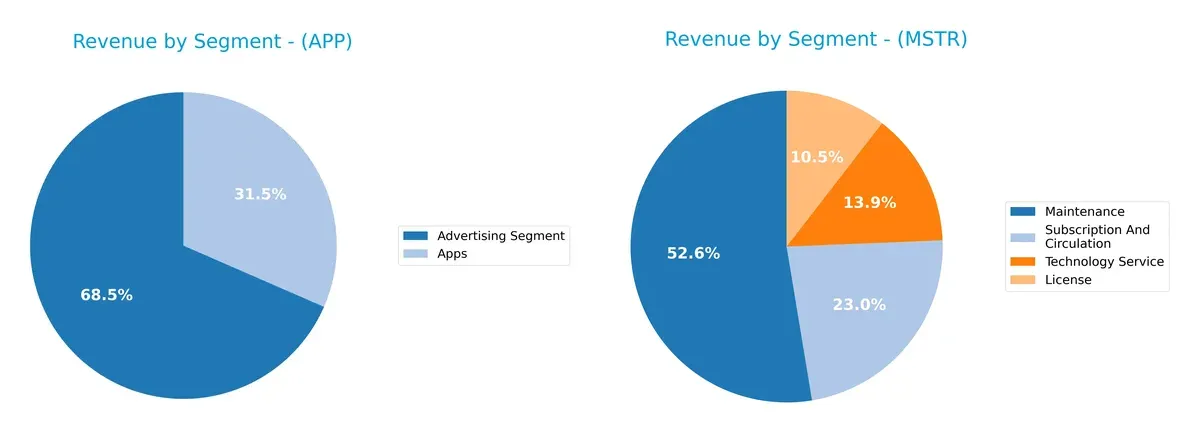
AppLovin anchors revenue in Advertising at $3.22B and Apps at $1.49B, showing heavy reliance on a digital advertising ecosystem. Strategy Inc presents a more diversified mix with Maintenance at $244M, Subscription at $107M, License at $49M, and Technology Service at $64M. AppLovin’s concentration risks contrast with Strategy Inc’s balanced streams, which suggest resilience through varied software licensing and service contracts.
Strengths and Weaknesses Comparison
This table compares the Strengths and Weaknesses of AppLovin Corporation (APP) and Strategy Inc (MSTR):
APP Strengths
- High net margin and ROE indicate strong profitability
- Favorable ROIC well above WACC shows effective capital allocation
- Healthy current and quick ratios reflect solid liquidity
- Significant global presence with large US and Rest of World revenue
- Diversified revenue from Advertising and Apps segments
- High fixed asset turnover implies efficient asset use
MSTR Strengths
- Low debt-to-equity and debt-to-assets ratios indicate conservative leverage
- Favorable PE despite negative earnings may signal market optimism
- Moderate fixed asset turnover suggests reasonable asset efficiency
- Geographic diversification across North America, EMEA, and other regions
- Multiple revenue streams including License, Maintenance, Subscription, and Technology Services
APP Weaknesses
- High WACC compared to ROIC increases capital cost risks
- Elevated debt levels raise financial risk
- Very high PE and PB ratios may imply overvaluation
- No dividend yield, potentially limiting income investors
- Moderate asset turnover signals room for operational improvement
MSTR Weaknesses
- Negative net margin, ROE, and ROIC indicate poor profitability
- Weak liquidity with low current and quick ratios raises short-term risk
- Negative interest coverage suggests difficulty servicing debt
- Low asset turnover reflects inefficient use of assets
- No dividend yield and unfavorable PB ratio highlight valuation concerns
AppLovin’s strengths lie in robust profitability and liquidity but face risks from leverage and valuation. Strategy Inc’s financials reveal significant profitability and liquidity challenges despite conservative leverage. These factors critically shape each firm’s strategic financial priorities.
The Moat Duel: Analyzing Competitive Defensibility
A structural moat alone shields long-term profits from competitive erosion, securing sustainable value creation and market strength for years ahead:
AppLovin Corporation: Data-Driven Network Effects
AppLovin’s moat stems from powerful network effects linking advertisers and publishers. Its 40% EBIT margin and soaring ROIC confirm efficient capital use. Expansion in global mobile markets deepens this moat in 2026.
Strategy Inc: Volatile Asset-Linked Brand
Strategy Inc relies on its Bitcoin treasury and AI analytics but lacks AppLovin’s operational efficiency. Negative net margins and declining ROIC highlight fragile profitability. Market disruption could come if AI tools gain broader adoption.
Profitability Resilience vs. Innovation Risk
AppLovin’s expanding ROIC and stable margins reveal a wider, more durable moat than Strategy Inc’s volatile earnings and shrinking returns. AppLovin stands better equipped to defend and grow its competitive position.
Which stock offers better returns?
The past year showed divergent price dynamics for AppLovin Corporation and Strategy Inc, with AppLovin’s strong overall gains contrasting Strategy’s extended decline.
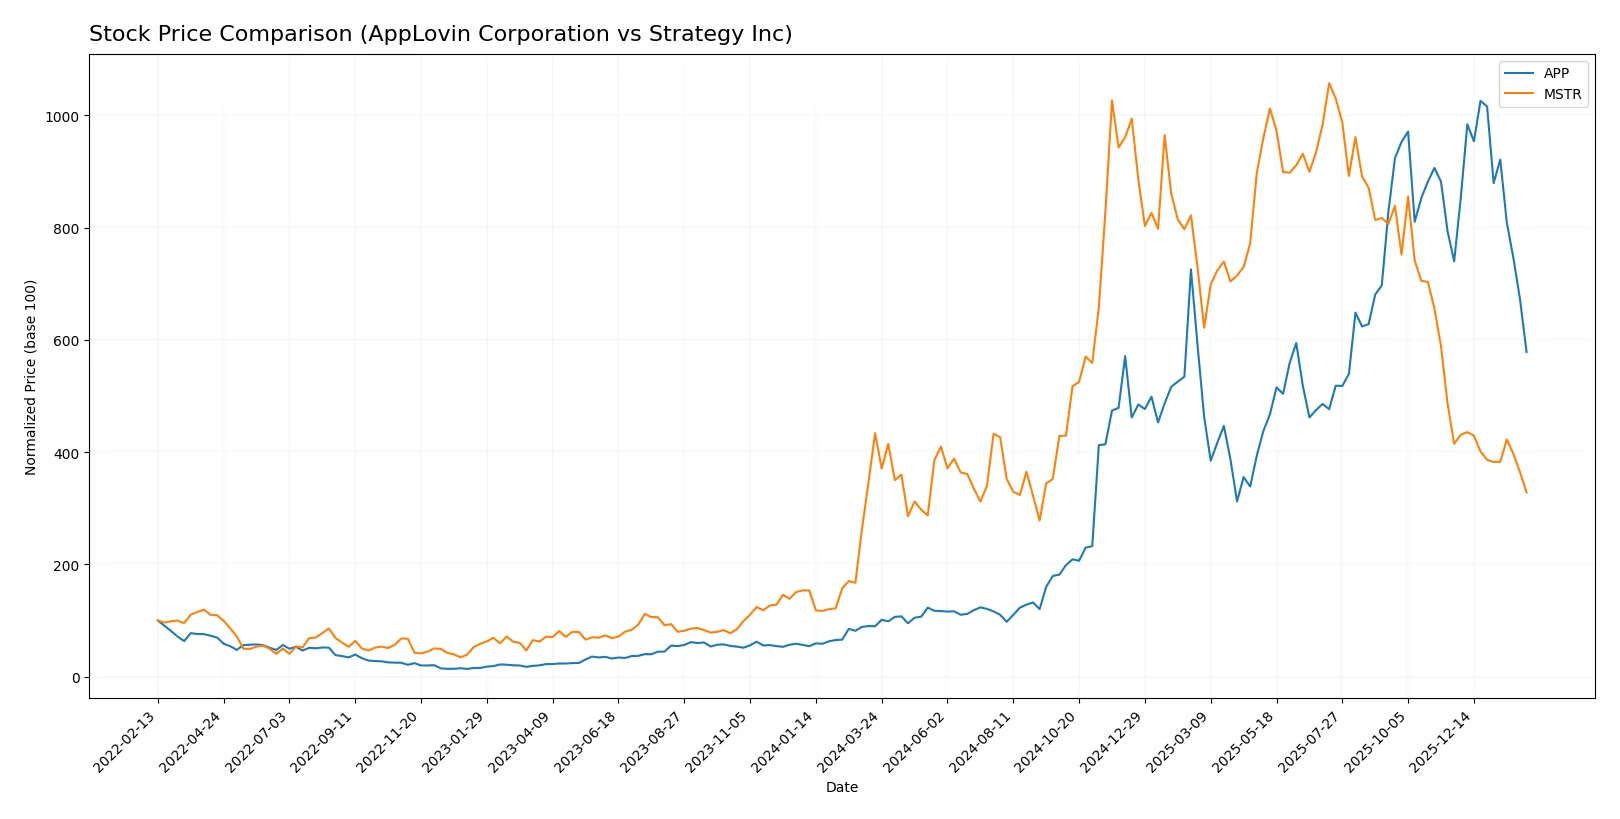
Trend Comparison
AppLovin Corporation’s stock surged 544.26% over the last 12 months, marking a clear bullish trend despite recent deceleration and a sharp 21.82% drop in the last quarter.
Strategy Inc’s stock declined 24.3% over the same period, confirming a bearish trend with continued deceleration and a 20.86% drop recently, indicating persistent downward pressure.
AppLovin delivered the highest market performance, outperforming Strategy Inc significantly despite short-term weakness and higher volatility.
Target Prices
Analysts present a broad but optimistic target price range for these technology firms.
| Company | Target Low | Target High | Consensus |
|---|---|---|---|
| AppLovin Corporation | 465 | 860 | 735.07 |
| Strategy Inc | 175 | 705 | 374.5 |
AppLovin’s consensus target stands about 81% above its current price of 407, signaling strong growth expectations. Strategy Inc’s target consensus is nearly triple its current 135 price, reflecting high volatility and bullish long-term prospects.

Don’t Let Luck Decide Your Entry Point
Optimize your entry points with our advanced ProRealTime indicators. You’ll get efficient buy signals with precise price targets for maximum performance. Start outperforming now!
How do institutions grade them?
This section compares the latest institutional grades for AppLovin Corporation and Strategy Inc:
AppLovin Corporation Grades
Below is a summary of recent grades assigned by major analysts for AppLovin Corporation.
| Grading Company | Action | New Grade | Date |
|---|---|---|---|
| Needham | Upgrade | Buy | 2026-01-26 |
| Morgan Stanley | Maintain | Overweight | 2026-01-13 |
| Wells Fargo | Maintain | Overweight | 2026-01-08 |
| Benchmark | Maintain | Buy | 2025-12-11 |
| Jefferies | Maintain | Buy | 2025-12-11 |
| Citigroup | Maintain | Buy | 2025-11-12 |
| Goldman Sachs | Maintain | Neutral | 2025-11-07 |
| Wells Fargo | Maintain | Overweight | 2025-11-07 |
| UBS | Maintain | Buy | 2025-11-06 |
| Wedbush | Maintain | Outperform | 2025-11-06 |
Strategy Inc Grades
The following table shows the recent institutional grades for Strategy Inc from recognized firms.
| Grading Company | Action | New Grade | Date |
|---|---|---|---|
| BTIG | Maintain | Buy | 2026-02-06 |
| Canaccord Genuity | Maintain | Buy | 2026-02-04 |
| Mizuho | Maintain | Outperform | 2026-01-16 |
| TD Cowen | Maintain | Buy | 2026-01-15 |
| Citigroup | Maintain | Buy | 2025-12-22 |
| Bernstein | Maintain | Outperform | 2025-12-08 |
| Monness, Crespi, Hardt | Upgrade | Neutral | 2025-11-10 |
| HC Wainwright & Co. | Maintain | Buy | 2025-11-03 |
| Canaccord Genuity | Maintain | Buy | 2025-11-03 |
| TD Cowen | Maintain | Buy | 2025-10-31 |
Which company has the best grades?
Both companies enjoy predominantly favorable grades with multiple Buy and Outperform ratings. Strategy Inc shows a slight edge with consistently maintained Buy or Outperform ratings and fewer Neutral grades, potentially reflecting stronger analyst confidence. Investors may perceive Strategy Inc as more favorably positioned based on these institutional endorsements.
Risks specific to each company
The following categories identify the critical pressure points and systemic threats facing both firms in the 2026 market environment:
1. Market & Competition
AppLovin Corporation
- Operates in a competitive app marketing software sector with strong tech rivals and rapid innovation cycles.
Strategy Inc
- Faces volatility from Bitcoin exposure and competition in AI analytics, plus fluctuating crypto market sentiment.
2. Capital Structure & Debt
AppLovin Corporation
- High debt-to-equity ratio (3.26) signals aggressive leverage, raising financial risk despite strong interest coverage.
Strategy Inc
- Lower leverage (0.4 debt-to-equity) offers more financial flexibility but poor interest coverage reflects earnings stress.
3. Stock Volatility
AppLovin Corporation
- Beta of 2.49 indicates high sensitivity to market swings, typical for tech growth firms.
Strategy Inc
- Extremely high beta (3.535) reveals significant volatility, mainly due to Bitcoin-related business risks.
4. Regulatory & Legal
AppLovin Corporation
- Faces standard tech sector regulatory compliance risks around data privacy and advertising standards.
Strategy Inc
- Exposure to evolving cryptocurrency regulations globally poses material legal uncertainties.
5. Supply Chain & Operations
AppLovin Corporation
- Relies on global app ecosystem stability and internet infrastructure, vulnerable to tech disruptions.
Strategy Inc
- Operational complexity due to dual focus on Bitcoin treasury and AI analytics may strain resources.
6. ESG & Climate Transition
AppLovin Corporation
- Moderate ESG risks typical of software firms; limited direct climate impact but increasing stakeholder scrutiny.
Strategy Inc
- Bitcoin mining exposure implies high energy use concerns, potentially impacting ESG ratings negatively.
7. Geopolitical Exposure
AppLovin Corporation
- Global markets presence subjects it to tech trade tensions and data sovereignty laws.
Strategy Inc
- Significant international Bitcoin operations expose it to geopolitical risks, including sanctions and crypto bans.
Which company shows a better risk-adjusted profile?
AppLovin’s biggest risk lies in its heavy leverage, threatening financial stability despite operational strength. Strategy Inc’s core risk is Bitcoin-related volatility and regulatory uncertainty, undermining earnings and liquidity. AppLovin shows a better risk-adjusted profile, supported by a robust Altman Z-Score (23.4, safe zone) versus Strategy’s 2.3 (grey zone). Strategy’s recent 26% stock surge contrasts with fragile fundamentals, underscoring heightened risk.
Final Verdict: Which stock to choose?
AppLovin Corporation’s superpower lies in its robust capital efficiency and soaring profitability, demonstrated by a sustained ROIC far above its cost of capital. Its main point of vigilance is the elevated debt load, which could amplify risks in a tightening credit environment. This stock suits aggressive growth portfolios hungry for high returns despite financial leverage.
Strategy Inc’s strategic moat is its conservative balance sheet and moderate valuation metrics, offering a defensive cushion missing in AppLovin’s profile. However, the company struggles with declining profitability and cash flow challenges, signaling caution. It appeals to portfolios favoring growth at a reasonable price, prioritizing stability over rapid expansion.
If you prioritize high-growth potential and are comfortable with leverage, AppLovin outshines due to its value creation and market momentum. However, if you seek better stability with a more traditional risk profile, Strategy Inc offers a safer haven despite its current struggles. Each presents a distinct analytical scenario aligned with different investor risk appetites.
Disclaimer: Investment carries a risk of loss of initial capital. The past performance is not a reliable indicator of future results. Be sure to understand risks before making an investment decision.
Go Further
I encourage you to read the complete analyses of AppLovin Corporation and Strategy Inc to enhance your investment decisions: