Home > Comparison > Technology > SHOP vs APP
The strategic rivalry between Shopify Inc. and AppLovin Corporation shapes the evolving landscape of the technology sector. Shopify operates as a comprehensive commerce platform, empowering merchants worldwide with scalable retail solutions. In contrast, AppLovin specializes in mobile app marketing and monetization software, targeting high-growth digital advertising. This analysis pits Shopify’s broad-based growth model against AppLovin’s focused innovation to identify the superior risk-adjusted investment opportunity for diversified portfolios.
Table of contents
Companies Overview
Shopify and AppLovin each hold pivotal roles in the evolving software application market, shaping commerce and mobile app monetization.
Shopify Inc.: Commerce Platform Powerhouse
Shopify stands as a leading commerce platform enabling merchants worldwide to manage sales across digital and physical channels. Its core revenue stems from subscription solutions and merchant services, including payments and fulfillment. In 2026, Shopify focuses on deepening merchant tools and expanding international reach to solidify its ecosystem and enhance user retention.
AppLovin Corporation: Mobile App Monetization Leader
AppLovin dominates as a software platform for app developers, specializing in marketing and monetization through real-time auctions and analytics. Its revenue engine centers on maximizing ad inventory value and campaign optimization for clients globally. The company’s 2026 strategy emphasizes technology innovation in ad bidding and privacy-centric analytics to sustain growth amid tightening data regulations.
Strategic Collision: Similarities & Divergences
Both firms operate within the software application sector but diverge in business philosophies: Shopify cultivates an integrated commerce ecosystem, while AppLovin offers an open, data-driven advertising infrastructure. Their primary battleground lies in capturing digital engagement—Shopify in merchant commerce and AppLovin in mobile app marketing. This distinction shapes their unique risk and growth profiles, appealing to investors seeking either platform dominance or ad tech innovation.
Income Statement Comparison
This data dissects the core profitability and scalability of both corporate engines to reveal who dominates the bottom line:

| Metric | Shopify Inc. (SHOP) | AppLovin Corporation (APP) |
|---|---|---|
| Revenue | 11.6B | 5.48B |
| Cost of Revenue | 6.00B | 665M |
| Operating Expenses | 4.09B | 664M |
| Gross Profit | 5.56B | 4.82B |
| EBITDA | 1.50B | 4.35B |
| EBIT | 1.47B | 4.15B |
| Interest Expense | 0 | 207M |
| Net Income | 1.23B | 3.33B |
| EPS | 0.95 | 9.84 |
| Fiscal Year | 2025 | 2025 |
Income Statement Analysis: The Bottom-Line Duel
This income statement comparison reveals which company runs its business with stronger efficiency and sustainable profit momentum.
Shopify Inc. Analysis
Shopify’s revenue climbed sharply from $4.6B in 2021 to $11.6B in 2025, reflecting robust top-line growth. Gross and net margins hover around 48% and 10.6%, respectively, signaling solid profitability. However, net income declined over the period, falling to $1.2B in 2025 from $2.9B in 2021, indicating margin pressure despite revenue gains.
AppLovin Corporation Analysis
AppLovin’s revenue nearly doubled from $2.8B in 2021 to $5.5B in 2025, with gross margin soaring to 87.9%. Net income surged dramatically to $3.3B in 2025 from just $32M in 2021, propelled by exceptional net margins above 60%. The company exhibits high operating leverage and accelerating profitability.
Margin Dominance vs. Revenue Expansion
AppLovin outperforms Shopify with superior margin expansion and explosive net income growth. Shopify shows impressive revenue scale but struggles with declining profitability. For investors prioritizing efficiency and bottom-line strength, AppLovin’s profile appears significantly more attractive.
Financial Ratios Comparison
These vital ratios act as a diagnostic tool to expose the underlying fiscal health, valuation premiums, and capital efficiency of the companies compared below:
| Ratios | Shopify Inc. (SHOP) | AppLovin Corporation (APP) |
|---|---|---|
| ROE | 9.14% | 156.17% |
| ROIC | 15.66% | 60.71% |
| P/E | 170x | 68.47x |
| P/B | 15.52x | 106.94x |
| Current Ratio | 12.86 | 3.32 |
| Quick Ratio | 12.86 | 3.32 |
| D/E | 0.014 | 1.66 |
| Debt-to-Assets | 1.24% | 48.83% |
| Interest Coverage | 0 | 20.06 |
| Asset Turnover | 0.76 | 0.75 |
| Fixed Asset Turnover | 81.96 | 37.06 |
| Payout ratio | 0% | 0% |
| Dividend yield | 0% | 0% |
| Fiscal Year | 2025 | 2025 |
Efficiency & Valuation Duel: The Vital Signs
Ratios act as a company’s DNA, exposing hidden operational strengths and risks that raw numbers alone cannot reveal.
Shopify Inc.
Shopify shows moderate profitability with a 9.14% ROE and a net margin of 10.65%, reflecting decent earnings efficiency. Its valuation is stretched, with a high P/E of 170 and P/B of 15.5, indicating expensive stock pricing. The company pays no dividends, instead reinvesting heavily in R&D to fuel growth, which suits long-term expansion.
AppLovin Corporation
AppLovin delivers exceptional profitability, boasting a 156% ROE and a stellar 60.8% net margin. Despite strong returns, valuation remains elevated with a P/E of 68 and an extremely high P/B of 107, suggesting potential overvaluation. It also forgoes dividends, focusing on growth investments reflected in its solid operating metrics and capital returns.
High Returns Meet High Valuations: Risk-Reward Balance
AppLovin offers superior profitability but carries valuation risks with a sky-high P/B ratio. Shopify’s metrics suggest a more modest return profile but higher valuation extremes. Investors seeking aggressive growth might lean toward AppLovin, while those preferring steadier operational footing may find Shopify fits better.
Which one offers the Superior Shareholder Reward?
Shopify Inc. (SHOP) and AppLovin Corporation (APP) both forego dividends, favoring reinvestment and share buybacks. Shopify maintains a zero dividend payout ratio and no dividend yield, reflecting a pure growth reinvestment strategy supported by strong free cash flow (FCF) coverage near 99%. Its buyback activity, although present, is modest compared to APP. AppLovin also pays no dividends but demonstrates a robust free cash flow yield with a 100% FCF to operating cash flow ratio and an aggressive buyback stance, intensifying shareholder returns. APP’s higher leverage (debt-to-equity ~1.66 vs. SHOP’s 0.014) raises risk but fuels growth and buybacks. Historically, APP’s superior EBIT margin (75.8% vs. SHOP’s 12.7%) and higher net income per share (~9.84 vs. 0.95) indicate stronger cash-generating efficiency. However, APP’s elevated price-to-book (~107) and price-to-earnings (~68) ratios imply rich valuation risk. SHOP’s conservative balance sheet with a current ratio of ~12.9 supports sustainability. I conclude APP offers superior total shareholder reward potential in 2026, driven by aggressive buybacks and margin dominance, but SHOP provides a safer, more sustainable growth path. Investors must weigh APP’s higher risk for greater reward versus SHOP’s prudent capital allocation.
Comparative Score Analysis: The Strategic Profile
The radar chart reveals the fundamental DNA and trade-offs of Shopify Inc. and AppLovin Corporation’s financial profiles, highlighting their core strategic strengths and weaknesses:
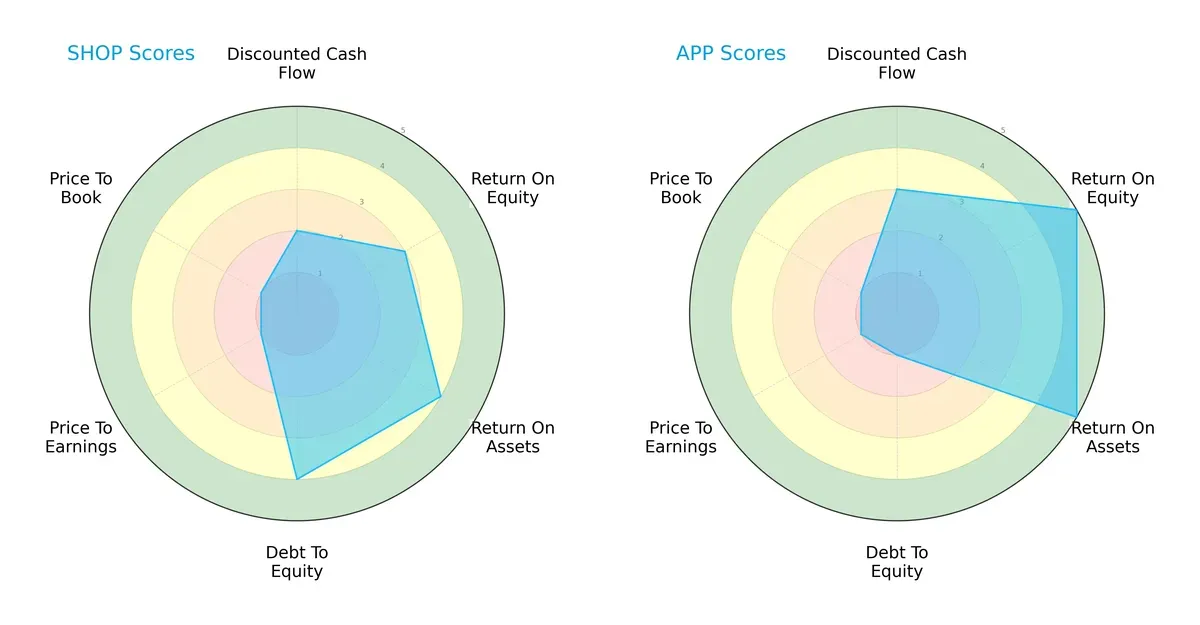
AppLovin commands superiority in profitability metrics, scoring 5 in both ROE and ROA compared to Shopify’s moderate 3 and favorable 4, respectively. Shopify excels in financial stability with a debt-to-equity score of 4, while AppLovin registers a concerning 1, indicating higher leverage risk. Both face valuation challenges, scoring poorly (1) on P/E and P/B ratios. Shopify presents a more balanced profile, whereas AppLovin relies heavily on operational efficiency despite elevated financial risk.
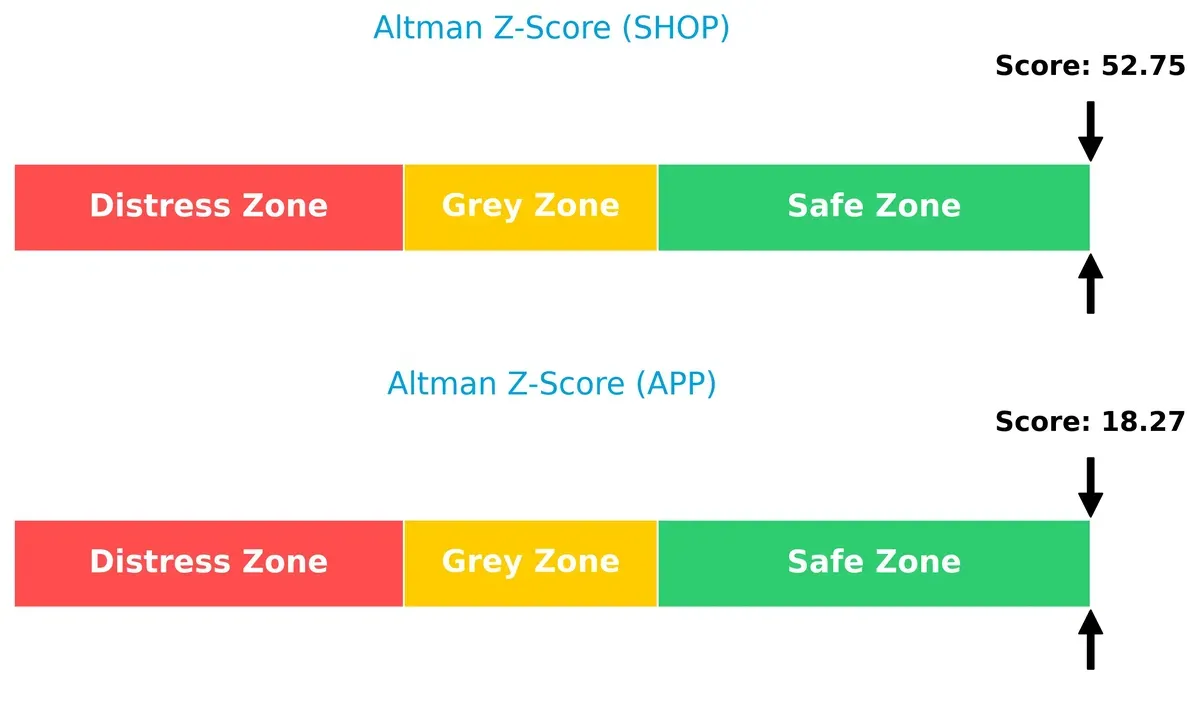
Bankruptcy Risk: Solvency Showdown
The Altman Z-Scores place both companies firmly in the safe zone, but Shopify’s exceptional score of 52.8 far exceeds AppLovin’s 18.3, signaling far stronger long-term solvency and lower bankruptcy risk in volatile cycles:
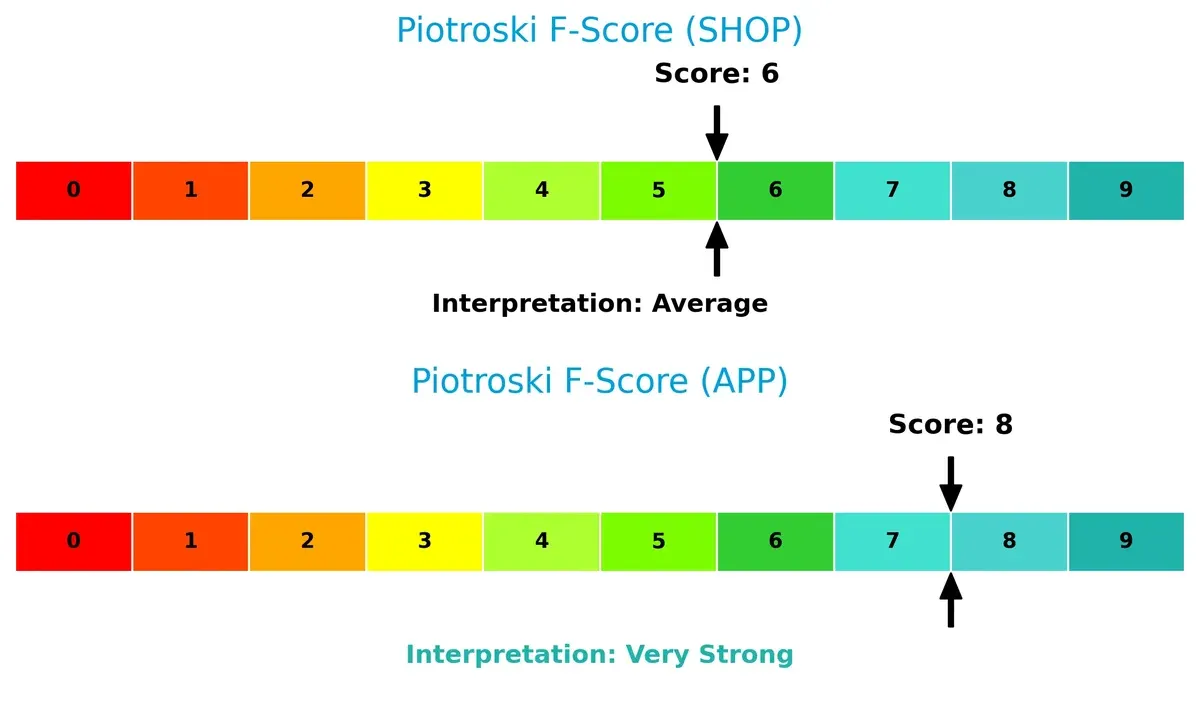
Financial Health: Quality of Operations
AppLovin outperforms Shopify with a Piotroski F-Score of 8 versus 6, indicating superior financial health and operational quality. Shopify’s average score raises mild red flags on internal metrics, suggesting room for operational improvement:
How are the two companies positioned?
This section dissects Shopify and AppLovin’s operational DNA by comparing revenue distribution and internal dynamics. The goal is to confront their economic moats and identify which model offers the most resilient competitive advantage today.
Revenue Segmentation: The Strategic Mix
This visual comparison dissects how Shopify Inc. and AppLovin Corporation diversify their income streams and reveals their primary sector bets for strategic positioning:

Shopify leans heavily on its Service segment with $8.8B in 2025, supplemented by $2.75B from Subscriptions, showing moderate diversification. AppLovin pivots around its Advertising segment at $3.22B and Apps at $1.49B in 2024, indicating reliance on digital ad revenues. Shopify’s mix suggests infrastructure dominance supporting merchants, while AppLovin faces concentration risk tied to advertising market fluctuations.
Strengths and Weaknesses Comparison
This table compares the strengths and weaknesses of Shopify and AppLovin based on diversification, profitability, financials, innovation, global presence, and market share:
Shopify Strengths
- Highly diversified revenue streams across services and subscriptions
- Strong quick ratio and low debt levels
- Exceptional fixed asset turnover indicates efficient asset use
AppLovin Strengths
- Superior profitability with high net margin, ROE, and ROIC
- Strong interest coverage and fixed asset turnover
- Balanced revenue from US and Rest of World segments
Shopify Weaknesses
- Unfavorable ROIC below WACC indicates value destruction
- Extremely high P/E and P/B ratios suggest overvaluation
- Very high current ratio hints at inefficient asset deployment
- No dividend yield limits income investors
AppLovin Weaknesses
- Elevated debt-to-equity ratio increases financial risk
- Unfavorable WACC and high P/B ratio may pressure valuation
- Lower current ratio than Shopify could constrain liquidity
- No dividend yield reduces shareholder income
Both companies show strengths in different areas: Shopify excels in asset efficiency and low leverage, while AppLovin demonstrates superior profitability and market reach. However, valuation concerns and liquidity metrics pose risks that may impact their strategic flexibility.
The Moat Duel: Analyzing Competitive Defensibility
A structural moat shields long-term profits from competition’s relentless pressure. Only durable moats preserve value over decades:
Shopify Inc.: Platform Network Effects Driving Merchant Loyalty
Shopify’s moat stems from strong network effects connecting merchants and buyers across multiple sales channels. This manifests in steady gross margins near 48%. However, its ROIC trails WACC, signaling value erosion despite improving profitability. Expansion into new payment and fulfillment services in 2026 could reinforce its position.
AppLovin Corporation: Data-Driven Advertising Cost Advantage
AppLovin leverages proprietary algorithms to optimize mobile ad auctions, creating a cost advantage over competitors. Its exceptional ROIC exceeds WACC by 45%, with superb margin expansion above 60%. Continued AI innovation and global market penetration in 2026 should deepen its competitive edge beyond Shopify’s network effects.
Platform Network Effects vs. Algorithmic Cost Leadership
AppLovin commands a deeper moat through superior capital returns and margin dominance. Shopify’s network effects create scale but struggle to translate into economic profit currently. AppLovin is better positioned to defend and grow its market share amid intensifying competition.
Which stock offers better returns?
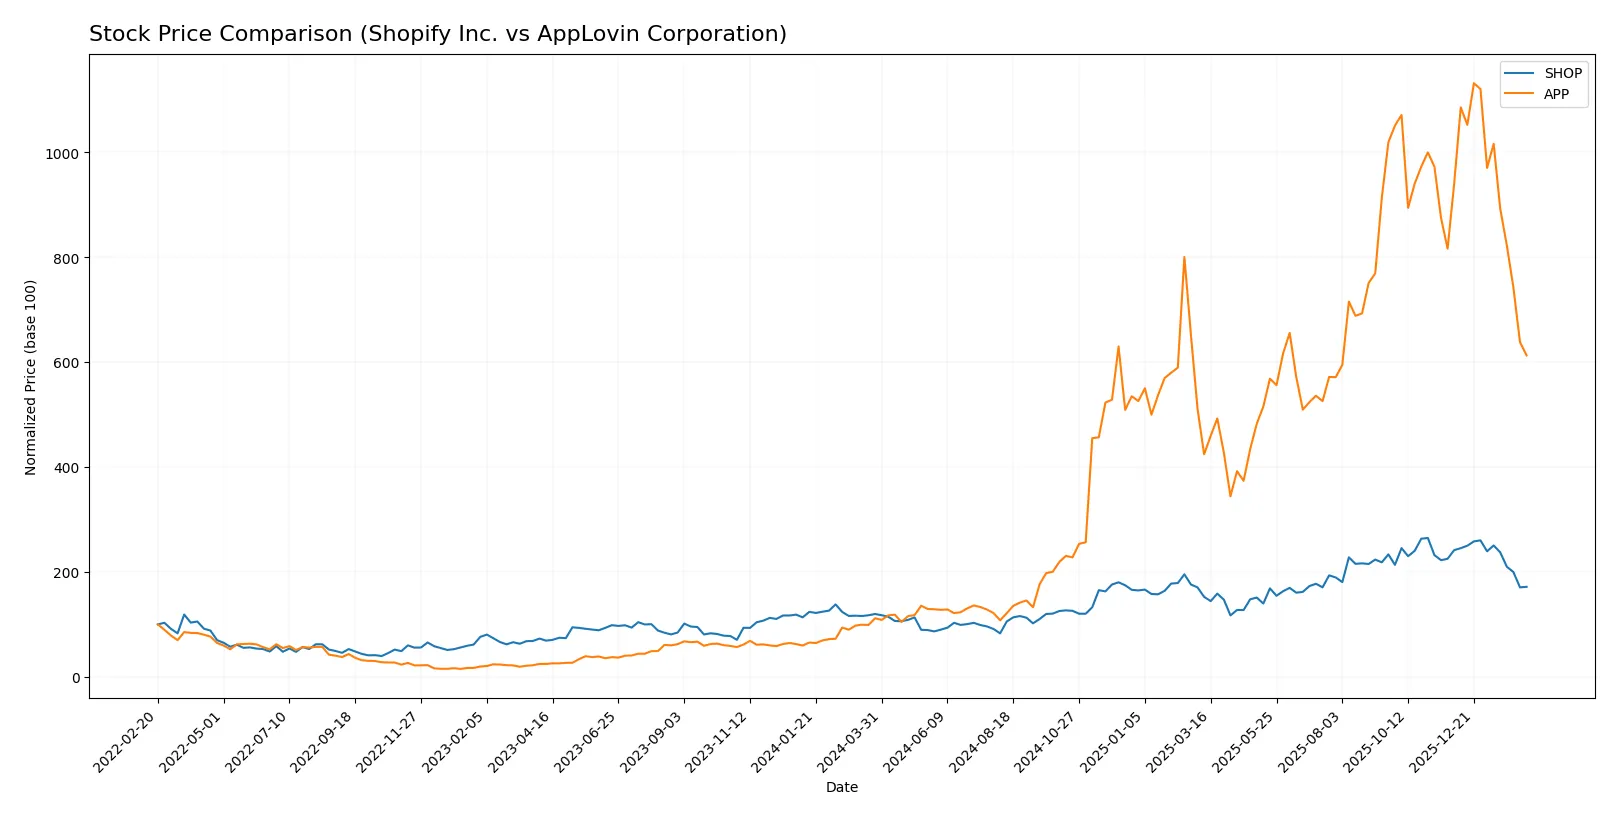
Over the past 12 months, Shopify and AppLovin exhibited strong bullish trends with significant price gains, though recent months show notable downward pressure on both stocks.
Trend Comparison
Shopify’s stock rose 43.17% over the last year with a bullish but decelerating trend, peaking at 173.86 and bottoming at 54.43. Recent months show a 28.96% decline with moderate volatility.
AppLovin surged 448.29% annually, also bullish with deceleration, reaching 721.37 at its high and 66.8 at its low. The recent period reveals a sharper 34.85% drop and higher volatility.
AppLovin outperformed Shopify in market returns despite both facing recent declines, delivering the highest overall price appreciation in the past 12 months.
Target Prices
Analysts present a robust target consensus for Shopify Inc. and AppLovin Corporation, signaling strong upside potential.
| Company | Target Low | Target High | Consensus |
|---|---|---|---|
| Shopify Inc. | 115 | 200 | 167.04 |
| AppLovin Corporation | 543 | 835 | 690.93 |
The consensus targets exceed current prices significantly—Shopify trades near 113, well below its 167 consensus. AppLovin’s 391 price also lags behind its 691 target, reflecting elevated growth expectations.

Don’t Let Luck Decide Your Entry Point
Optimize your entry points with our advanced ProRealTime indicators. You’ll get efficient buy signals with precise price targets for maximum performance. Start outperforming now!
How do institutions grade them?
Shopify Inc. Grades
Here are the latest grades and actions from major financial institutions for Shopify Inc.:
| Grading Company | Action | New Grade | Date |
|---|---|---|---|
| Citigroup | Maintain | Buy | 2026-02-13 |
| Wells Fargo | Maintain | Overweight | 2026-02-12 |
| Truist Securities | Maintain | Hold | 2026-02-12 |
| UBS | Maintain | Neutral | 2026-02-12 |
| Mizuho | Upgrade | Outperform | 2026-02-12 |
| Citizens | Maintain | Market Outperform | 2026-02-12 |
| RBC Capital | Maintain | Outperform | 2026-02-12 |
| BMO Capital | Maintain | Outperform | 2026-02-12 |
| Cantor Fitzgerald | Maintain | Neutral | 2026-02-12 |
| Barclays | Maintain | Equal Weight | 2026-02-12 |
AppLovin Corporation Grades
Below are the most recent institutional grades and recommendations for AppLovin Corporation:
| Grading Company | Action | New Grade | Date |
|---|---|---|---|
| Wells Fargo | Maintain | Overweight | 2026-02-12 |
| Citigroup | Maintain | Buy | 2026-02-12 |
| RBC Capital | Maintain | Outperform | 2026-02-12 |
| UBS | Maintain | Buy | 2026-02-12 |
| Wedbush | Maintain | Outperform | 2026-02-12 |
| Piper Sandler | Maintain | Overweight | 2026-02-12 |
| Jefferies | Maintain | Buy | 2026-02-12 |
| Scotiabank | Maintain | Sector Outperform | 2026-02-12 |
| BTIG | Maintain | Buy | 2026-02-12 |
| Goldman Sachs | Maintain | Neutral | 2026-02-12 |
Which company has the best grades?
AppLovin has received more “Buy” and “Outperform” grades compared to Shopify’s mix of “Buy,” “Outperform,” and “Neutral.” This suggests stronger institutional confidence in AppLovin, potentially influencing investor sentiment and market performance.
Risks specific to each company
The following categories identify critical pressure points and systemic threats facing both firms in the 2026 market environment:
1. Market & Competition
Shopify Inc.
- Faces intense competition in e-commerce platform space with pressure to innovate and maintain merchant base.
AppLovin Corporation
- Operates in highly competitive mobile ad tech market with rapid technology shifts and reliance on app developer ecosystem.
2. Capital Structure & Debt
Shopify Inc.
- Maintains very low debt (D/E 0.01), reducing financial risk and interest burden to near zero.
AppLovin Corporation
- Carries significant leverage (D/E 1.66), increasing vulnerability to rising interest rates and credit market tightening.
3. Stock Volatility
Shopify Inc.
- Exhibits high beta (2.82), indicating strong sensitivity to market swings and elevated volatility.
AppLovin Corporation
- Slightly lower beta (2.49) but still shows substantial price fluctuations compared to broader tech sector.
4. Regulatory & Legal
Shopify Inc.
- Must navigate global e-commerce regulations including data privacy and cross-border trade compliance.
AppLovin Corporation
- Faces regulatory scrutiny on user data handling and advertising practices, especially with evolving privacy laws.
5. Supply Chain & Operations
Shopify Inc.
- Relies on third-party logistics and payment processors, risking disruption in fulfillment and transaction services.
AppLovin Corporation
- Depends on cloud infrastructure and app developer partnerships, vulnerable to technology outages or partner shifts.
6. ESG & Climate Transition
Shopify Inc.
- Increasing pressure to adopt sustainable practices across supply chain and reduce carbon footprint.
AppLovin Corporation
- Faces emerging demands to demonstrate ESG commitment in data centers and advertising content policies.
7. Geopolitical Exposure
Shopify Inc.
- Exposure to global trade tensions impacting cross-border e-commerce and currency fluctuations.
AppLovin Corporation
- Geopolitical risks in international advertising markets may affect revenue diversification and growth.
Which company shows a better risk-adjusted profile?
Shopify’s greatest risk lies in fierce market competition and innovation demands, while AppLovin’s leverage poses a significant financial vulnerability. AppLovin’s strong profitability contrasts with its heavy debt load, whereas Shopify’s clean balance sheet offers stability despite lower returns. Given the data, Shopify presents a safer risk-adjusted profile amid 2026 market uncertainties. The stark difference in debt-to-equity ratios and interest coverage highlights this disparity clearly.
Final Verdict: Which stock to choose?
Shopify Inc. (SHOP) shines as a cash-efficient powerhouse with a rapidly growing profitability trend, despite currently shedding value relative to its cost of capital. Its strong liquidity and operational resilience make it a point of vigilance for risk-conscious investors. SHOP fits well within aggressive growth portfolios seeking future upside.
AppLovin Corporation (APP) commands a formidable strategic moat through exceptional returns on invested capital and a sustainable competitive advantage. Its robust profitability and high-quality earnings profile offer better stability than SHOP, albeit with higher leverage risk. APP suits investors favoring GARP strategies focused on scalable, high-margin businesses.
If you prioritize capital efficiency and liquidity with a tolerance for near-term valuation stretch, Shopify appears the compelling choice due to its operational turnaround and growth potential. However, if you seek superior profitability and a durable moat with a willingness to accept leverage risk, AppLovin offers better stability and value creation in the medium term.
Disclaimer: Investment carries a risk of loss of initial capital. The past performance is not a reliable indicator of future results. Be sure to understand risks before making an investment decision.
Go Further
I encourage you to read the complete analyses of Shopify Inc. and AppLovin Corporation to enhance your investment decisions: