In today’s fast-evolving tech landscape, AppLovin Corporation and PTC Inc. stand out as innovators in the software application industry. Both companies leverage cutting-edge technology to serve diverse markets—AppLovin focuses on mobile app marketing and monetization, while PTC excels in digital transformation and product lifecycle solutions. This article will explore their strengths and challenges to help you decide which company deserves a place in your investment portfolio.
Table of contents
Companies Overview
I will begin the comparison between AppLovin Corporation and PTC Inc. by providing an overview of these two companies and their main differences.
AppLovin Corporation Overview
AppLovin Corporation focuses on building a software platform for mobile app developers to improve marketing and monetization globally. Their solutions include AppDiscovery for marketing, Adjust for analytics and campaign optimization, and MAX for in-app bidding. Founded in 2011 and headquartered in Palo Alto, California, AppLovin operates in the software application industry with a market cap of approximately 194B USD.
PTC Inc. Overview
PTC Inc. is a software and services company operating globally across the Americas, Europe, and Asia Pacific. It offers platforms like ThingWorx for digital transformation, Vuforia for augmented reality, and Onshape for SaaS product development. Founded in 1985 and based in Boston, Massachusetts, PTC serves industries with product lifecycle management and application lifecycle solutions, holding a market cap near 20B USD.
Key similarities and differences
Both companies operate in the software application sector and are listed on NASDAQ. AppLovin primarily targets mobile app developers with marketing and monetization software, while PTC specializes in industrial software solutions including CAD, PLM, and AR technologies. AppLovin is smaller in employee count (1.5K) compared to PTC’s 7.5K, and AppLovin’s market cap is nearly ten times larger, reflecting different market focuses and scales.
Income Statement Comparison
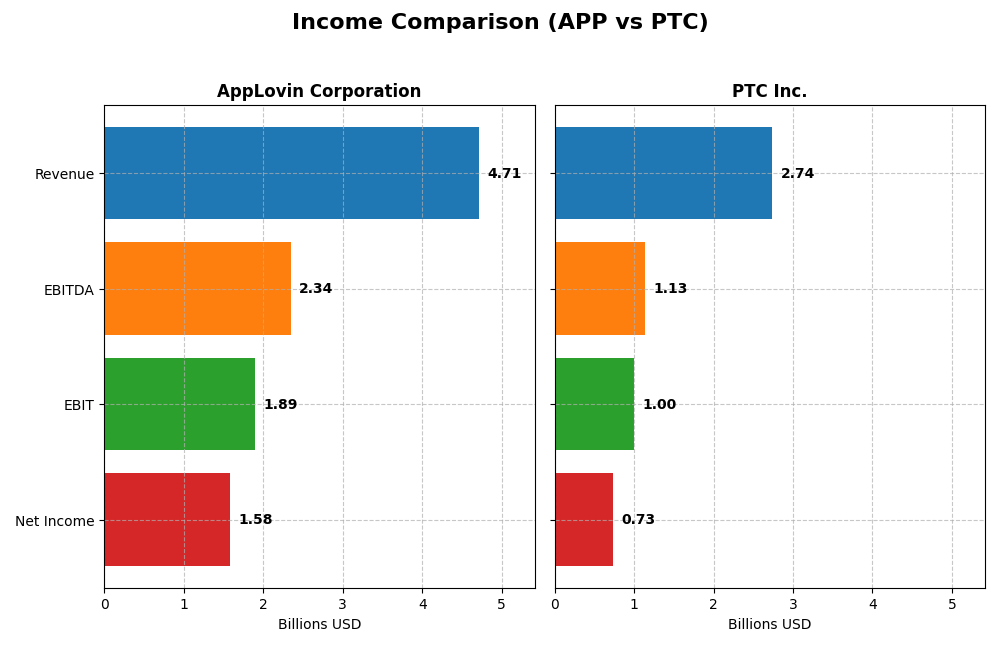
Below is a comparison of the most recent fiscal year financial results for AppLovin Corporation and PTC Inc., highlighting key income statement metrics.
| Metric | AppLovin Corporation | PTC Inc. |
|---|---|---|
| Market Cap | 194.2B | 19.9B |
| Revenue | 4.71B | 2.74B |
| EBITDA | 2.34B | 1.13B |
| EBIT | 1.89B | 997M |
| Net Income | 1.58B | 734M |
| EPS | 4.68 | 6.18 |
| Fiscal Year | 2024 | 2025 |
Income Statement Interpretations
AppLovin Corporation
AppLovin’s revenue and net income have shown strong growth from 2020 to 2024, with revenue increasing from $1.45B to $4.71B and net income recovering from a loss to $1.58B. Margins improved significantly, with a gross margin of 75.22% and net margin at 33.55% in 2024. The latest year saw accelerated growth in revenue (+43.44%) and net income (+208.75%), indicating robust profitability improvements.
PTC Inc.
PTC’s revenue rose steadily from $1.81B in 2021 to $2.74B in 2025, with net income also growing from $477M to $734M. Margins remained healthy, with a gross margin of 83.76% and net margin of 26.8% in 2025. The most recent year recorded solid revenue growth (+19.18%) and a strong net margin increase (+63.66%), demonstrating consistent operational efficiency and profit expansion.
Which one has the stronger fundamentals?
Both companies exhibit favorable income statement evaluations with over 90% favorable metrics. AppLovin shows exceptional net income growth and margin expansion, reflecting rapid scaling and profitability gains. PTC maintains higher gross margins and stable interest expenses, signaling efficient cost control. The choice depends on whether one prioritizes rapid growth (AppLovin) or steady margin strength (PTC).
Financial Ratios Comparison
The table below presents the most recent key financial ratios for AppLovin Corporation and PTC Inc., providing a snapshot of their profitability, liquidity, leverage, and efficiency as of their latest fiscal periods.
| Ratios | AppLovin Corporation (2024) | PTC Inc. (2025) |
|---|---|---|
| ROE | 145% | 19.2% |
| ROIC | 38.7% | 14.4% |
| P/E | 69.1 | 33.2 |
| P/B | 100.1 | 6.37 |
| Current Ratio | 2.19 | 1.12 |
| Quick Ratio | 2.19 | 1.12 |
| D/E (Debt to Equity) | 3.26 | 0.36 |
| Debt-to-Assets | 60.6% | 20.7% |
| Interest Coverage | 5.89 | 12.8 |
| Asset Turnover | 0.80 | 0.41 |
| Fixed Asset Turnover | 23.7 | 15.6 |
| Payout Ratio | 0 | 0 |
| Dividend Yield | 0 | 0 |
Interpretation of the Ratios
AppLovin Corporation
AppLovin shows strong profitability with a net margin of 33.55%, ROE of 144.96%, and ROIC of 38.7%, indicating efficient capital usage. However, its high debt-to-equity ratio of 3.26 and debt-to-assets at 60.59% raise financial risk concerns. The company does not pay dividends, likely prioritizing growth and reinvestment given its zero dividend yield and absence of payout.
PTC Inc.
PTC’s ratios reveal balanced financial health with a net margin of 26.8%, ROE of 19.18%, and ROIC of 14.43%, all favorable. It maintains low leverage with a debt-to-equity of 0.36 and debt-to-assets at 20.7%, reducing solvency risks. Like AppLovin, PTC does not pay dividends, possibly focusing on reinvestment and growth strategies without share buybacks.
Which one has the best ratios?
PTC presents a more conservative financial structure with lower leverage and higher interest coverage, suggesting stronger solvency. AppLovin excels in profitability but carries higher debt risk and unfavorable valuation multiples. PTC’s slightly higher proportion of favorable ratios and lower financial risk position it as having more balanced ratios overall.
Strategic Positioning
This section compares the strategic positioning of AppLovin Corporation and PTC Inc. on market position, key segments, and exposure to technological disruption:
AppLovin Corporation
- Large market cap of 194B, faces high competition in mobile app software marketing and monetization.
- Key segments include advertising software (3.2B) and apps (1.5B), driven by mobile app marketing and monetization.
- Platform-based solutions like AppDiscovery and MAX leverage real-time auctions, with moderate technological disruption risk.
PTC Inc.
- Smaller market cap of 20B, competes in software and services for digital transformation and product lifecycle management.
- Key segments are license sales (1.2B), support and cloud services (1.5B), and technology services (0.1B), focused on digital transformation.
- Offers innovative AR and SaaS platforms (ThingWorx, Vuforia, Onshape) with high exposure to digital and industrial technology disruption.
AppLovin Corporation vs PTC Inc. Positioning
AppLovin focuses on a concentrated business model centered on mobile app marketing and monetization, benefiting from high market cap but facing intense competition. PTC pursues diversified software product and service segments, balancing licenses and cloud services, enabling broader digital transformation solutions.
Which has the best competitive advantage?
Both companies exhibit a very favorable moat with growing ROIC above WACC, indicating durable competitive advantages. AppLovin’s higher ROIC growth suggests stronger value creation and capital efficiency compared to PTC’s moderate but stable advantage.
Stock Comparison
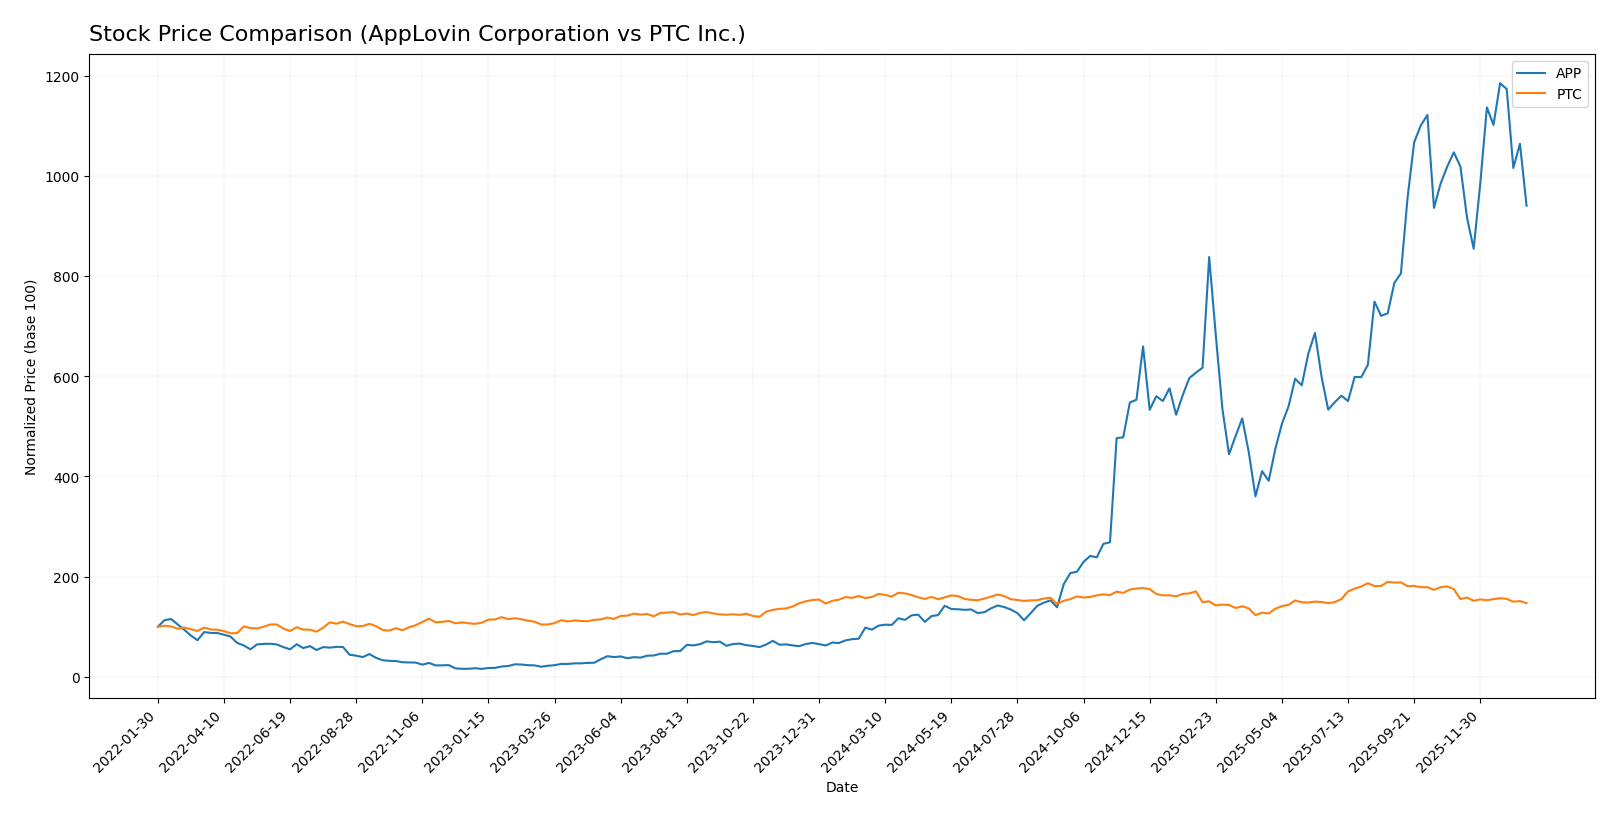
The past year has seen significant divergences in stock price movements between AppLovin Corporation and PTC Inc., with AppLovin exhibiting a strong upward momentum contrasted by PTC’s declining trajectory.
Trend Analysis
AppLovin Corporation’s stock showed a pronounced bullish trend over the past 12 months, with an 897.55% price increase despite a recent deceleration. The stock ranged between $57.39 and $721.37, reflecting high volatility with a standard deviation of 201.11.
PTC Inc.’s stock displayed a bearish trend over the same period, declining by 7.7%. The trend also decelerated, with prices fluctuating between $139.77 and $215.05 and a comparatively lower volatility at a standard deviation of 15.47.
Comparing the two, AppLovin delivered significantly higher market performance with a strong positive price change, whereas PTC experienced a negative return, indicating a clear divergence in investor outcomes.
Target Prices
The current analyst consensus indicates promising upside potential for both AppLovin Corporation and PTC Inc.
| Company | Target High | Target Low | Consensus |
|---|---|---|---|
| AppLovin Corporation | 860 | 630 | 756.33 |
| PTC Inc. | 255 | 120 | 213.25 |
Analysts expect AppLovin’s shares to rise significantly from the current 574.21 USD, indicating confidence in its growth. PTC’s target consensus at 213.25 USD also suggests notable appreciation potential relative to its current price of 166.89 USD.
Analyst Opinions Comparison
This section compares analysts’ ratings and grades for AppLovin Corporation (APP) and PTC Inc. (PTC):
Rating Comparison
APP Rating
- Rating: B, considered Very Favorable overall.
- Discounted Cash Flow Score: 3, Moderate valuation based on future cash flows.
- ROE Score: 5, Very Favorable, indicating strong profit generation from shareholders’ equity.
- ROA Score: 5, Very Favorable, reflecting excellent asset utilization.
- Debt To Equity Score: 1, Very Unfavorable, signaling higher financial risk due to leverage.
- Overall Score: 3, Moderate, implying an average financial standing.
PTC Rating
- Rating: B+, also considered Very Favorable overall.
- Discounted Cash Flow Score: 4, Favorable valuation suggesting better cash flow prospects.
- ROE Score: 4, Favorable, showing efficient profit generation but slightly below APP.
- ROA Score: 5, Very Favorable, indicating equally strong asset efficiency.
- Debt To Equity Score: 2, Moderate, indicating more balanced financial risk than APP.
- Overall Score: 3, Moderate, reflecting a similar overall financial position to APP.
Which one is the best rated?
Based on the provided data, PTC holds a slightly better rating with a B+ versus APP’s B. PTC scores higher on discounted cash flow and demonstrates lower financial risk, while APP excels in return on equity. Overall, both have moderate total scores.
Scores Comparison
The comparison of AppLovin Corporation and PTC Inc. scores is as follows:
APP Scores
- Altman Z-Score of 30.7, indicating a safe zone status.
- Piotroski Score of 7, classified as strong financial health.
PTC Scores
- Altman Z-Score of 5.67, also placing the company in a safe zone.
- Piotroski Score of 8, indicating very strong financial health.
Which company has the best scores?
PTC Inc. shows a lower but still safe Altman Z-Score and a higher Piotroski Score, indicating stronger financial health compared to AppLovin Corporation based strictly on these metrics.
Grades Comparison
Here is an overview of the recent grades assigned to AppLovin Corporation and PTC Inc.:
AppLovin Corporation Grades
The table below presents recent grades from credible financial institutions for AppLovin Corporation.
| Grading Company | Action | New Grade | Date |
|---|---|---|---|
| Morgan Stanley | Maintain | Overweight | 2026-01-13 |
| Wells Fargo | Maintain | Overweight | 2026-01-08 |
| Jefferies | Maintain | Buy | 2025-12-11 |
| Benchmark | Maintain | Buy | 2025-12-11 |
| Citigroup | Maintain | Buy | 2025-11-12 |
| Wells Fargo | Maintain | Overweight | 2025-11-07 |
| Goldman Sachs | Maintain | Neutral | 2025-11-07 |
| JP Morgan | Maintain | Neutral | 2025-11-06 |
| Wedbush | Maintain | Outperform | 2025-11-06 |
| Piper Sandler | Maintain | Overweight | 2025-11-06 |
AppLovin Corporation’s grades predominantly indicate a positive outlook, with multiple “Buy” and “Overweight” ratings sustained over several months.
PTC Inc. Grades
The table below shows recent grades from verified financial institutions for PTC Inc.
| Grading Company | Action | New Grade | Date |
|---|---|---|---|
| Piper Sandler | Maintain | Neutral | 2025-11-07 |
| Rosenblatt | Maintain | Buy | 2025-11-06 |
| Rosenblatt | Maintain | Buy | 2025-10-30 |
| Oppenheimer | Maintain | Outperform | 2025-07-31 |
| Rosenblatt | Maintain | Buy | 2025-07-31 |
| Barclays | Maintain | Overweight | 2025-07-31 |
| Stifel | Maintain | Buy | 2025-07-31 |
| Keybanc | Maintain | Overweight | 2025-07-31 |
| RBC Capital | Maintain | Outperform | 2025-07-31 |
| Piper Sandler | Maintain | Neutral | 2025-07-31 |
PTC Inc.’s grades mostly reflect a favorable consensus, with many “Buy,” “Overweight,” and “Outperform” ratings, though some “Neutral” ratings indicate some caution.
Which company has the best grades?
Both companies have a consensus “Buy” rating, but AppLovin Corporation exhibits a stronger concentration of recent “Buy” and “Overweight” grades, while PTC Inc. shows a mix including more “Neutral” ratings. This pattern could suggest slightly higher confidence from analysts in AppLovin’s near-term prospects, potentially influencing investor sentiment and portfolio decisions.
Strengths and Weaknesses
The table below compares key strengths and weaknesses of AppLovin Corporation (APP) and PTC Inc. (PTC) based on the most recent financial and operational data.
| Criterion | AppLovin Corporation (APP) | PTC Inc. (PTC) |
|---|---|---|
| Diversification | Focused mainly on Advertising and Apps segments; moderate diversification | More diversified across License, Technology Service, and Support & Cloud Services |
| Profitability | Very high net margin (33.55%) and ROIC (38.7%); strong value creator | Good profitability with net margin 26.8% and ROIC 14.43%; also creating value |
| Innovation | High fixed asset turnover (23.71) indicates efficient asset use; strong innovation in mobile advertising | Consistent investment in technology services and cloud support, supporting innovation |
| Global presence | Strong global footprint due to app ecosystem and advertising reach | Global presence in industrial and software markets with diverse service offerings |
| Market Share | Leading in mobile advertising and app monetization | Established player in industrial software with growing cloud services segment |
Key takeaways: AppLovin excels in profitability and asset efficiency, driven by a focused ad-tech model, but carries higher leverage risks. PTC offers better diversification and stable profitability with a strong emphasis on cloud and services, presenting a balanced risk profile for investors.
Risk Analysis
Below is a comparison of key risks for AppLovin Corporation (APP) and PTC Inc. (PTC) based on the most recent data available.
| Metric | AppLovin Corporation (APP) | PTC Inc. (PTC) |
|---|---|---|
| Market Risk | High beta (2.5) indicates high volatility and sensitivity to market swings | Moderate beta (1.01) indicates average market sensitivity |
| Debt level | High debt-to-equity (3.26) and debt-to-assets (60.6%) ratios indicate elevated leverage | Low debt-to-equity (0.36) and debt-to-assets (20.7%) ratios reflect strong balance sheet |
| Regulatory Risk | Moderate; operates in software marketing, facing data privacy regulations | Moderate; operates globally with compliance on software and services regulations |
| Operational Risk | Moderate; reliance on mobile app ecosystem and ad auction platforms | Moderate; complexity of software solutions and service delivery across regions |
| Environmental Risk | Low; technology sector with limited direct environmental impact | Low; primarily software, minimal environmental footprint |
| Geopolitical Risk | Moderate; international operations exposed to trade tensions and data laws | Moderate; global presence with exposure to geopolitical uncertainties |
Synthesis: AppLovin’s most impactful risks stem from its high market volatility and significant debt burden, increasing financial vulnerability despite strong profitability. PTC presents a more balanced risk profile with lower leverage and stable market sensitivity, though both face moderate regulatory and geopolitical risks due to their global software operations. Investors should weigh APP’s growth potential against its elevated financial risks.
Which Stock to Choose?
AppLovin Corporation (APP) shows a robust income evolution with a 224.53% revenue growth over 2020-2024 and a 33.55% net margin. Its financial ratios are slightly favorable overall, highlighted by a very high 144.96% ROE but challenged by high debt levels. Profitability is strong with a very favorable ROIC vs WACC moat rating, although debt-to-equity is unfavorable. The company holds a very favorable B rating, supported by strong returns but hampered by valuation metrics.
PTC Inc. (PTC) exhibits steady income growth with a 51.58% revenue increase over 2021-2025 and a 26.8% net margin. Its financial ratios are favorable overall, with solid profitability metrics including a 19.18% ROE and a very favorable moat rating reflecting efficient capital use. Debt levels are moderate and well-managed. PTC’s rating is also very favorable at B+, supported by balanced financial health and valuation scores.
For investors, APP could appear more attractive for those prioritizing rapid growth and high profitability, given its exceptional income evolution and very strong ROIC advantage despite higher debt. Conversely, PTC might appeal to investors seeking a more balanced financial profile with favorable ratios and moderate leverage. The choice might depend on whether one favors aggressive growth potential or steadier financial stability.
Disclaimer: Investment carries a risk of loss of initial capital. The past performance is not a reliable indicator of future results. Be sure to understand risks before making an investment decision.
Go Further
I encourage you to read the complete analyses of AppLovin Corporation and PTC Inc. to enhance your investment decisions: