AppLovin Corporation and Perfect Corp. both operate in the dynamic software application industry, with a strong focus on innovation to capture evolving market demands. While AppLovin excels in mobile app marketing and monetization platforms, Perfect Corp. pioneers AI-driven beauty and fashion tech solutions. This comparison highlights their strategic overlaps and unique strengths, guiding investors to identify the most compelling opportunity for their portfolio in 2026.
Table of contents
Companies Overview
I will begin the comparison between AppLovin Corporation and Perfect Corp. by providing an overview of these two companies and their main differences.
AppLovin Corporation Overview
AppLovin Corporation focuses on building a software platform that helps mobile app developers market and monetize their applications globally. Its solutions include AppDiscovery for marketing, Adjust for analytics, and MAX for in-app advertising optimization. Founded in 2011 and headquartered in Palo Alto, California, AppLovin operates in the software application industry with a significant market capitalization of $192B.
Perfect Corp. Overview
Perfect Corp. provides SaaS solutions leveraging artificial intelligence and augmented reality for the beauty and fashion industries. Its offerings include virtual try-on technologies and AI-powered analysis tools across multiple product lines. Established in 2015 and based in New Taipei City, Taiwan, Perfect Corp. operates within the software application sector with a market cap of $178M and a smaller workforce.
Key similarities and differences
Both companies operate in the software application industry and focus on innovative technology solutions, but their markets and scales differ significantly. AppLovin targets mobile app developers with marketing and monetization platforms on a global scale, while Perfect Corp. specializes in AI and AR solutions for beauty and fashion tech. Additionally, AppLovin’s market cap and employee count are substantially larger than Perfect Corp.’s, reflecting differences in market reach and operational scale.
Income Statement Comparison
The table below compares the key income statement metrics for AppLovin Corporation and Perfect Corp. for the fiscal year 2024.
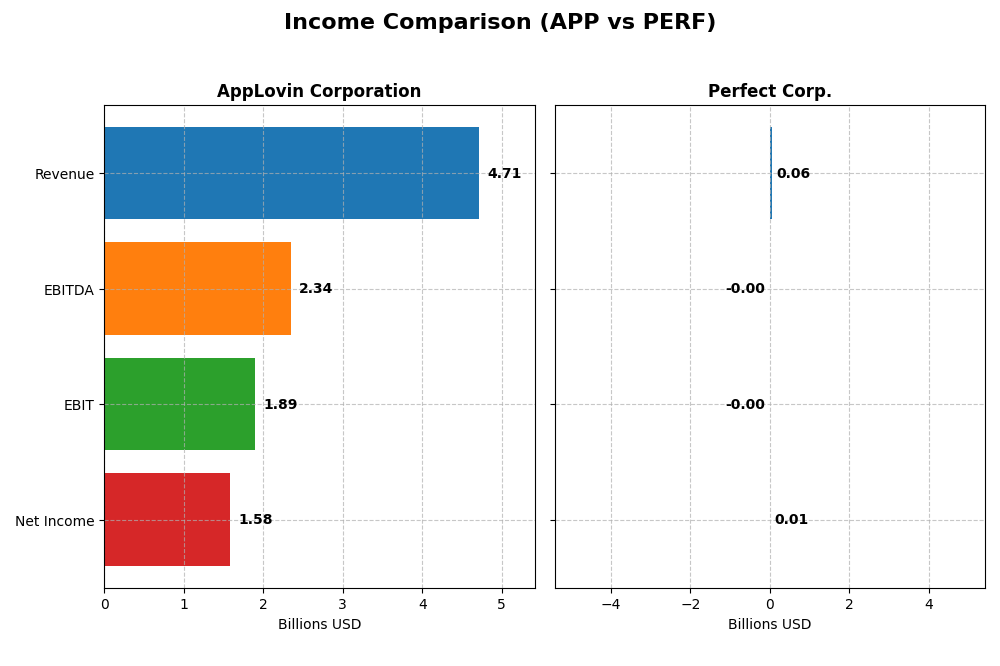
| Metric | AppLovin Corporation | Perfect Corp. |
|---|---|---|
| Market Cap | 192.3B | 178M |
| Revenue | 4.71B | 60.2M |
| EBITDA | 2.34B | -2.05M |
| EBIT | 1.89B | -2.84M |
| Net Income | 1.58B | 5.02M |
| EPS | 4.68 | 0.05 |
| Fiscal Year | 2024 | 2024 |
Income Statement Interpretations
AppLovin Corporation
AppLovin’s revenue surged from $1.45B in 2020 to $4.71B in 2024, with net income turning sharply positive from a loss of $125M to $1.58B. Margins improved significantly, with a strong gross margin of 75.22% and net margin reaching 33.55% in 2024. The latest year showed robust growth, with revenue up 43% and net income soaring over 200%, reflecting efficient cost control and expanding profitability.
Perfect Corp.
Perfect Corp.’s revenue rose steadily from $29.9M in 2020 to $60.2M in 2024, with net income recovering from a loss of $5.6M to a profit of $5M. Gross margin remains favorable at 77.98%, but EBIT margin is negative at -4.72%, indicating operating losses persist. In 2024, revenue growth was moderate at 12.5%, while net margin declined slightly, suggesting challenges in scaling profitability despite expanding sales.
Which one has the stronger fundamentals?
AppLovin demonstrates stronger fundamentals with high growth rates, expanding margins, and substantial profitability gains, reflected in its favorable EBIT and net margins. Perfect Corp. shows solid revenue growth and gross margin but struggles with profitability at the operating level. AppLovin’s robust income statement metrics and margin improvements outweigh Perfect’s slower margin progress and persistent operating losses.
Financial Ratios Comparison
The table below presents a side-by-side comparison of key financial ratios for AppLovin Corporation (APP) and Perfect Corp. (PERF) based on their most recent fiscal year, 2024.
| Ratios | AppLovin Corporation (APP) | Perfect Corp. (PERF) |
|---|---|---|
| ROE | 1.45 | 0.034 |
| ROIC | 0.39 | -0.021 |
| P/E | 69.06 | 56.6 |
| P/B | 100.11 | 1.93 |
| Current Ratio | 2.19 | 5.52 |
| Quick Ratio | 2.19 | 5.52 |
| D/E | 3.26 | 0.0035 |
| Debt-to-Assets | 0.61 | 0.0028 |
| Interest Coverage | 5.89 | -449 |
| Asset Turnover | 0.80 | 0.33 |
| Fixed Asset Turnover | 23.71 | 57.94 |
| Payout ratio | 0 | 0 |
| Dividend yield | 0 | 0 |
Interpretation of the Ratios
AppLovin Corporation
AppLovin shows a balanced ratio profile with 50% favorable and 42.86% unfavorable metrics. Strong points include a high return on equity (144.96%) and solid current and quick ratios (~2.19), indicating liquidity. However, concerns arise from a high debt-to-equity ratio (3.26) and elevated price-to-book (100.11). The company does not pay dividends, likely focusing on reinvestment or growth strategies.
Perfect Corp.
Perfect Corp. displays mixed financial ratios with 35.71% favorable and 50% unfavorable. The company benefits from a low debt-to-assets ratio (0.28) and quick ratio (5.52), but struggles with negative interest coverage and weak returns on invested capital (-2.1%). It also does not pay dividends, possibly prioritizing R&D and expansion over shareholder payouts.
Which one has the best ratios?
AppLovin’s ratios are generally stronger, particularly in profitability and liquidity, despite some leverage concerns. Perfect Corp.’s financials reveal more weaknesses, notably in profitability and interest coverage. Overall, AppLovin presents a slightly more favorable ratio profile compared to Perfect Corp., which faces more significant challenges.
Strategic Positioning
This section compares the strategic positioning of AppLovin Corporation and Perfect Corp., including market position, key segments, and exposure to technological disruption:
AppLovin Corporation
- Market leader in software platform for mobile app marketing with high market cap and strong competition.
- Key segments include advertising software and apps driving revenue through marketing and monetization.
- Uses advanced auction-based and analytics software, moderate exposure to disruption through evolving ad tech.
Perfect Corp.
- Smaller market cap, niche player in AI and AR beauty and fashion tech solutions with lower competitive pressure.
- Focused on SaaS AI and AR virtual try-on solutions in beauty and fashion, with multiple consumer apps.
- Heavily reliant on AI and AR innovation, facing ongoing technological changes in virtual try-on and beauty tech.
AppLovin Corporation vs Perfect Corp. Positioning
AppLovin has a diversified business model blending advertising and app platforms with broad market reach, while Perfect Corp. concentrates on AI/AR-driven beauty tech solutions. AppLovin’s scale supports competitive strength; Perfect Corp. targets specialized innovation but with narrower scope.
Which has the best competitive advantage?
AppLovin exhibits a very favorable moat with strong ROIC well above WACC and growing profitability, indicating durable competitive advantage. Perfect Corp. shows slightly unfavorable moat status, shedding value despite improving ROIC, suggesting weaker competitive advantage.
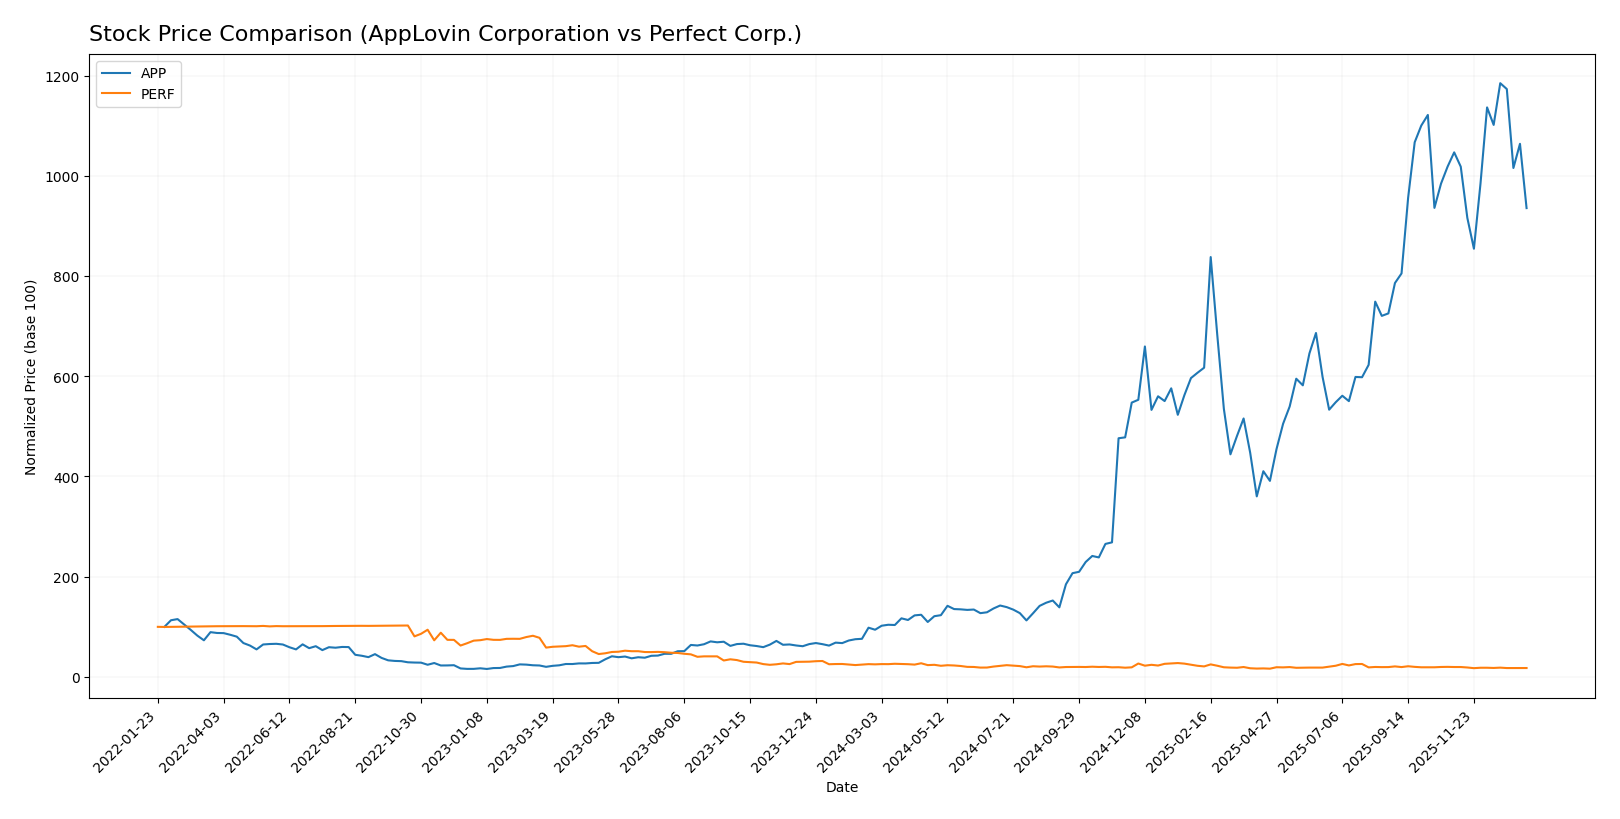
Stock Comparison
The stock price movements of AppLovin Corporation and Perfect Corp. over the past 12 months reveal contrasting trajectories, with AppLovin showing a strong overall gain despite recent weakness, while Perfect Corp. exhibits a consistent decline.
Trend Analysis
AppLovin Corporation’s stock price surged 892.51% over the past year, indicating a bullish trend with deceleration in momentum. The price ranged between 57.39 and 721.37, showing high volatility with a 201.07 standard deviation. Recent months saw a 10.63% decline, reflecting short-term weakness.
Perfect Corp.’s stock price fell 29.18% over the past year, marking a bearish trend with decelerating decline. The price fluctuated narrowly between 1.61 and 2.7, with very low volatility (0.27 std deviation). Recent trends continue downward with a 10.1% drop.
Comparing both stocks, AppLovin delivered the highest market performance with a substantial price increase, while Perfect Corp. experienced a significant loss over the same period.
Target Prices
Analysts present a clear consensus on the target prices for AppLovin Corporation and Perfect Corp.
| Company | Target High | Target Low | Consensus |
|---|---|---|---|
| AppLovin Corporation | 860 | 630 | 756.33 |
| Perfect Corp. | 7 | 7 | 7 |
The consensus target for AppLovin suggests a potential upside from the current price of $568.64, indicating positive analyst sentiment. Perfect Corp.’s target price of $7 is significantly above its current price of $1.74, reflecting expectations of substantial growth.
Analyst Opinions Comparison
This section compares analysts’ ratings and grades for AppLovin Corporation and Perfect Corp.:
Rating Comparison
AppLovin Corporation Rating
- Rating: B, assessed as Very Favorable overall.
- Discounted Cash Flow Score: 3, Moderate level.
- ROE Score: 5, Very Favorable, indicating strong profit generation from equity.
- ROA Score: 5, Very Favorable, showing effective asset utilization.
- Debt To Equity Score: 1, Very Unfavorable, signifying high financial risk.
- Overall Score: 3, Moderate overall financial standing.
Perfect Corp. Rating
- Rating: A-, assessed as Very Favorable overall.
- Discounted Cash Flow Score: 5, Very Favorable level.
- ROE Score: 2, Moderate, indicating less efficient equity profit generation.
- ROA Score: 3, Moderate, indicating average asset use efficiency.
- Debt To Equity Score: 4, Favorable, indicating lower financial risk.
- Overall Score: 4, Favorable overall financial standing.
Which one is the best rated?
Based strictly on the provided data, Perfect Corp. holds a higher overall score and rating (A-, 4) compared to AppLovin’s B rating and overall score of 3. Perfect Corp. shows stronger discounted cash flow and debt management scores, while AppLovin excels in ROE and ROA.
Scores Comparison
Here is a comparison of the Altman Z-Score and Piotroski Score for both companies:
APP Scores
- Altman Z-Score: 30.7, indicating a safe zone and very low bankruptcy risk.
- Piotroski Score: 7, reflecting strong financial health and value.
PERF Scores
- Altman Z-Score: 1.31, indicating distress zone with high bankruptcy risk.
- Piotroski Score: 6, reflecting average financial strength.
Which company has the best scores?
APP shows significantly better scores, with a very high Altman Z-Score in the safe zone and a strong Piotroski Score. PERF scores indicate financial distress and only average strength.
Grades Comparison
Here is the detailed grades comparison for AppLovin Corporation and Perfect Corp.:
AppLovin Corporation Grades
The following table shows recent grades and actions from reputable grading companies for AppLovin Corporation.
| Grading Company | Action | New Grade | Date |
|---|---|---|---|
| Morgan Stanley | Maintain | Overweight | 2026-01-13 |
| Wells Fargo | Maintain | Overweight | 2026-01-08 |
| Jefferies | Maintain | Buy | 2025-12-11 |
| Benchmark | Maintain | Buy | 2025-12-11 |
| Citigroup | Maintain | Buy | 2025-11-12 |
| Wells Fargo | Maintain | Overweight | 2025-11-07 |
| Goldman Sachs | Maintain | Neutral | 2025-11-07 |
| JP Morgan | Maintain | Neutral | 2025-11-06 |
| Wedbush | Maintain | Outperform | 2025-11-06 |
| Piper Sandler | Maintain | Overweight | 2025-11-06 |
AppLovin’s grades show a strong consensus around Buy and Overweight ratings, indicating positive analyst sentiment.
Perfect Corp. Grades
The following table summarizes the recent grades from verified grading firms for Perfect Corp.
| Grading Company | Action | New Grade | Date |
|---|---|---|---|
| Piper Sandler | Maintain | Neutral | 2024-02-29 |
| Goldman Sachs | Maintain | Neutral | 2023-10-26 |
| Piper Sandler | Maintain | Neutral | 2023-10-25 |
| Piper Sandler | Maintain | Neutral | 2023-07-26 |
| Piper Sandler | Maintain | Neutral | 2023-07-25 |
| Piper Sandler | Maintain | Neutral | 2023-04-27 |
| Oppenheimer | Downgrade | Perform | 2023-04-20 |
| Oppenheimer | Downgrade | Perform | 2023-04-19 |
| Oppenheimer | Downgrade | Perform | 2023-04-18 |
| Piper Sandler | Maintain | Neutral | 2023-03-08 |
Perfect Corp.’s grades consistently reflect a Neutral consensus with some recent downgrades, suggesting cautious analyst views.
Which company has the best grades?
AppLovin Corporation has received notably stronger grades, with multiple Buy and Overweight ratings compared to Perfect Corp.’s Neutral consensus and downgrades. This divergence may influence investor perception of growth and risk between the two.
Strengths and Weaknesses
Below is a comparison of key strengths and weaknesses of AppLovin Corporation (APP) and Perfect Corp. (PERF) based on their latest financial data and market positioning.
| Criterion | AppLovin Corporation (APP) | Perfect Corp. (PERF) |
|---|---|---|
| Diversification | Strong diversification with significant revenues from Advertising ($3.22B) and Apps ($1.49B) segments | Limited diversification, mainly focused on software solutions |
| Profitability | High profitability: ROIC 38.7%, Net Margin 33.55%, ROE 144.96% | Low profitability: ROIC -2.1%, Net Margin 8.34%, ROE 3.42% |
| Innovation | Very favorable innovation evidenced by strong ROIC growth (1173% increase) | Innovation improving with growing ROIC but still negative and value-destructive |
| Global presence | Established global presence with large scale advertising platform | Smaller global footprint, niche market focus |
| Market Share | Significant market share in mobile advertising and app monetization | Smaller market share, focused on beauty tech and AR software |
Key takeaways: AppLovin stands out with strong profitability, diversification, and a durable competitive advantage, making it a value creator. Perfect Corp. shows improving innovation but struggles with profitability and scale, indicating higher investment risk. Investors should weigh APP’s solid fundamentals against PERF’s growth potential but current value destruction.
Risk Analysis
The following table summarizes the key risks for AppLovin Corporation (APP) and Perfect Corp. (PERF) based on their latest 2024 financial and operational data:
| Metric | AppLovin Corporation (APP) | Perfect Corp. (PERF) |
|---|---|---|
| Market Risk | High beta (2.5) indicates significant volatility | Low beta (0.45), relatively stable |
| Debt Level | High debt-to-equity (3.26) and 60.6% debt/assets, unfavorable leverage | Very low debt (0.0 debt-to-equity), favorable leverage |
| Regulatory Risk | Moderate, US tech sector scrutiny | Moderate, operates in Taiwan with evolving AI regulations |
| Operational Risk | Moderate, relies on app developers and ad market dynamics | Moderate, dependent on AI/AR tech adoption and innovation |
| Environmental Risk | Low, software-focused with minimal direct environmental impact | Low, digital services with minimal environmental footprint |
| Geopolitical Risk | Moderate, US-based but with international exposure | Elevated, Taiwan-based amid regional tensions |
In synthesis, AppLovin faces considerable market volatility and high financial leverage, increasing risk in downturns despite strong profitability and liquidity. Perfect Corp. benefits from low debt and stable market risk but is in the distress zone per Altman Z-Score, reflecting financial vulnerability possibly linked to operational challenges and geopolitical exposure. Investors should weigh AppLovin’s aggressive growth profile against Perfect’s more conservative but risk-prone positioning, especially considering the evolving geopolitical landscape in Asia.
Which Stock to Choose?
AppLovin Corporation (APP) shows a strong income evolution with 224.53% revenue growth over five years, favorable profitability ratios including a 33.55% net margin and 144.96% ROE, though burdened by high debt levels with a 60.59% debt-to-assets ratio. Its rating is very favorable, supported by a durable competitive advantage and a very favorable moat status.
Perfect Corp. (PERF) presents moderate income growth of 101.53% over the same period, with mixed profitability—8.34% net margin but unfavorable ROIC and ROE. The company maintains low debt with a 0.28% debt-to-assets ratio, and its rating is very favorable, although its moat status is slightly unfavorable due to value destruction despite improving profitability.
Investors focused on growth and strong financial performance might find APP’s favorable income and robust moat appealing, while those prioritizing lower leverage and financial stability could view PERF as more suitable despite its lower profitability and slight value erosion.
Disclaimer: Investment carries a risk of loss of initial capital. The past performance is not a reliable indicator of future results. Be sure to understand risks before making an investment decision.
Go Further
I encourage you to read the complete analyses of AppLovin Corporation and Perfect Corp. to enhance your investment decisions: