Home > Comparison > Technology > APP vs PAYC
The strategic rivalry between AppLovin Corporation and Paycom Software, Inc. shapes the evolution of the technology sector. AppLovin operates as an innovative platform focused on mobile app marketing and monetization, while Paycom delivers comprehensive cloud-based human capital management solutions. This analysis pits AppLovin’s growth-driven model against Paycom’s stable SaaS approach to identify which trajectory offers superior risk-adjusted returns for a diversified portfolio in today’s dynamic market.
Table of contents
Companies Overview
AppLovin Corporation and Paycom Software, Inc. hold pivotal roles in the evolving software application market.
AppLovin Corporation: Mobile Marketing Innovator
AppLovin dominates the mobile app marketing space with a software platform that connects advertisers and publishers through real-time auctions. Its core revenue stems from AppDiscovery, Adjust analytics, and MAX in-app bidding. In 2026, AppLovin sharpens its focus on enhancing monetization efficiency for mobile developers worldwide, leveraging advanced data-driven solutions.
Paycom Software, Inc.: Cloud HCM Specialist
Paycom leads in cloud-based human capital management (HCM) solutions for U.S. small to mid-sized companies. It generates revenue by offering comprehensive SaaS applications covering recruitment, payroll, and workforce management. The company prioritizes expanding its analytics and automation capabilities to streamline the employment lifecycle and compliance processes in 2026.
Strategic Collision: Similarities & Divergences
Both firms thrive in application software but pursue contrasting strategies. AppLovin builds an open auction-driven ecosystem to maximize ad revenue, while Paycom emphasizes a closed, integrated SaaS platform for workforce management. They compete indirectly by targeting different client needs in tech-driven operational efficiency. AppLovin presents a high-beta growth profile; Paycom offers steadier, dividend-paying exposure in enterprise SaaS.
Income Statement Comparison
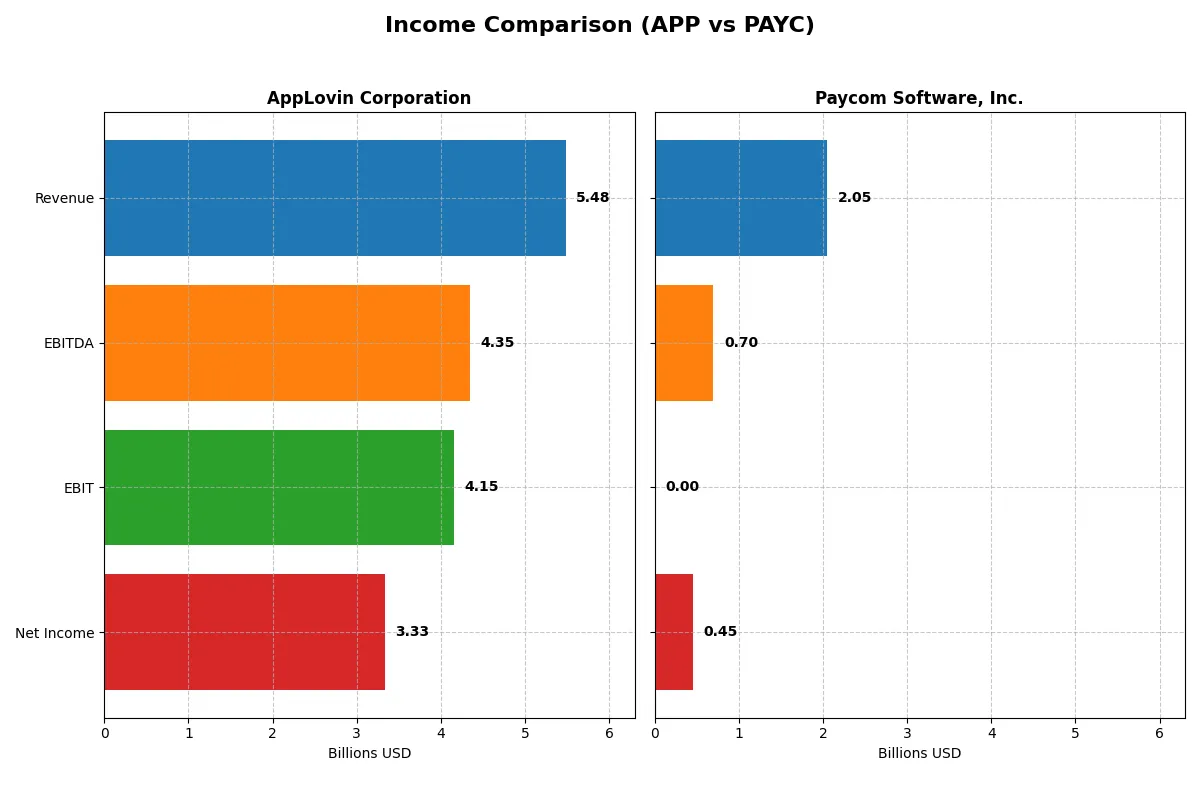
This data dissects the core profitability and scalability of both corporate engines to reveal who dominates the bottom line:
| Metric | AppLovin Corporation (APP) | Paycom Software, Inc. (PAYC) |
|---|---|---|
| Revenue | 5.48B | 2.05B |
| Cost of Revenue | 665M | 345M |
| Operating Expenses | 664M | 1.05B |
| Gross Profit | 4.82B | 1.71B |
| EBITDA | 4.35B | 698M |
| EBIT | 4.15B | 0 |
| Interest Expense | 207M | -3.4M |
| Net Income | 3.33B | 453M |
| EPS | 9.84 | 8.13 |
| Fiscal Year | 2025 | 2025 |
Income Statement Analysis: The Bottom-Line Duel
This income statement comparison reveals which company converts revenue into profit with greater efficiency and sustainable momentum.
AppLovin Corporation Analysis
AppLovin’s revenue nearly doubled from 2021 to 2025, reaching 5.48B in 2025 with net income surging from 32M to 3.33B. Its gross margin stands exceptionally high at 87.9%, and net margin at 60.8%, reflecting remarkable profitability. The latest year shows explosive EBIT growth of 119%, signaling robust operational leverage and margin expansion.
Paycom Software, Inc. Analysis
Paycom’s revenue rose steadily to 2.05B in 2025, nearly doubling over five years, while net income grew more modestly to 453M. The company maintains a healthy gross margin of 83.2% but reported a zero EBIT margin in 2025, indicating pressure on operating profitability. Recent declines in net margin and EPS growth suggest challenges in cost control and efficiency.
Margin Dominance vs. Revenue Consistency
AppLovin outperforms Paycom with superior margin health and explosive net income growth, translating revenue gains into profit more effectively. Paycom shows steady revenue growth but struggles to convert it into operating earnings consistently. For investors prioritizing margin expansion and bottom-line momentum, AppLovin presents a more compelling profile.
Financial Ratios Comparison
These vital ratios act as a diagnostic tool to expose the underlying fiscal health, valuation premiums, and capital efficiency of the companies compared below:
| Ratios | AppLovin Corporation (APP) | Paycom Software, Inc. (PAYC) |
|---|---|---|
| ROE | 156.17% | 0% |
| ROIC | 60.71% | 0% |
| P/E | 68.47 | 19.61 |
| P/B | 106.94 | 0 |
| Current Ratio | 3.32 | 0 |
| Quick Ratio | 3.32 | 0 |
| D/E | 1.66 | 0 |
| Debt-to-Assets | 48.83% | 0% |
| Interest Coverage | 20.06 | -166.82 |
| Asset Turnover | 0.75 | 0 |
| Fixed Asset Turnover | 37.06 | 0 |
| Payout ratio | 0% | 18.70% |
| Dividend yield | 0% | 0.95% |
| Fiscal Year | 2025 | 2025 |
Efficiency & Valuation Duel: The Vital Signs
Financial ratios act as a company’s DNA, revealing hidden risks and operational excellence behind headline numbers.
AppLovin Corporation
AppLovin dominates with an exceptional 156% ROE and a stellar 60.8% net margin, signaling outstanding profitability. However, the stock trades at a stretched 68.5 P/E and an inflated 107 P/B, reflecting high expectations. The company retains earnings without dividends, likely reinvesting aggressively in R&D to fuel growth.
Paycom Software, Inc.
Paycom posts a modest 22.1% net margin but reports zero ROE and ROIC, flagging operational issues or data gaps. The valuation is moderate at a 19.6 P/E, with a negligible dividend yield of 0.95%. Paycom’s low debt levels contrast with weaker liquidity and coverage metrics, hinting at financial caution or transitional challenges.
Premium Valuation vs. Operational Safety
AppLovin offers superior profitability and reinvestment discipline but faces a stretched valuation and debt concerns. Paycom shows a conservative balance sheet but suffers from profitability gaps and unfavorable ratio coverage. Investors seeking growth may prefer AppLovin’s profile; risk-averse investors might lean toward Paycom’s financial caution.
Which one offers the Superior Shareholder Reward?
AppLovin Corporation (APP) pays no dividends but generates strong free cash flow (11.7/share in 2025) and shows zero dividend payout. Its buyback program appears limited given zero dividend payout and no capital expenditure coverage ratio. Paycom Software, Inc. (PAYC) offers a modest dividend yield near 0.95% with a payout ratio around 18–19%, supported by solid free cash flow (7.3/share in 2025). PAYC combines dividends with consistent buybacks, enhancing shareholder returns sustainably. I find PAYC’s balanced distribution strategy, combining cash returns and reinvestment, superior for total return in 2026.
Comparative Score Analysis: The Strategic Profile
The radar chart reveals the fundamental DNA and trade-offs of AppLovin Corporation and Paycom Software, Inc.:
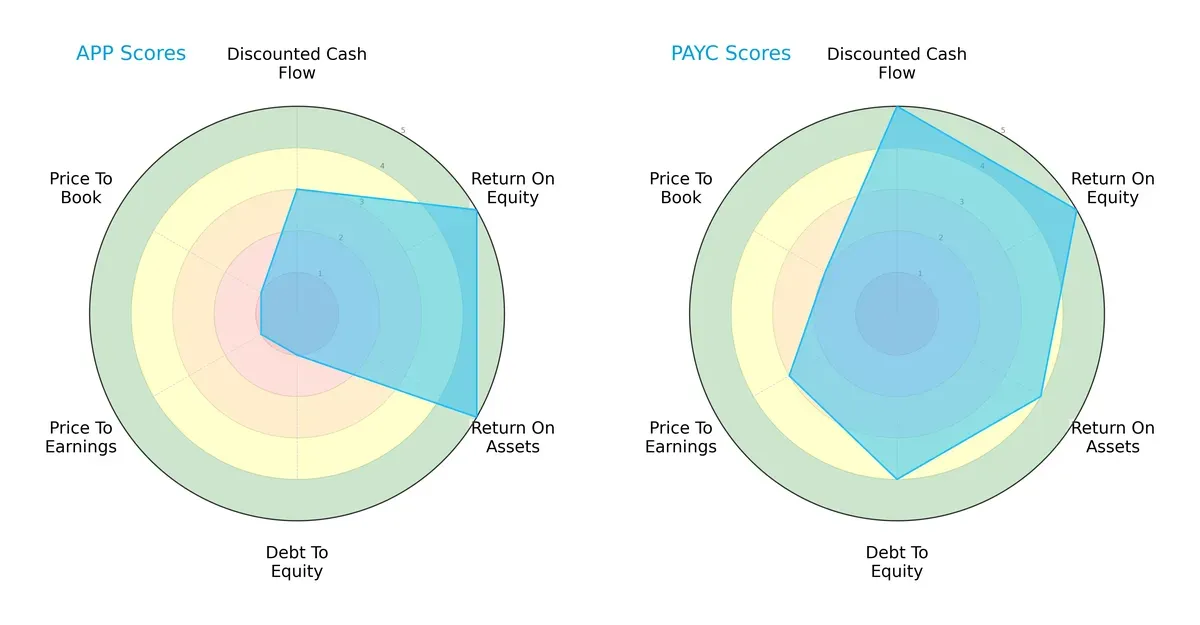
AppLovin shows strong profitability with top ROE and ROA scores but suffers from high financial risk, reflected in a poor debt-to-equity score and weak valuation metrics. Paycom displays a more balanced profile, excelling in discounted cash flow and maintaining healthier leverage, though its valuation remains moderately unfavorable. Paycom’s diversified strengths suggest greater stability, while AppLovin relies heavily on operational efficiency despite financial vulnerabilities.
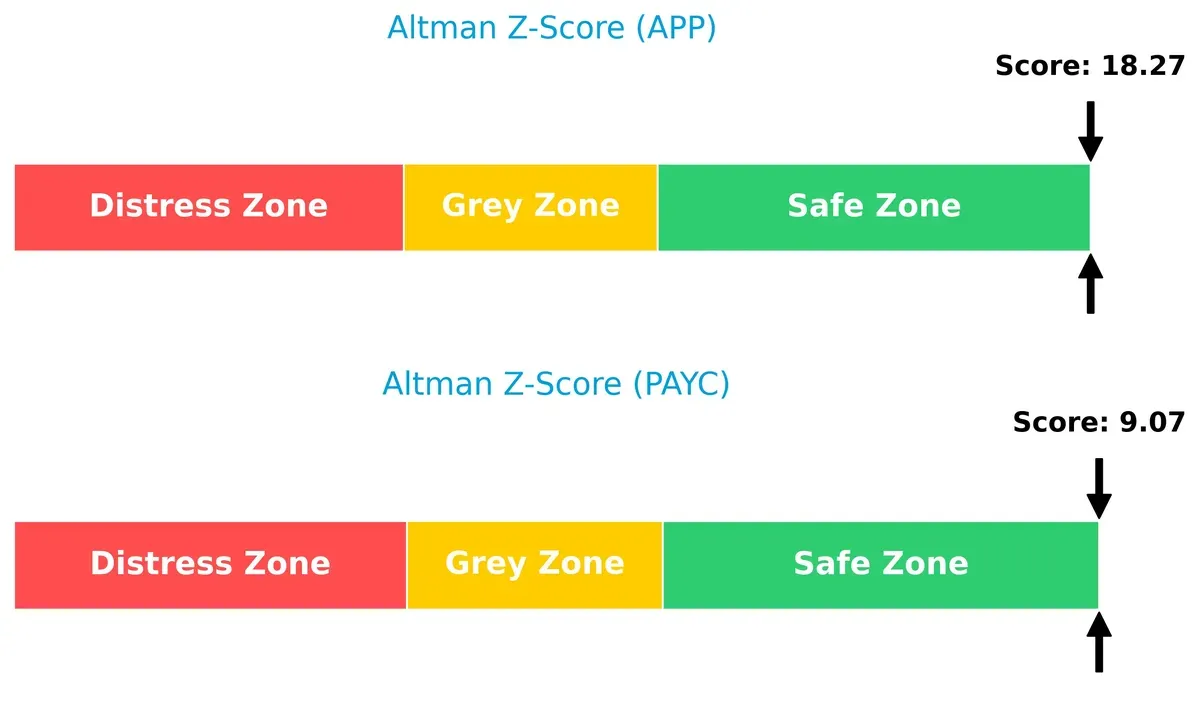
Bankruptcy Risk: Solvency Showdown
The Altman Z-Score gap signals both firms occupy a safe zone, but AppLovin’s extremely high score implies exceptional solvency compared to Paycom:
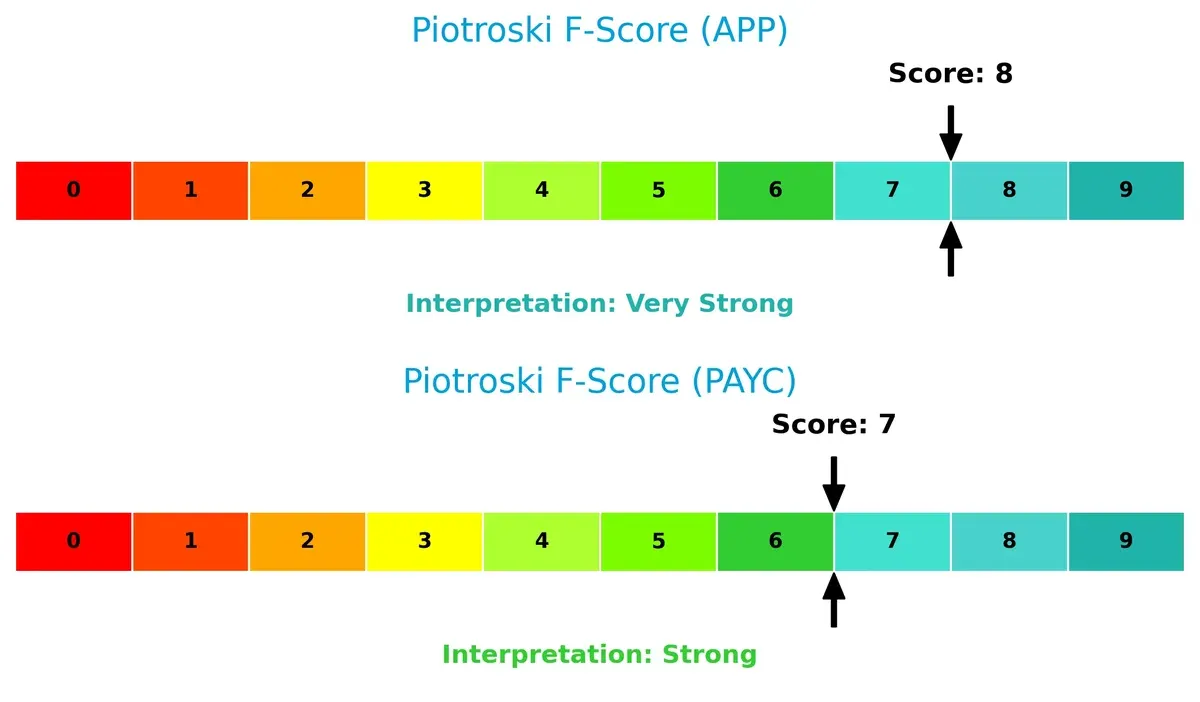
Financial Health: Quality of Operations
AppLovin’s Piotroski F-Score of 8 vs. Paycom’s 7 indicates marginally stronger internal financial health and fewer red flags:
How are the two companies positioned?
This section dissects the operational DNA of APP and PAYC by comparing revenue distribution and internal strengths and weaknesses. The goal is to confront their economic moats and identify which model offers the most resilient competitive advantage today.
Revenue Segmentation: The Strategic Mix
This visual comparison dissects how AppLovin Corporation and Paycom Software, Inc. diversify their income streams and where their primary sector bets lie:
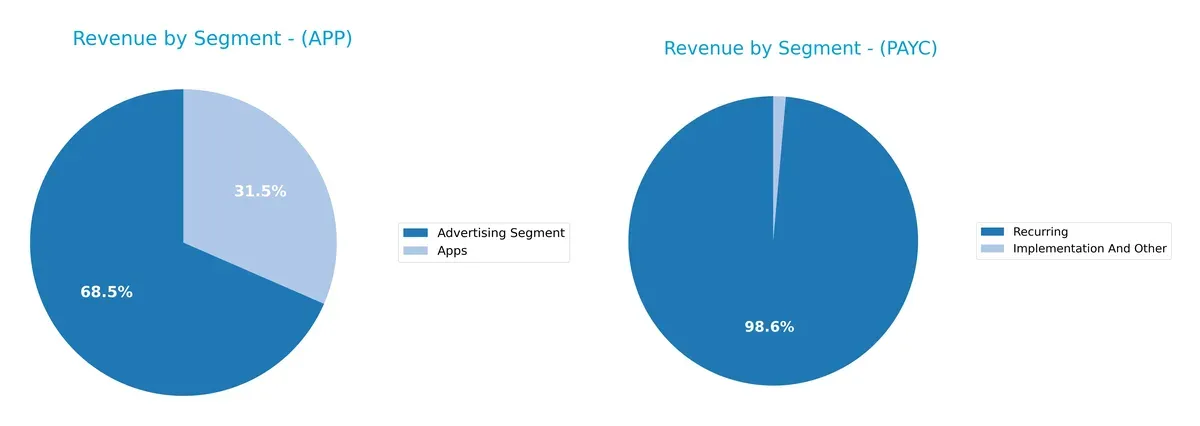
AppLovin leans on a more balanced revenue mix, with $3.2B from Advertising and $1.5B from Apps in 2024. Paycom pivots heavily on Recurring revenue, $1.73B, dwarfing its $24M Implementation segment. AppLovin’s dual segments suggest ecosystem lock-in via digital advertising and apps. Paycom’s concentration on Recurring revenue signals strong subscription dominance but raises concentration risk if client retention falters.
Strengths and Weaknesses Comparison
This table compares the strengths and weaknesses of AppLovin Corporation and Paycom Software, Inc.:
AppLovin Corporation Strengths
- Strong net margin at 60.83%
- High ROE of 156.17%
- ROIC far exceeds WACC at 60.71% vs 15.1%
- Quick ratio of 3.32 indicates good liquidity
- High interest coverage ratio at 20.06
- Diversified revenue streams across advertising and apps
- Significant global presence with large US and Rest Of World sales
Paycom Software Strengths
- Favorable net margin at 22.1%
- Low debt-to-equity and debt-to-assets ratios indicate low leverage
- Positive price-to-book ratio status
- Recurring revenue dominates at $1.73B in 2024, showing customer retention
- Consistent growth in recurring revenue segment
AppLovin Corporation Weaknesses
- Unfavorable WACC at 15.1%, above ROIC concern
- Elevated PE and PB ratios suggest overvaluation
- Current ratio flagged as unfavorable despite high quick ratio
- Debt-to-equity ratio at 1.66 is relatively high
- No dividend yield
- Asset turnover moderate at 0.75
Paycom Software Weaknesses
- Zero reported ROE and ROIC indicate poor capital efficiency
- Unavailable WACC complicates cost of capital analysis
- Unfavorable current and quick ratios suggest liquidity issues
- Negative interest coverage ratio
- Asset turnover at zero implies inefficiency
- Dividend yield low at 0.95%
AppLovin demonstrates strong profitability and global diversification but faces valuation and leverage risks. Paycom’s strength lies in recurring revenue and low leverage, balanced against weak profitability metrics and liquidity concerns. These contrasts highlight differing strategic and financial challenges for each company.
The Moat Duel: Analyzing Competitive Defensibility
A durable structural moat is the only shield protecting long-term profits from relentless competitive erosion:
AppLovin Corporation: Data-Driven Network Effects
AppLovin’s moat stems from powerful network effects linking advertisers and app developers. This drives stellar ROIC well above WACC, sustaining 87.9% gross margins and 60.8% net margins. Expansion into global markets in 2026 should deepen this advantage.
Paycom Software, Inc.: High Switching Costs in HCM
Paycom’s competitive edge relies on deep integration and switching costs in human capital management software. However, declining ROIC trends and margin pressures signal a weakening moat. Opportunities in product innovation and market penetration remain but face execution risks.
Network Effects vs. Switching Costs: Which Moat Holds Stronger?
AppLovin’s soaring, expanding ROIC and global reach create a wider, more sustainable moat than Paycom’s eroding switching-cost advantage. AppLovin is better positioned to defend and grow its market share in 2026.
Which stock offers better returns?
The past year shows stark divergence in price trends for AppLovin Corporation and Paycom Software, Inc., with AppLovin’s stock surging sharply before recent pullback, while Paycom experiences sustained decline.
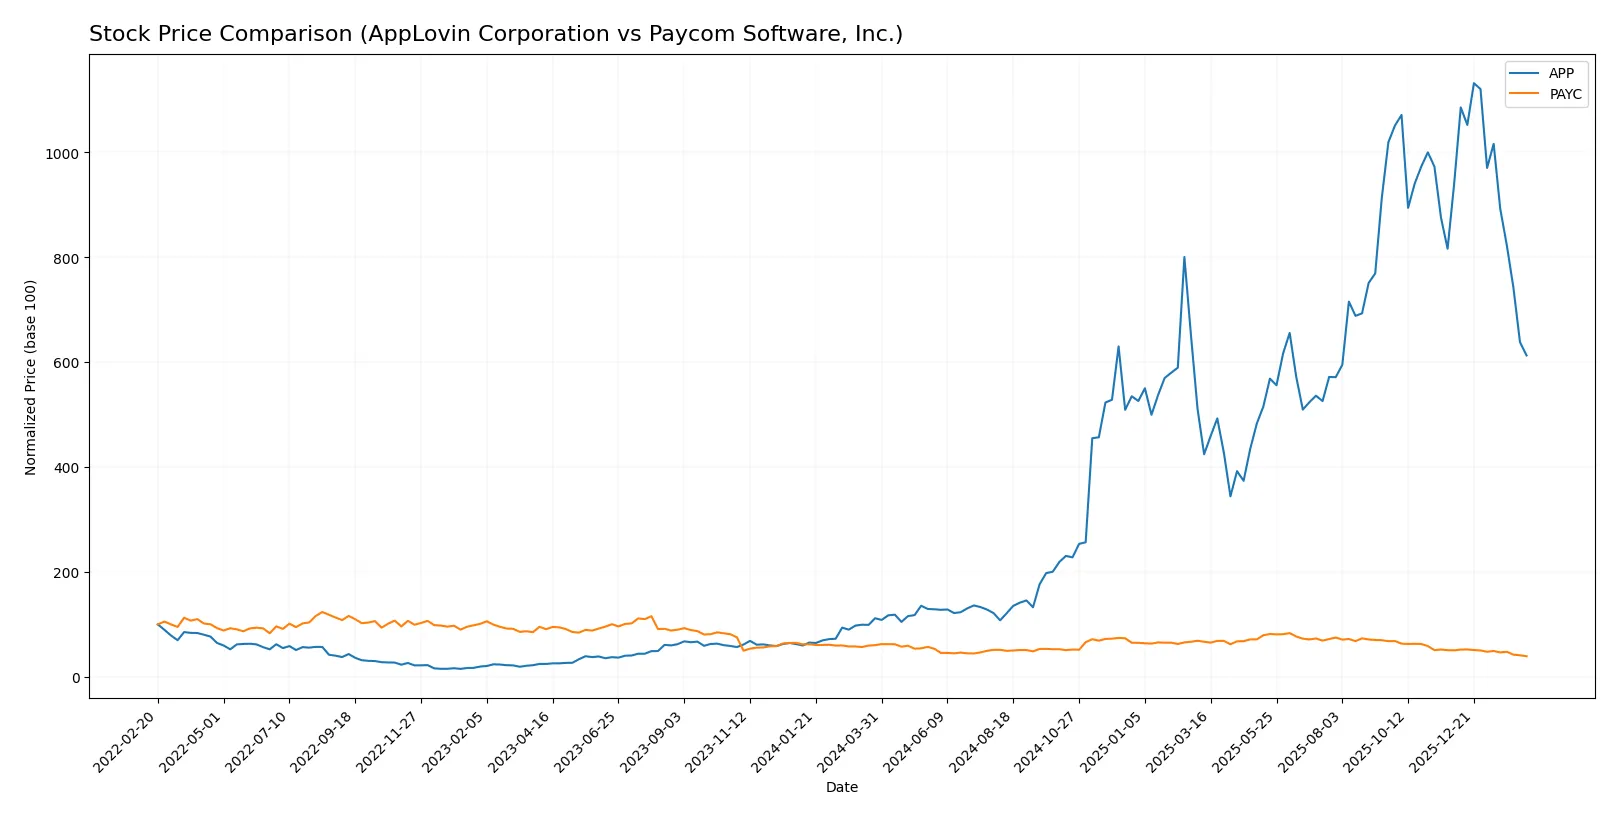
Trend Comparison
AppLovin’s stock rose 448.29% over the past 12 months, marking a strong bullish trend despite recent deceleration and a 34.85% dip from late 2025 to early 2026. Volatility remains high with a 196.68 standard deviation.
Paycom’s stock fell 34.89% over the same period, confirming a bearish trend with deceleration. Its recent 22.25% drop continues the decline, though with lower volatility at a 34.03 standard deviation.
AppLovin vastly outperformed Paycom in market returns over the past year, despite both stocks facing seller dominance and downward pressure in recent months.
Target Prices
Analysts present a bullish target consensus for AppLovin Corporation and a moderate outlook for Paycom Software, Inc.
| Company | Target Low | Target High | Consensus |
|---|---|---|---|
| AppLovin Corporation | 543 | 835 | 690.93 |
| Paycom Software, Inc. | 115 | 210 | 151.82 |
AppLovin’s consensus target of $690.93 far exceeds its current $390.55 price, signaling strong growth expectations. Paycom’s $151.82 target also surpasses its $125.31 price, reflecting moderate upside potential.

Don’t Let Luck Decide Your Entry Point
Optimize your entry points with our advanced ProRealTime indicators. You’ll get efficient buy signals with precise price targets for maximum performance. Start outperforming now!
How do institutions grade them?
AppLovin Corporation Grades
The following table shows recent ratings from reputable grading firms for AppLovin Corporation.
| Grading Company | Action | New Grade | Date |
|---|---|---|---|
| Wells Fargo | maintain | Overweight | 2026-02-12 |
| Citigroup | maintain | Buy | 2026-02-12 |
| RBC Capital | maintain | Outperform | 2026-02-12 |
| UBS | maintain | Buy | 2026-02-12 |
| Wedbush | maintain | Outperform | 2026-02-12 |
| Piper Sandler | maintain | Overweight | 2026-02-12 |
| Jefferies | maintain | Buy | 2026-02-12 |
| Scotiabank | maintain | Sector Outperform | 2026-02-12 |
| BTIG | maintain | Buy | 2026-02-12 |
| Goldman Sachs | maintain | Neutral | 2026-02-12 |
Paycom Software, Inc. Grades
The following table summarizes recent grades from established firms for Paycom Software, Inc.
| Grading Company | Action | New Grade | Date |
|---|---|---|---|
| Citigroup | maintain | Neutral | 2026-02-13 |
| BMO Capital | maintain | Market Perform | 2026-02-12 |
| Guggenheim | maintain | Buy | 2026-02-12 |
| Keybanc | maintain | Overweight | 2026-02-12 |
| Mizuho | maintain | Neutral | 2026-02-12 |
| BTIG | maintain | Buy | 2026-02-12 |
| Barclays | maintain | Equal Weight | 2026-02-12 |
| Jefferies | maintain | Hold | 2026-02-12 |
| Cantor Fitzgerald | maintain | Neutral | 2026-02-12 |
| Cantor Fitzgerald | maintain | Neutral | 2026-01-29 |
Which company has the best grades?
AppLovin Corporation consistently receives higher ratings, including multiple “Buy” and “Outperform” grades. Paycom’s grades skew toward “Neutral” and “Market Perform.” Investors might interpret AppLovin’s consensus as more bullish.
Risks specific to each company
The following categories identify critical pressure points and systemic threats facing both firms in the 2026 market environment:
1. Market & Competition
AppLovin Corporation
- Faces intense competition in mobile app marketing with rapid innovation cycles and high beta (2.49) indicating sensitivity to market swings.
Paycom Software, Inc.
- Operates in a mature HCM SaaS market with lower beta (0.79), indicating more stable stock but faces pressure from established and emerging players.
2. Capital Structure & Debt
AppLovin Corporation
- Leverage is high with debt-to-equity ratio at 1.66 and debt-to-assets near 49%, signaling elevated financial risk.
Paycom Software, Inc.
- Debt is negligible with zero reported debt-to-equity and debt-to-assets, implying strong balance sheet and lower financial risk.
3. Stock Volatility
AppLovin Corporation
- Exhibits high stock volatility with a wide trading range ($200.5–$745.61) and beta of 2.49, reflecting high market sensitivity.
Paycom Software, Inc.
- Demonstrates lower volatility with a narrower trading range ($104.9–$267.76) and beta of 0.79, offering steadier price movement.
4. Regulatory & Legal
AppLovin Corporation
- Exposure to data privacy regulations globally due to its analytics and ad targeting platforms; regulatory changes could impact operations.
Paycom Software, Inc.
- Faces compliance demands in U.S. labor and payroll laws; regulatory shifts can influence product compliance costs and liabilities.
5. Supply Chain & Operations
AppLovin Corporation
- Relies on cloud infrastructure and third-party ad exchanges; operational disruptions could affect service delivery and monetization.
Paycom Software, Inc.
- Depends on cloud service providers for SaaS delivery; operational resilience is critical to maintain service uptime for clients.
6. ESG & Climate Transition
AppLovin Corporation
- Limited direct ESG risk but increasing pressure to manage data privacy and energy consumption in cloud operations.
Paycom Software, Inc.
- Faces scrutiny on data security and employee welfare; sustainability practices could affect reputation and client trust.
7. Geopolitical Exposure
AppLovin Corporation
- International operations expose it to geopolitical risks including trade tensions and data localization laws.
Paycom Software, Inc.
- Primarily U.S.-focused, reducing direct geopolitical risk but sensitive to domestic political and regulatory changes.
Which company shows a better risk-adjusted profile?
AppLovin’s highest risk lies in market volatility and high leverage, which can amplify losses during downturns. Paycom’s greatest risk stems from operational and regulatory pressures in a competitive SaaS market. Paycom’s lower leverage, stable stock, and safer Altman Z-Score suggest a superior risk-adjusted profile. Notably, AppLovin’s extreme beta and debt levels justify caution despite strong profitability metrics.
Final Verdict: Which stock to choose?
AppLovin Corporation’s superpower lies in its remarkable ability to generate exceptional returns well above its cost of capital, signaling a robust and sustainable competitive edge. However, its high valuation multiples and leverage ratios warrant caution. APP suits investors with an appetite for aggressive growth and tolerance for volatility.
Paycom Software, Inc. protects its position through a strong recurring revenue moat and solid cash flow generation, offering a more stable investment profile than APP. Despite some operational headwinds, its conservative balance sheet fits well with investors favoring GARP (Growth at a Reasonable Price) strategies.
If you prioritize capital efficiency and breakthrough growth, APP outshines with its expanding profitability and value creation. However, if you seek steadier returns and financial stability in a competitive niche, PAYC offers better stability and a lower risk profile. Both appeal to distinct investor profiles, making the choice dependent on your risk tolerance and growth expectations.
Disclaimer: Investment carries a risk of loss of initial capital. The past performance is not a reliable indicator of future results. Be sure to understand risks before making an investment decision.
Go Further
I encourage you to read the complete analyses of AppLovin Corporation and Paycom Software, Inc. to enhance your investment decisions: