In today’s fast-evolving tech landscape, AppLovin Corporation and monday.com Ltd. stand out as dynamic players in the software application industry. AppLovin focuses on mobile app marketing and monetization, while monday.com offers a versatile cloud-based Work OS for diverse business needs. Their innovative approaches and overlapping markets make this comparison compelling. Join me as we analyze which company presents the most attractive opportunity for investors in 2026.
Table of contents
Companies Overview
I will begin the comparison between AppLovin and monday.com by providing an overview of these two companies and their main differences.
AppLovin Overview
AppLovin Corporation develops a software platform aimed at mobile app developers to improve app marketing and monetization globally. Its solutions include AppDiscovery for matching advertiser demand with publisher supply, Adjust for analytics and campaign optimization, and MAX for in-app bidding and inventory value optimization. Founded in 2011 and headquartered in Palo Alto, AppLovin operates primarily in the software application industry with a market cap of 193B USD.
monday.com Overview
monday.com Ltd. designs Work OS, a cloud-based visual work operating system with modular building blocks for software applications and work management. It serves various sectors including marketing, CRM, project management, and software development, targeting organizations and institutions worldwide. Incorporated in 2012 and based in Tel Aviv, monday.com competes in the software application industry and has a market cap of 6.5B USD.
Key similarities and differences
Both companies operate in the software application industry and provide cloud-based platforms designed to improve business efficiency through technology. AppLovin focuses on mobile app marketing and monetization solutions, whereas monday.com offers a broader work operating system for various organizational needs. Market capitalization differentiates them significantly, with AppLovin at 193B USD compared to monday.com’s 6.5B USD, reflecting scale and market reach disparities.
Income Statement Comparison
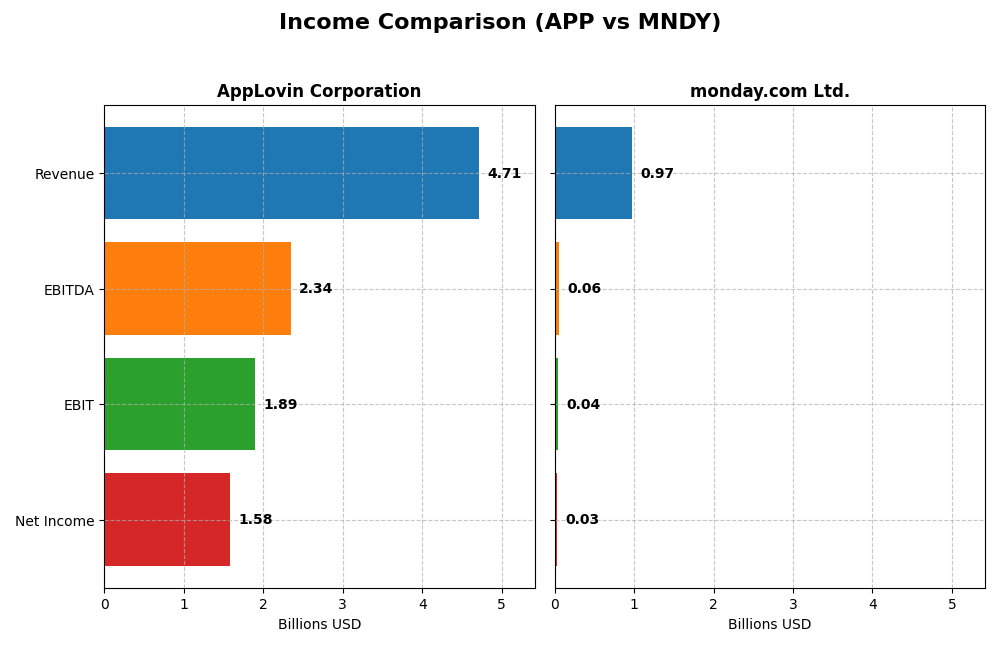
The table below compares the key income statement metrics for AppLovin Corporation and monday.com Ltd. for the fiscal year 2024.
| Metric | AppLovin Corporation | monday.com Ltd. |
|---|---|---|
| Market Cap | 193B | 6.5B |
| Revenue | 4.71B | 972M |
| EBITDA | 2.34B | 58M |
| EBIT | 1.89B | 40M |
| Net Income | 1.58B | 32M |
| EPS | 4.68 | 0.65 |
| Fiscal Year | 2024 | 2024 |
Income Statement Interpretations
AppLovin Corporation
AppLovin’s revenue grew from 1.45B in 2020 to 4.71B in 2024, with net income rising significantly from a loss of 125M to a profit of 1.58B. Margins improved markedly, with gross margin at 75.22% and net margin at 33.55% in 2024. The latest year showed robust growth in revenue (+43.44%) and net income (+208.75%), indicating a strong profitability improvement.
monday.com Ltd.
monday.com’s revenue increased from 161M in 2020 to 972M in 2024, with net income recovering from a 152M loss to a 32M profit. Gross margin was high at 89.33%, but net margin remained low at 3.33%. The 2024 fiscal year saw substantial growth in revenue (+33.21%) and net margin (+1394.74%), signaling a positive shift toward profitability despite modest net margins.
Which one has the stronger fundamentals?
AppLovin demonstrates stronger fundamentals with a much larger market cap and higher profitability margins, including a net margin above 30%. It also shows impressive growth in net income and earnings per share over the period. monday.com exhibits favorable revenue growth and gross margins but lower net margins and smaller profits, suggesting more modest fundamental strength compared to AppLovin.
Financial Ratios Comparison
The table below presents a side-by-side comparison of key financial ratios for AppLovin Corporation (APP) and monday.com Ltd. (MNDY) based on their most recent fiscal year data from 2024.
| Ratios | AppLovin Corporation (APP) | monday.com Ltd. (MNDY) |
|---|---|---|
| ROE | 1.45 | 0.03 |
| ROIC | 0.39 | -0.02 |
| P/E | 69.06 | 362.98 |
| P/B | 100.11 | 11.41 |
| Current Ratio | 2.19 | 2.66 |
| Quick Ratio | 2.19 | 2.66 |
| D/E (Debt-to-Equity) | 3.26 | 0.10 |
| Debt-to-Assets | 0.61 | 0.06 |
| Interest Coverage | 5.89 | 0 |
| Asset Turnover | 0.80 | 0.58 |
| Fixed Asset Turnover | 23.71 | 7.13 |
| Payout ratio | 0 | 0 |
| Dividend yield | 0 | 0 |
Interpretation of the Ratios
AppLovin Corporation
AppLovin shows strong profitability with a 33.55% net margin and exceptionally high returns on equity (144.96%) and invested capital (38.7%). However, its high debt-to-equity ratio (3.26) and debt-to-assets (60.59%) raise leverage concerns, alongside elevated valuation multiples (PE of 69.06, PB of 100.11). The company does not pay dividends, likely reinvesting earnings to support growth and R&D.
monday.com Ltd.
monday.com exhibits weaker profitability with a 3.33% net margin and low returns on equity (3.14%) and invested capital (-1.73%). Its leverage is conservative, with a debt-to-equity ratio of 0.1 and debt-to-assets at 6.29%. Valuation appears stretched with a PE of 362.98 and PB of 11.41. The company pays no dividends, probably prioritizing reinvestment and growth initiatives.
Which one has the best ratios?
AppLovin presents a more favorable profile with higher profitability and return ratios, despite concerns over leverage and valuation. monday.com maintains lower leverage but suffers from weaker profitability and extreme valuation multiples. Overall, AppLovin’s ratios suggest stronger operational efficiency, while monday.com shows a balanced but less profitable financial structure.
Strategic Positioning
This section compares the strategic positioning of AppLovin Corporation and monday.com Ltd., focusing on market position, key segments, and exposure to technological disruption:
AppLovin Corporation
- Large market cap of $193B, operating under high competitive pressure in software applications.
- Revenue driven by advertising segment ($3.2B) and apps ($1.5B), focusing on mobile app marketing and monetization.
- Uses real-time auctions and analytics to optimize app advertising, adapting to mobile technology changes.
monday.com Ltd.
- Smaller market cap of $6.5B, facing moderate competition in software applications.
- Offers Work OS cloud platform with modular work management tools for diverse industries.
- Provides cloud-based work operating system, focusing on software development and project management.
AppLovin Corporation vs monday.com Ltd. Positioning
AppLovin has a concentrated focus on mobile app marketing and monetization with significant advertising revenue. monday.com adopts a more diversified approach with a broad cloud-based work OS serving multiple sectors, balancing product and service offerings internationally.
Which has the best competitive advantage?
AppLovin demonstrates a very favorable moat with strong value creation and growing profitability, indicating a durable competitive advantage. monday.com shows slightly unfavorable moat status, shedding value despite improving profitability.
Stock Comparison
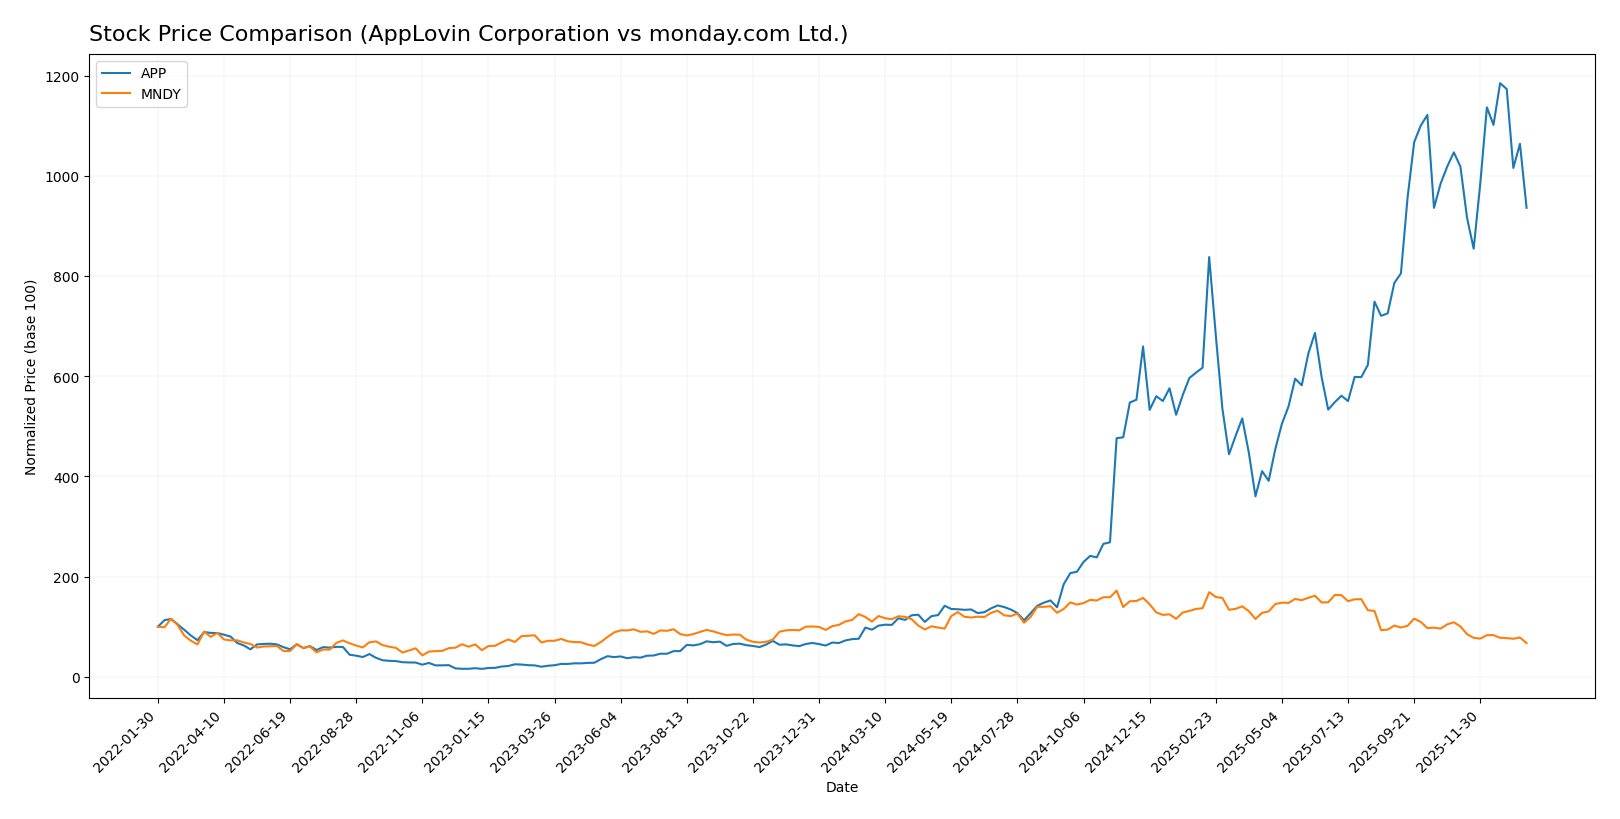
The past year has seen AppLovin Corporation’s stock exhibit a strong bullish trend with significant price appreciation, while monday.com Ltd. experienced a sustained bearish trend marked by declining prices and volume shifts.
Trend Analysis
AppLovin Corporation’s stock showed an overall bullish trend over the past 12 months with an 893.1% price increase, though momentum has decelerated. The price ranged from 57.39 to 721.37, with recent slight declines indicating short-term volatility.
monday.com Ltd. registered a bearish trend with a -38.86% price decline over the last year, accompanied by decelerating downward momentum. The stock traded between 127.1 and 324.31, with recent losses continuing the negative trajectory.
Comparatively, AppLovin Corporation delivered the highest market performance with substantial gains, while monday.com Ltd. faced significant price erosion, reflecting divergent investor sentiment and market dynamics.
Target Prices
The current consensus target prices for AppLovin Corporation and monday.com Ltd. reflect moderate to strong upside potential.
| Company | Target High | Target Low | Consensus |
|---|---|---|---|
| AppLovin Corporation | 860 | 630 | 756.33 |
| monday.com Ltd. | 330 | 194 | 264.42 |
Analysts expect AppLovin’s stock to rise significantly from its current 570 level, indicating bullish sentiment. monday.com’s consensus target similarly suggests potential gains from its present 127 price point.
Analyst Opinions Comparison
This section compares analysts’ ratings and grades for AppLovin Corporation and monday.com Ltd.:
Rating Comparison
APP Rating
- Rating: B, classified as Very Favorable overall rating by analysts.
- Discounted Cash Flow Score: Moderate score of 3 indicating average valuation assessment.
- ROE Score: Very Favorable high score of 5, showing strong profit generation from equity.
- ROA Score: Very Favorable high score of 5, reflecting excellent asset utilization.
- Debt To Equity Score: Very Unfavorable low score of 1, indicating higher financial risk.
- Overall Score: Moderate score of 3 reflecting an average overall financial standing.
MNDY Rating
- Rating: B-, also classified as Very Favorable overall rating by analysts.
- Discounted Cash Flow Score: Favorable score of 4 suggesting a better valuation outlook.
- ROE Score: Moderate score of 3 indicating average efficiency in generating profit from equity.
- ROA Score: Moderate score of 3 showing moderate asset utilization effectiveness.
- Debt To Equity Score: Moderate score of 3 suggesting a more balanced debt position.
- Overall Score: Moderate score of 3 reflecting a similar average overall financial standing.
Which one is the best rated?
Based solely on the provided data, APP holds higher scores in ROE and ROA, reflecting stronger profitability and asset use, but carries significantly higher financial risk due to its low debt-to-equity score. MNDY offers a better discounted cash flow score and a more moderate debt profile, resulting in both having a comparable overall score of 3.
Scores Comparison
Here is a comparison of the financial scores for AppLovin Corporation and monday.com Ltd.:
APP Scores
- Altman Z-Score: 30.7, indicating a safe zone and very low bankruptcy risk.
- Piotroski Score: 7, classified as strong financial health.
MNDY Scores
- Altman Z-Score: 6.3, indicating a safe zone and low bankruptcy risk.
- Piotroski Score: 5, classified as average financial health.
Which company has the best scores?
AppLovin shows a much higher Altman Z-Score and a stronger Piotroski Score compared to monday.com. Based strictly on these scores, AppLovin demonstrates stronger financial stability and health.
Grades Comparison
Here is a comparison of the latest available grades for AppLovin Corporation and monday.com Ltd.:
AppLovin Corporation Grades
The following table summarizes recent grades from major financial institutions for AppLovin Corporation:
| Grading Company | Action | New Grade | Date |
|---|---|---|---|
| Morgan Stanley | Maintain | Overweight | 2026-01-13 |
| Wells Fargo | Maintain | Overweight | 2026-01-08 |
| Jefferies | Maintain | Buy | 2025-12-11 |
| Benchmark | Maintain | Buy | 2025-12-11 |
| Citigroup | Maintain | Buy | 2025-11-12 |
| Wells Fargo | Maintain | Overweight | 2025-11-07 |
| Goldman Sachs | Maintain | Neutral | 2025-11-07 |
| JP Morgan | Maintain | Neutral | 2025-11-06 |
| Wedbush | Maintain | Outperform | 2025-11-06 |
| Piper Sandler | Maintain | Overweight | 2025-11-06 |
AppLovin Corporation’s grades consistently indicate buy or overweight positions, with a few neutral and outperform ratings, showing a predominantly positive outlook.
monday.com Ltd. Grades
The following table displays recent grades from reputable grading companies for monday.com Ltd.:
| Grading Company | Action | New Grade | Date |
|---|---|---|---|
| Barclays | Maintain | Overweight | 2026-01-12 |
| Jefferies | Maintain | Buy | 2026-01-05 |
| Citigroup | Maintain | Buy | 2025-12-23 |
| Tigress Financial | Maintain | Buy | 2025-12-11 |
| JP Morgan | Maintain | Overweight | 2025-11-11 |
| Morgan Stanley | Maintain | Overweight | 2025-11-11 |
| Piper Sandler | Maintain | Overweight | 2025-11-11 |
| Canaccord Genuity | Maintain | Buy | 2025-11-11 |
| Baird | Maintain | Outperform | 2025-11-11 |
| Citigroup | Maintain | Buy | 2025-11-11 |
monday.com Ltd. shows a strong consensus with predominantly buy and overweight grades, complemented by an outperform rating, indicating a favorable market view.
Which company has the best grades?
Both AppLovin Corporation and monday.com Ltd. have received predominantly positive grades, including buy and overweight ratings from multiple reputable firms. monday.com Ltd. has a slightly higher concentration of buy and overweight grades with a notable outperform rating, which may suggest a marginally stronger consensus. This could influence investor perception and portfolio positioning through increased confidence in growth potential.
Strengths and Weaknesses
The table below summarizes the key strengths and weaknesses of AppLovin Corporation (APP) and monday.com Ltd. (MNDY) based on their most recent financial and operational data.
| Criterion | AppLovin Corporation (APP) | monday.com Ltd. (MNDY) |
|---|---|---|
| Diversification | Strong, with significant revenues from Advertising (3.22B) and Apps (1.49B) segments | Limited product diversification, primarily software platform |
| Profitability | High net margin (33.55%), ROIC 38.7%, and ROE 144.96% | Low profitability, net margin 3.33%, ROIC negative -1.73%, ROE 3.14% |
| Innovation | Demonstrates durable competitive advantage with growing ROIC (23.25% above WACC) | Profitability is improving but still shedding value (ROIC below WACC) |
| Global presence | Established global footprint with strong financial ratios and asset turnover | Smaller scale with lower asset turnover (0.58) but good interest coverage |
| Market Share | Large market share in digital advertising and apps | Niche player in project management software, smaller market share |
Key takeaways: AppLovin shows robust profitability, strong diversification, and a durable competitive advantage, making it a value creator. monday.com is improving but remains less profitable and less diversified, indicating higher risk for investors.
Risk Analysis
Below is a comparative overview of key risks for AppLovin Corporation (APP) and monday.com Ltd. (MNDY) based on the latest 2024 data.
| Metric | AppLovin Corporation (APP) | monday.com Ltd. (MNDY) |
|---|---|---|
| Market Risk | High beta (2.50), volatile share price | Moderate beta (1.26), less volatile |
| Debt level | High debt-to-equity (3.26), 60.6% assets financed by debt | Low debt-to-equity (0.1), 6.3% assets financed by debt |
| Regulatory Risk | Moderate – US tech sector regulations | Moderate – International exposure with Israel HQ |
| Operational Risk | Medium – dependency on app developers and advertisers | Medium – reliance on SaaS adoption globally |
| Environmental Risk | Low – Software sector with limited direct impact | Low – SaaS company with minimal environmental footprint |
| Geopolitical Risk | Low – US-based, global clients | Moderate – HQ in Israel with exposure to geopolitical tensions |
AppLovin’s most significant risks stem from its high financial leverage and market volatility, increasing financial risk despite strong profitability. monday.com benefits from low debt but faces higher geopolitical risk due to its Israeli base. Both have moderate operational and regulatory risks given their tech industry context.
Which Stock to Choose?
AppLovin Corporation (APP) shows a strong income evolution with a 224.53% revenue growth over 2020-2024 and a 33.55% net margin. Its financial ratios are slightly favorable overall, driven by high returns on equity (144.96%) and invested capital (38.7%), despite elevated debt levels (60.59% debt to assets). APP’s profitability is robust, supported by very favorable ratings and a very favorable moat due to high ROIC exceeding WACC, indicating durable value creation.
monday.com Ltd. (MNDY) demonstrates favorable income growth with a 503.26% revenue increase over the period but maintains a low net margin of 3.33%. Its financial ratios are neutral overall, with favorable liquidity and low debt (6.29% debt to assets), but profitability metrics remain weak. MNDY holds a slightly unfavorable moat as ROIC is below WACC, implying value destruction despite improving profitability. Ratings are very favorable but with moderate scores on returns.
For investors, APP may appear more attractive for those prioritizing strong profitability and durable competitive advantage, while MNDY could be seen as suitable for risk-tolerant profiles valuing growth potential and financial stability. The higher rating and robust income and ratio evaluations of APP might signal quality investing appeal, whereas MNDY’s profile might align with growth-oriented strategies despite its current profitability challenges.
Disclaimer: Investment carries a risk of loss of initial capital. The past performance is not a reliable indicator of future results. Be sure to understand risks before making an investment decision.
Go Further
I encourage you to read the complete analyses of AppLovin Corporation and monday.com Ltd. to enhance your investment decisions: