Home > Comparison > Technology > APP vs MTCH
The strategic rivalry between AppLovin Corporation and Match Group, Inc. shapes the evolution of technology-driven software applications. AppLovin operates a platform-centric, data-driven marketing model, while Match Group specializes in consumer-facing dating services with a diversified brand portfolio. This analysis pits AppLovin’s scalable ad-tech approach against Match’s subscription-based growth, aiming to identify which business model offers superior risk-adjusted returns for a balanced portfolio in today’s dynamic tech sector.
Table of contents
Companies Overview
AppLovin Corporation and Match Group, Inc. both play pivotal roles in the digital technology landscape, shaping how users engage with mobile applications and online social platforms.
AppLovin Corporation: Mobile Marketing Powerhouse
AppLovin Corporation dominates the mobile app marketing sector with its software platform that enables developers to optimize app monetization and user acquisition. Its core revenue stems from tools like AppDiscovery, Adjust, and MAX, which drive advertising effectiveness through real-time auctions and analytics. In 2026, AppLovin sharpens its strategic focus on expanding cross-platform advertising solutions to capture global demand.
Match Group, Inc.: Leader in Online Dating Services
Match Group, Inc. commands the online dating industry with a diverse portfolio including Tinder, Match, and Hinge. It generates revenue primarily through subscription fees and advertising across its brands. In 2026, Match Group prioritizes product innovation and global market penetration to sustain user engagement and diversify its dating ecosystem.
Strategic Collision: Similarities & Divergences
Both companies thrive in software-driven markets but differ fundamentally: AppLovin builds an open advertising ecosystem, while Match Group maintains a closed, brand-centric user platform. Their competition centers on user attention—AppLovin through app monetization, Match Group via subscription growth. This contrast shapes distinct investment profiles: one bets on scalable ad tech, the other on sustained consumer loyalty.
Income Statement Comparison
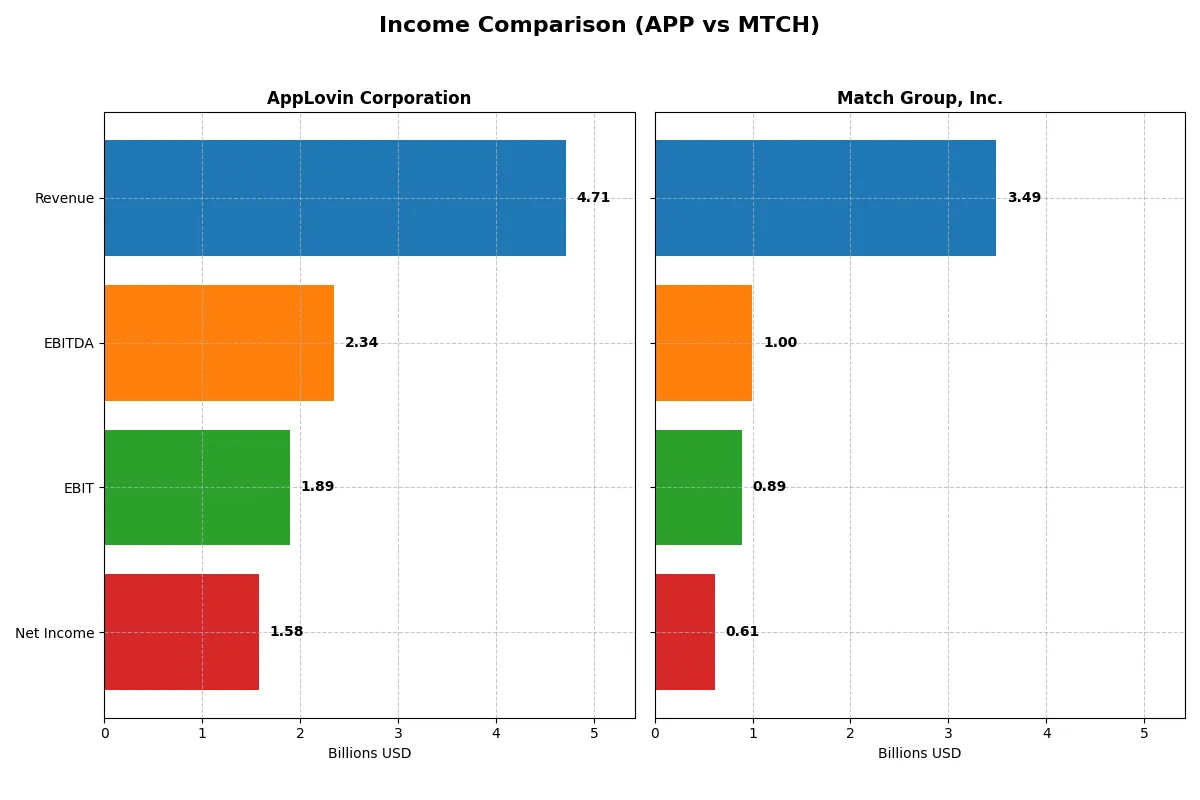
This data dissects the core profitability and scalability of both corporate engines to reveal who dominates the bottom line:
| Metric | AppLovin Corporation (APP) | Match Group, Inc. (MTCH) |
|---|---|---|
| Revenue | 4.71B | 3.49B |
| Cost of Revenue | 1.17B | 991M |
| Operating Expenses | 1.67B | 1.66B |
| Gross Profit | 3.54B | 2.49B |
| EBITDA | 2.34B | 952M |
| EBIT | 1.89B | 864M |
| Interest Expense | 318M | 160M |
| Net Income | 1.58B | 551M |
| EPS | 4.68 | 2.12 |
| Fiscal Year | 2024 | 2024 |
Income Statement Analysis: The Bottom-Line Duel
This income statement comparison reveals which company runs a more efficient and profitable business engine through recent financial performance.
AppLovin Corporation Analysis
AppLovin’s revenue surged from 3.3B in 2023 to 4.7B in 2024, with net income skyrocketing from 357M to 1.58B. Its gross margin stands strong at 75.2%, and net margin impresses at 33.5%. The company’s EBIT margin of 40.2% signals robust operational efficiency and accelerating momentum in profitability.
Match Group, Inc. Analysis
Match Group’s revenue remained nearly flat, inching up 0.2% from 3.48B in 2024 to 3.49B in 2025. Net income rose moderately from 551M to 613M, supporting a healthy but lower net margin of 17.6%. Gross margin at 72.8% and EBIT margin at 25.6% reflect solid profitability with slower growth compared to AppLovin.
Verdict: High-Growth Profitability vs. Steady Margin Strength
AppLovin outpaces Match Group with explosive revenue and net income growth, alongside superior margins that highlight operational leverage. Match Group delivers consistent but modest gains, maintaining stable margins with limited top-line expansion. For investors, AppLovin’s profile offers higher growth and margin expansion potential, while Match Group presents steadier earnings with less volatility.
Financial Ratios Comparison
These vital ratios act as a diagnostic tool to expose the underlying fiscal health, valuation premiums, and capital efficiency of the companies compared below:
| Ratios | AppLovin Corporation (APP) | Match Group, Inc. (MTCH) |
|---|---|---|
| ROE | 1.45 | -2.42 |
| ROIC | 0.39 | 0.23 |
| P/E | 69.06 | 12.77 |
| P/B | 100.11 | -30.91 |
| Current Ratio | 2.19 | 1.42 |
| Quick Ratio | 2.19 | 1.42 |
| D/E (Debt-to-Equity) | 3.26 | -15.67 |
| Debt-to-Assets | 0.61 | 0.89 |
| Interest Coverage | 5.89 | 5.91 |
| Asset Turnover | 0.80 | 0.78 |
| Fixed Asset Turnover | 23.71 | 26.59 |
| Payout ratio | 0 | 0.30 |
| Dividend yield | 0 | 2.38% |
| Fiscal Year | 2024 | 2025 |
Efficiency & Valuation Duel: The Vital Signs
Ratios act as a company’s DNA, revealing hidden risks and operational excellence that raw numbers alone cannot show.
AppLovin Corporation
AppLovin dominates with an outstanding ROE of 145% and a robust net margin of 33.55%, signaling exceptional profitability. Yet, its P/E of 69 and P/B of 100 reveal a stretched valuation, demanding caution. The company retains earnings, investing heavily in R&D (13.56% of revenue), prioritizing long-term growth over dividends.
Match Group, Inc.
Match Group posts a solid net margin of 17.59% and a ROIC of 22.5%, demonstrating efficient capital use. Its P/E of 12.77 and favorable P/B contrast with AppLovin’s high multiples, reflecting a more reasonable valuation. The 2.38% dividend yield offers direct shareholder returns, balancing growth with income distribution.
Premium Valuation vs. Balanced Efficiency
AppLovin’s stellar profitability comes at a steep price and elevated debt, increasing risk. Match Group offers a more balanced profile with moderate profitability, attractive valuation, and consistent dividends. Growth-oriented investors may favor AppLovin’s aggressive reinvestment, while income-focused investors might prefer Match’s steady returns.
Which one offers the Superior Shareholder Reward?
AppLovin Corporation (APP) does not pay dividends and focuses on reinvesting nearly all its free cash flow (6.2/share in 2024) into growth, boasting a robust free cash flow margin near 50%. Match Group, Inc. (MTCH) pays a modest 2.4% dividend yield with a 30% payout ratio, balancing dividends with significant buybacks and maintaining solid free cash flow (4.2/share in 2025). APP heavily leverages growth reinvestment with no shareholder cash return, while MTCH provides immediate income plus buybacks supporting total return. Considering sustainability, MTCH’s balanced model offers a more attractive total return profile in 2026 by combining income and capital return without over-leveraging, unlike APP’s aggressive growth approach that risks increased debt. I favor MTCH for superior shareholder reward this year.
Comparative Score Analysis: The Strategic Profile
The radar chart reveals the fundamental DNA and trade-offs of AppLovin Corporation and Match Group, Inc., highlighting their strategic strengths and vulnerabilities:
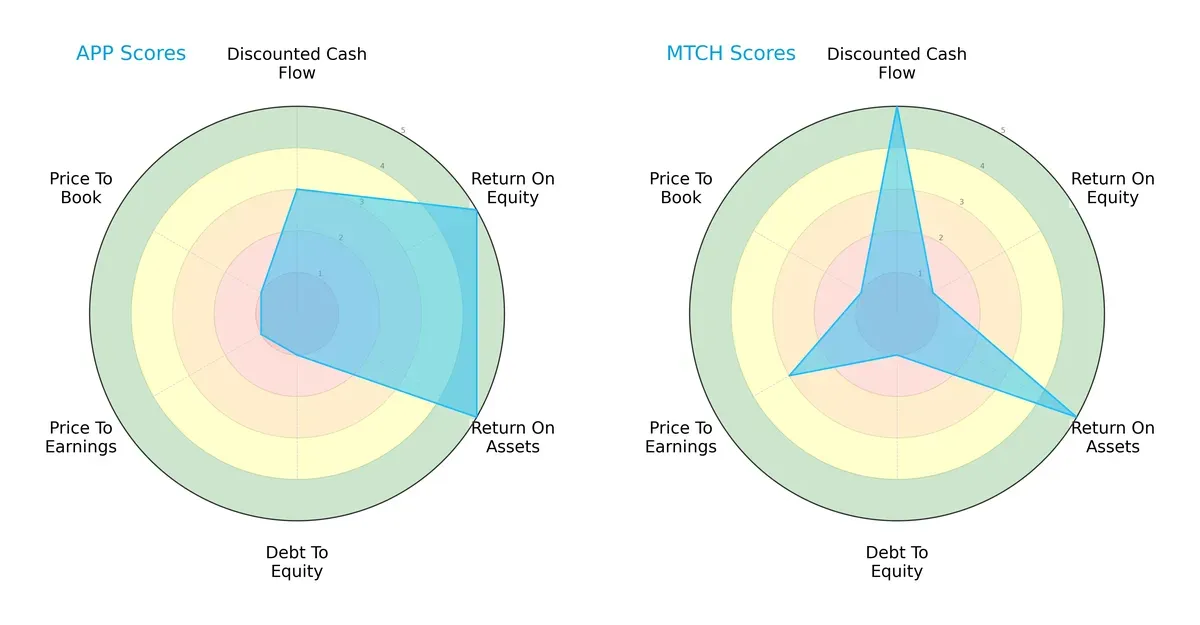
AppLovin exhibits strong operational efficiency with high ROE and ROA scores (5 each), but struggles with valuation and leverage, scoring very low in debt-to-equity, P/E, and P/B metrics (all 1). Match Group shines in discounted cash flow (5) and ROA (5) but lags in ROE (1) and shares AppLovin’s weak leverage profile. Overall, Match Group’s profile appears more balanced due to better valuation metrics, while AppLovin relies heavily on operational efficiency as its key edge.
Bankruptcy Risk: Solvency Showdown
The Altman Z-Score difference signals diverging solvency outlooks between the two firms:
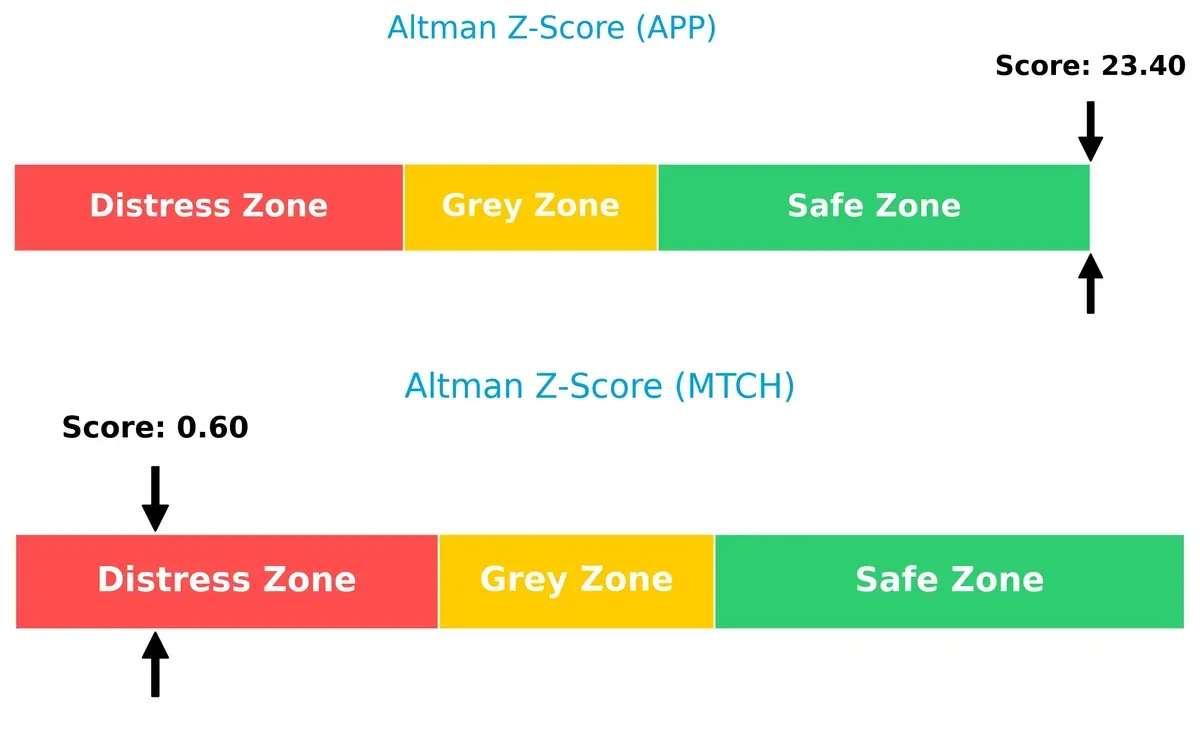
AppLovin’s robust Z-score of 23.4 places it securely in the safe zone, indicating exceptional financial stability and low bankruptcy risk. Match Group’s alarmingly low score of 0.6 falls into the distress zone, signaling high vulnerability and potential insolvency risks in this volatile cycle.
Financial Health: Quality of Operations
Piotroski F-Scores illuminate the internal financial health and operational quality of both companies:
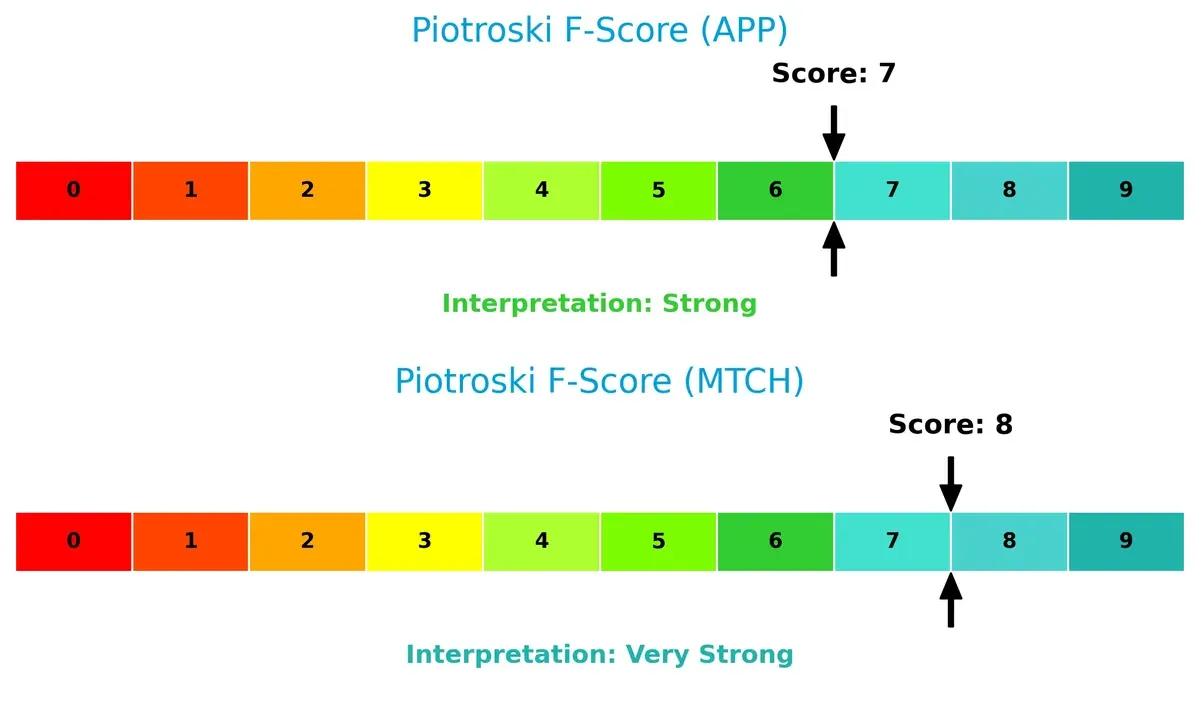
Match Group leads slightly with a very strong score of 8, demonstrating superior profitability, liquidity, and operational efficiency. AppLovin’s strong 7 score also reflects solid fundamentals but suggests marginally higher internal risks. Neither shows red flags, but Match Group’s internal metrics are more robust for long-term resilience.
How are the two companies positioned?
This section dissects the operational DNA of APP and MTCH by comparing their revenue distribution by segment and internal dynamics. The goal is to confront their economic moats to identify which model offers the most resilient competitive advantage today.
Revenue Segmentation: The Strategic Mix
This comparison dissects how AppLovin Corporation and Match Group, Inc. diversify their income streams and reveals their primary sector bets:
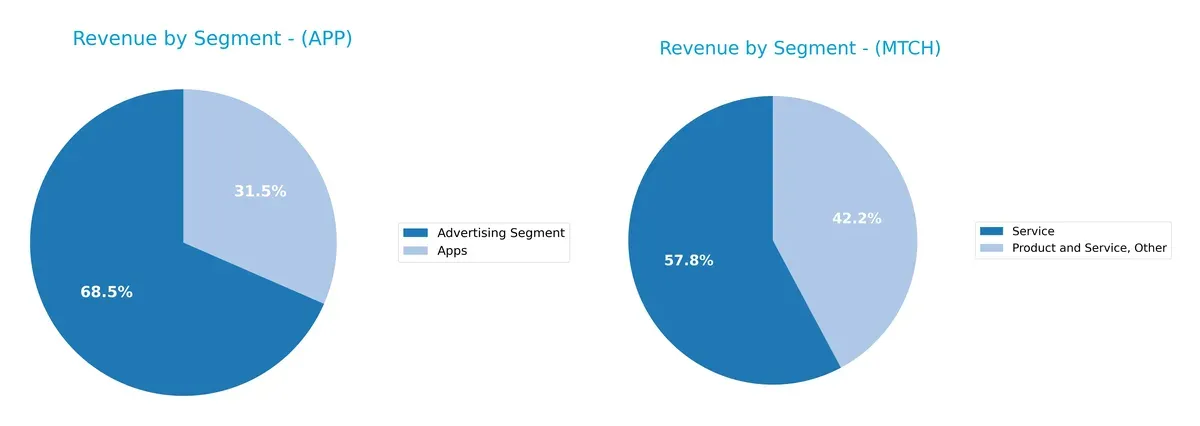
AppLovin leans heavily on its Advertising Segment, which dwarfs its Apps revenue at $3.2B versus $1.5B in 2024, signaling strong ecosystem lock-in via ad monetization. Match Group shows more dispersion but still pivots around its Dating segment, historically dominant. AppLovin’s concentrated ad revenue drives infrastructure dominance, while Match’s varied segments suggest exposure to concentration risk amid shifting consumer trends.
Strengths and Weaknesses Comparison
This table compares the Strengths and Weaknesses of AppLovin Corporation and Match Group, Inc.:
AppLovin Corporation Strengths
- High net margin at 33.55%
- ROE of 144.96% indicates strong profitability
- ROIC of 38.7% exceeds WACC
- Strong current and quick ratios at 2.19
- Global revenue balance between US and Rest of World
- Significant advertising segment revenue of 3.22B
Match Group, Inc. Strengths
- Favorable net margin at 17.59%
- ROIC of 22.5% is solid
- Low WACC at 7.83% supports capital efficiency
- Favorable P/E and P/B ratios indicate market undervaluation
- Positive dividend yield of 2.38%
- Diversified global revenue with strong Non-US sales of 1.89B
AppLovin Corporation Weaknesses
- High debt-to-equity ratio at 3.26 signals financial leverage risk
- Debt to assets at 60.6% is elevated
- P/E of 69.06 and P/B of 100.11 are very high valuations
- WACC at 15.39% is unfavorable
- Zero dividend yield limits income appeal
Match Group, Inc. Weaknesses
- Negative ROE at -241.99% shows poor equity returns
- High debt-to-assets ratio of 89.1% increases financial risk
- Current ratio at 1.42 is only neutral
- Negative debt-to-equity ratio requires scrutiny
- Less diversified revenue with heavy US dependence at 1.59B
Overall, AppLovin demonstrates strong profitability and liquidity but carries significant leverage and valuation risks. Match Group shows better capital cost management and market valuation but suffers from negative equity returns and high financial leverage. Both companies face distinct risks that impact their strategic financial positioning.
The Moat Duel: Analyzing Competitive Defensibility
A structural moat shields long-term profits from competition’s relentless erosion. Without it, profitability fades quickly:
AppLovin Corporation: Data-Driven Platform Moat
AppLovin’s moat stems from its advanced software platform integrating app marketing and monetization. This drives high ROIC of 23%, stable 75%+ gross margins, and explosive net margin growth in 2024. Expansion into global markets should deepen its advantage, but tech disruption remains a risk.
Match Group, Inc.: Brand Portfolio & Network Effects
Match Group leverages a portfolio of popular dating apps, creating strong network effects unlike AppLovin’s tech-centric moat. Its ROIC of 14.7% and 72.8% gross margin reflect solid but slower growth. Future gains depend on innovating user engagement amid rising competition.
Platform Efficiency vs. Network Effect Resilience
AppLovin’s wider moat benefits from superior capital returns and rapid growth. Match Group’s moat is narrower but fortified by brand loyalty. AppLovin is better positioned to defend market share through tech scalability and margin expansion.
Which stock offers better returns?
The past year shows AppLovin Corporation surging with strong gains despite recent pullbacks, while Match Group, Inc. faces a steady downtrend with moderate price declines.
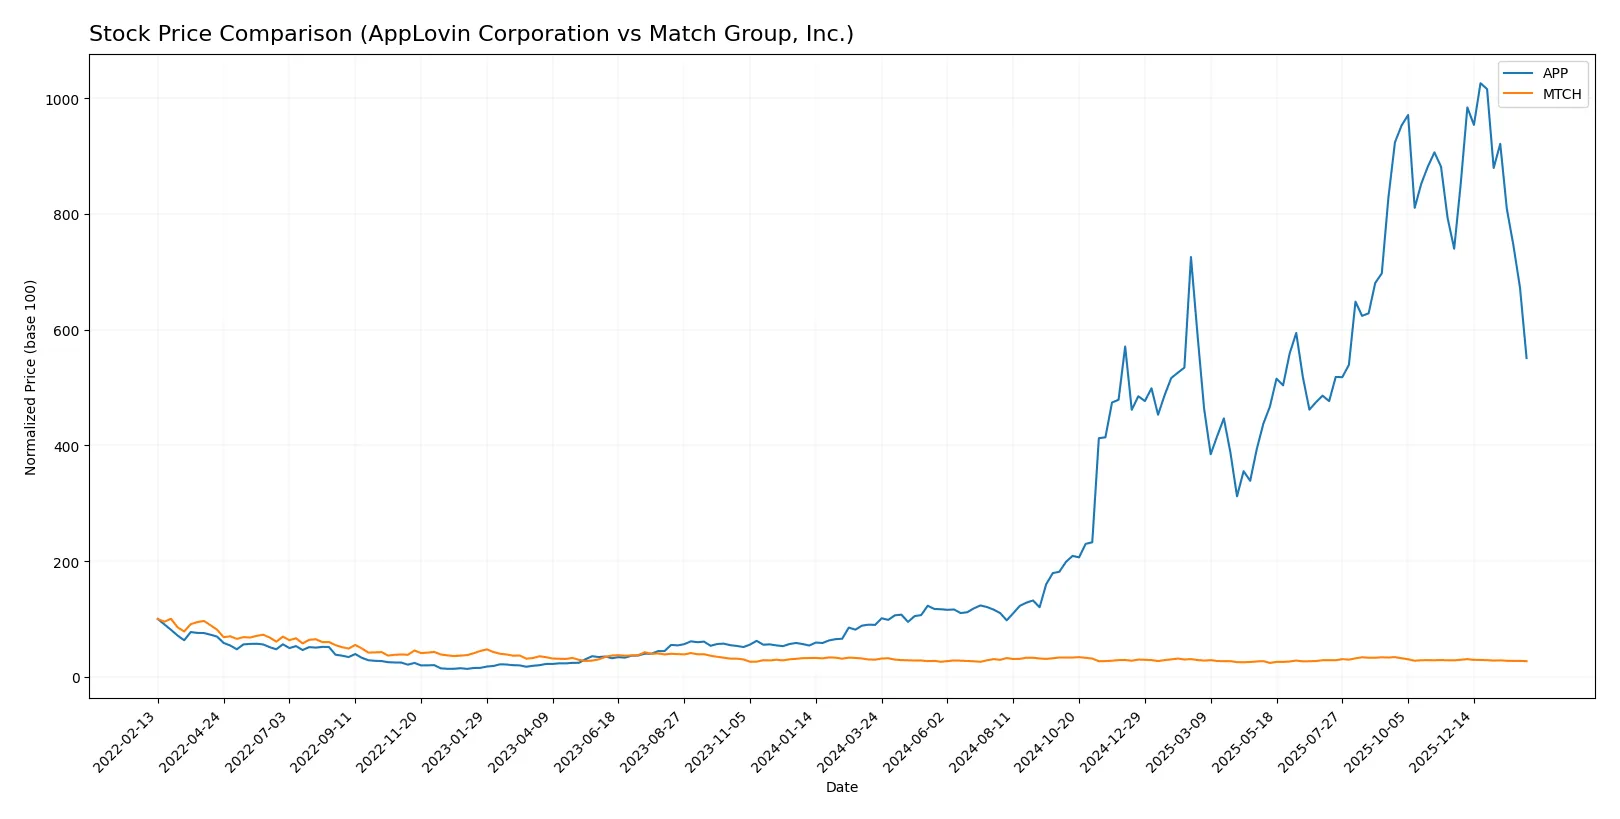
Trend Comparison
AppLovin’s stock rose 513.56% over 12 months, marking a bullish trend with decelerating momentum. It peaked at 721.37 and bottomed at 63.13, showing high volatility (std dev 198.17).
Match Group’s stock fell 8.76% over 12 months, reflecting a bearish trend with decelerating losses. It traded between 27.18 and 38.51, with low volatility (std dev 2.62).
AppLovin outperformed Match Group markedly, delivering the highest market returns despite recent downward pressure on its price trend.
Target Prices
Analysts present a clear target consensus for AppLovin Corporation and Match Group, Inc., suggesting notable upside potential.
| Company | Target Low | Target High | Consensus |
|---|---|---|---|
| AppLovin Corporation | 630 | 860 | 755.85 |
| Match Group, Inc. | 33 | 43 | 36 |
AppLovin’s consensus target at 755.85 far exceeds the current 387.34 price, implying strong growth expectations. Match Group’s target consensus of 36 also suggests moderate upside from its present 30.61 level.

Don’t Let Luck Decide Your Entry Point
Optimize your entry points with our advanced ProRealTime indicators. You’ll get efficient buy signals with precise price targets for maximum performance. Start outperforming now!
How do institutions grade them?
The following tables summarize recent institutional grades for AppLovin Corporation and Match Group, Inc.:
AppLovin Corporation Grades
This table lists recent grades from major financial institutions for AppLovin Corporation.
| Grading Company | Action | New Grade | Date |
|---|---|---|---|
| Needham | Upgrade | Buy | 2026-01-26 |
| Morgan Stanley | Maintain | Overweight | 2026-01-13 |
| Wells Fargo | Maintain | Overweight | 2026-01-08 |
| Benchmark | Maintain | Buy | 2025-12-11 |
| Jefferies | Maintain | Buy | 2025-12-11 |
| Citigroup | Maintain | Buy | 2025-11-12 |
| Wells Fargo | Maintain | Overweight | 2025-11-07 |
| Goldman Sachs | Maintain | Neutral | 2025-11-07 |
| BTIG | Maintain | Buy | 2025-11-06 |
| Benchmark | Maintain | Buy | 2025-11-06 |
Match Group, Inc. Grades
This table shows recent grades from reputable firms for Match Group, Inc.
| Grading Company | Action | New Grade | Date |
|---|---|---|---|
| Truist Securities | Maintain | Hold | 2026-02-04 |
| JP Morgan | Maintain | Neutral | 2026-02-04 |
| Morgan Stanley | Maintain | Equal Weight | 2026-01-13 |
| Truist Securities | Maintain | Hold | 2025-11-05 |
| Evercore ISI Group | Maintain | In Line | 2025-11-05 |
| Wells Fargo | Maintain | Equal Weight | 2025-11-05 |
| Morgan Stanley | Maintain | Equal Weight | 2025-10-20 |
| Susquehanna | Maintain | Positive | 2025-08-07 |
| JP Morgan | Maintain | Neutral | 2025-08-06 |
| Evercore ISI Group | Maintain | In Line | 2025-08-06 |
Which company has the best grades?
AppLovin Corporation consistently receives stronger ratings, including multiple Buy and Overweight grades. Match Group’s evaluations mostly cluster around Hold, Neutral, and Equal Weight. This suggests AppLovin holds a more favorable institutional outlook, which may influence investor confidence and portfolio positioning.
Risks specific to each company
The following categories identify the critical pressure points and systemic threats facing both AppLovin Corporation and Match Group, Inc. in the 2026 market environment:
1. Market & Competition
AppLovin Corporation
- Faces intense competition in mobile marketing and app monetization; innovation pace pressure is high.
Match Group, Inc.
- Operates in a crowded dating app market with strong brand portfolios but facing saturation risks.
2. Capital Structure & Debt
AppLovin Corporation
- High debt levels with debt-to-assets at 60.6% and D/E of 3.26 signal financial leverage risk.
Match Group, Inc.
- Debt-to-assets very high at 89.1%, but negative D/E ratio suggests complex capital structure requiring scrutiny.
3. Stock Volatility
AppLovin Corporation
- Beta of 2.49 indicates significant volatility, exposing shareholders to market swings.
Match Group, Inc.
- Beta of 1.32 shows moderate volatility, more stable relative to AppLovin’s stock.
4. Regulatory & Legal
AppLovin Corporation
- Data privacy regulations could impact app analytics and ad targeting capabilities.
Match Group, Inc.
- Faces regulatory scrutiny on data use and content policies across multiple jurisdictions.
5. Supply Chain & Operations
AppLovin Corporation
- Relies on software platform stability and ad auction integrity; tech disruptions pose risk.
Match Group, Inc.
- Operational risk centers on platform uptime and user data security across global brands.
6. ESG & Climate Transition
AppLovin Corporation
- Limited direct ESG impact but must address data privacy and ethical advertising concerns.
Match Group, Inc.
- Needs to manage social responsibility given its influence on user wellbeing and data ethics.
7. Geopolitical Exposure
AppLovin Corporation
- Global app market exposure creates sensitivity to international regulatory and trade tensions.
Match Group, Inc.
- Extensive international presence subjects it to geopolitical risks and regulatory fragmentation.
Which company shows a better risk-adjusted profile?
AppLovin’s most impactful risk is its heavy financial leverage, which threatens stability despite strong profitability. Match Group’s largest concern is its distressed financial position indicated by a very low Altman Z-Score, despite operational strengths. I see Match Group’s risk-adjusted profile as weaker due to bankruptcy risk, even though it scores better on profitability metrics. AppLovin’s elevated stock volatility and debt are worrisome but manageable with its strong cash flow and market position. The recent 16% share price drop in AppLovin reflects market sensitivity to leverage risks, underscoring my caution.
Final Verdict: Which stock to choose?
AppLovin Corporation’s superpower lies in its remarkable ability to generate high returns on invested capital, signaling efficient capital allocation and strong value creation. Its point of vigilance is the elevated debt levels, which could pressure financial flexibility. This stock aligns well with aggressive growth portfolios that tolerate debt risks for outsized gains.
Match Group, Inc. benefits from a robust strategic moat built on recurring revenue and solid market positioning in the digital dating space. Compared to AppLovin, it offers a safer financial profile with lower valuation multiples and healthier liquidity, fitting portfolios focused on growth at a reasonable price (GARP) with moderate risk appetite.
If you prioritize aggressive growth and value creation driven by operational efficiency, AppLovin outshines due to its superior ROIC and growth trajectory. However, if you seek stability with a durable revenue model and more conservative valuation, Match Group offers better stability and a compelling moat. Both represent distinct investor profiles with different risk-reward trade-offs.
Disclaimer: Investment carries a risk of loss of initial capital. The past performance is not a reliable indicator of future results. Be sure to understand risks before making an investment decision.
Go Further
I encourage you to read the complete analyses of AppLovin Corporation and Match Group, Inc. to enhance your investment decisions: