AppLovin Corporation and Intuit Inc. are two influential players in the software application industry, each driving innovation in distinct yet overlapping markets. AppLovin focuses on mobile app marketing and monetization platforms, while Intuit specializes in financial management and compliance software for businesses and consumers. Comparing these leaders reveals valuable insights into their growth strategies and market positioning. Join me as we explore which company offers the most compelling opportunity for your investment portfolio.
Table of contents
Companies Overview
I will begin the comparison between AppLovin Corporation and Intuit Inc. by providing an overview of these two companies and their main differences.
AppLovin Overview
AppLovin Corporation develops a software platform aimed at mobile app developers to enhance app marketing and monetization globally. Its suite includes AppDiscovery for marketing, Adjust for analytics, and MAX for in-app bidding, serving advertisers, publishers, and internet platforms. Headquartered in Palo Alto, CA, AppLovin operates in the software application industry with about 1,533 employees.
Intuit Overview
Intuit Inc. delivers financial management and compliance software and services for consumers, small businesses, and professionals in the US, Canada, and internationally. Its product portfolio covers QuickBooks, TurboTax, Credit Karma, and ProConnect, addressing accounting, tax preparation, and personal finance needs. Founded in 1983 and based in Mountain View, CA, Intuit employs around 18,800 people and operates in the software application sector.
Key similarities and differences
Both companies operate in the software application industry and are listed on NASDAQ. AppLovin focuses on mobile app marketing and monetization software, while Intuit specializes in financial management and compliance solutions. Intuit is significantly larger in workforce and offers a broader range of financial products, whereas AppLovin centers on enhancing app monetization through real-time auctions and analytics platforms.
Income Statement Comparison
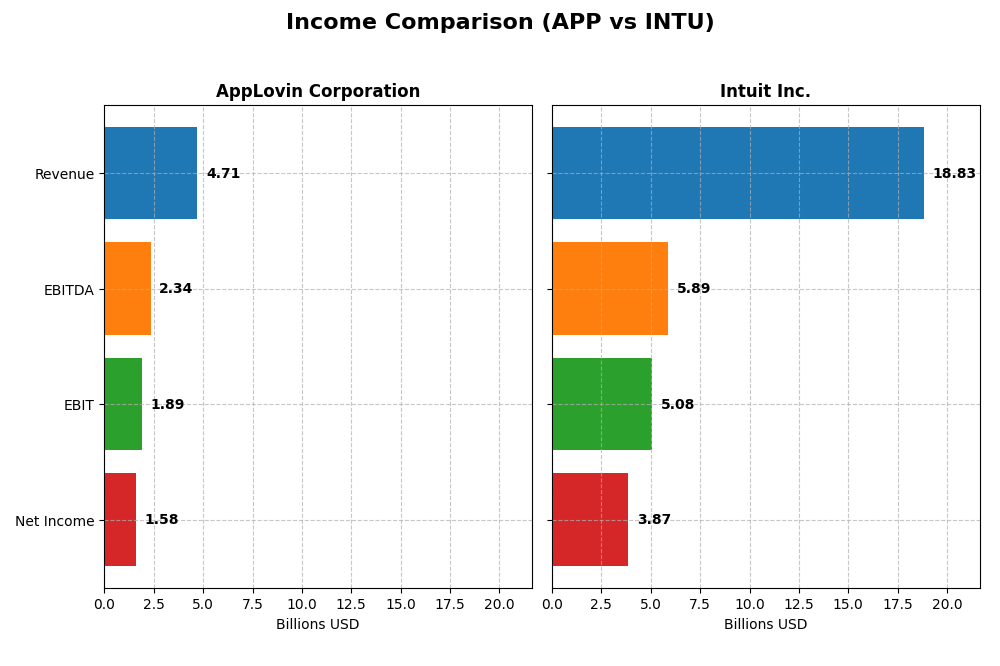
This table presents a side-by-side comparison of key income statement metrics for AppLovin Corporation and Intuit Inc. based on their most recent fiscal year data.
| Metric | AppLovin Corporation (APP) | Intuit Inc. (INTU) |
|---|---|---|
| Market Cap | 194B | 153B |
| Revenue | 4.71B | 18.83B |
| EBITDA | 2.34B | 5.89B |
| EBIT | 1.89B | 5.08B |
| Net Income | 1.58B | 3.87B |
| EPS | 4.68 | 13.82 |
| Fiscal Year | 2024 | 2025 |
Income Statement Interpretations
AppLovin Corporation
AppLovin showed strong revenue growth from $1.45B in 2020 to $4.71B in 2024, with net income swinging from a loss of $125M to a robust $1.58B. Margins improved significantly, especially net margin rising to 33.55% in 2024. The latest year saw exceptional growth, with revenue up 43.4% and net margin more than doubling, reflecting enhanced profitability and operational efficiency.
Intuit Inc.
Intuit demonstrated steady revenue growth from $9.63B in 2021 to $18.83B in 2025, with net income increasing from $2.06B to $3.87B. Margins remained solid, with a gross margin around 80.7% and net margin at 20.55% in 2025. The most recent year showed continued growth, though revenue and net income rose at a slower pace compared to earlier years, with net margin improving modestly.
Which one has the stronger fundamentals?
Both companies exhibit favorable income statement trends with strong growth and improving profitability. AppLovin excels in rapid growth and expanding margins, especially net margin surpassing 33%, while Intuit offers stable, high gross margins and consistent earnings with lower interest expenses. AppLovin’s faster growth contrasts with Intuit’s steadier, mature profile, suggesting differing risk-return dynamics.
Financial Ratios Comparison
The table below presents a side-by-side comparison of key financial ratios for AppLovin Corporation (APP) and Intuit Inc. (INTU) based on their most recent fiscal year data.
| Ratios | AppLovin Corporation (2024) | Intuit Inc. (2025) |
|---|---|---|
| ROE | 145% | 19.6% |
| ROIC | 38.7% | 14.8% |
| P/E | 69.1 | 56.8 |
| P/B | 100.1 | 11.2 |
| Current Ratio | 2.19 | 1.36 |
| Quick Ratio | 2.19 | 1.36 |
| D/E (Debt to Equity) | 3.26 | 0.34 |
| Debt-to-Assets | 60.6% | 18.0% |
| Interest Coverage | 5.89 | 19.9 |
| Asset Turnover | 0.80 | 0.51 |
| Fixed Asset Turnover | 23.7 | 12.5 |
| Payout Ratio | 0% | 30.7% |
| Dividend Yield | 0% | 0.54% |
Interpretation of the Ratios
AppLovin Corporation
AppLovin shows strong profitability with a net margin of 33.55% and an exceptional return on equity at 144.96%, indicating effective use of shareholder capital. However, concerns arise from high leverage (debt-to-equity 3.26) and elevated debt-to-assets at 60.59%. The company does not pay dividends, likely focusing on growth and reinvestment, as indicated by zero dividend yield and no payout.
Intuit Inc.
Intuit presents solid financial health with favorable net margin (20.55%) and return on equity (19.63%), supported by low leverage (debt-to-equity 0.34) and strong interest coverage (20.57). Although the dividend yield is modest at 0.54%, Intuit pays dividends consistently, balancing shareholder returns with sustainable payout levels and maintaining favorable liquidity ratios.
Which one has the best ratios?
Intuit’s ratios reflect a more balanced financial profile with moderate leverage, sustainable dividend yield, and strong coverage ratios, resulting in a generally favorable assessment. AppLovin exhibits higher profitability but carries significant debt and lacks dividend payments, leading to a slightly favorable but riskier ratio profile in comparison.
Strategic Positioning
This section compares the strategic positioning of AppLovin Corporation and Intuit Inc. across Market position, Key segments, and Exposure to technological disruption:
AppLovin Corporation
- Large market cap $194B, higher beta 2.5, faces tech competition in software applications.
- Focuses on mobile app marketing and monetization software, driven by advertising and app segments.
- Operates software platforms optimizing app advertising auctions and analytics, adapting to tech changes.
Intuit Inc.
- Market cap $153B, lower beta 1.25, competes in financial management software with steady demand.
- Diversified segments: Small Business, Consumer, Credit Karma, and Professional Tax solutions.
- Provides cloud-based financial and tax software, with broad exposure to fintech innovation.
AppLovin Corporation vs Intuit Inc. Positioning
AppLovin adopts a concentrated strategy focused on mobile app marketing and monetization, relying heavily on advertising revenue. Intuit pursues diversification across multiple financial software segments, balancing consumer and business markets with tax and credit services.
Which has the best competitive advantage?
AppLovin shows a very favorable moat with growing profitability and ROIC well above WACC, indicating a strong and durable competitive advantage. Intuit also creates value but with a slightly favorable moat and declining ROIC trend, suggesting more caution.
Stock Comparison
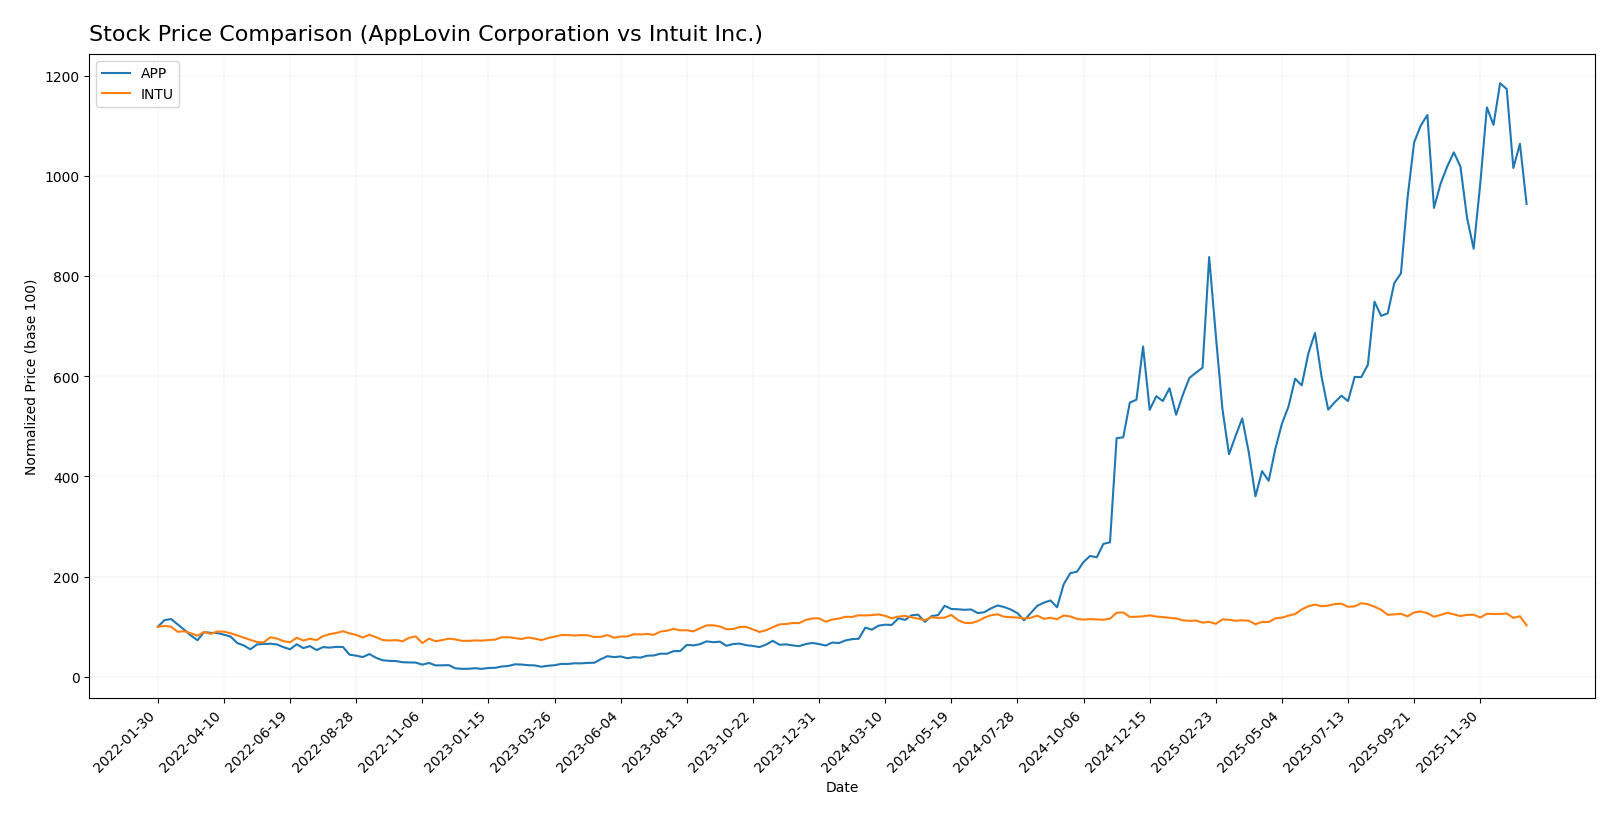
The stock price chart illustrates significant price movements and trading dynamics from November 2025 to January 2026, highlighting contrasting trends for AppLovin Corporation and Intuit Inc.
Trend Analysis
AppLovin Corporation’s stock showed a strong bullish trend over the past 12 months with a 901.39% price increase, though the acceleration has slowed. The price ranged from a low of 57.39 to a high of 721.37, with notable volatility at a 201.14 std deviation.
Intuit Inc. experienced a bearish trend over the same period, with a 16.68% price decline and decelerating momentum. Its stock fluctuated between 549.76 and 785.95, showing moderate volatility with a 51.42 std deviation.
Comparing the two, AppLovin Corporation delivered the highest market performance with a substantial price gain, while Intuit’s stock declined, reflecting divergent investor sentiment.
Target Prices
The consensus target prices for AppLovin Corporation and Intuit Inc. reflect optimistic analyst expectations.
| Company | Target High | Target Low | Consensus |
|---|---|---|---|
| AppLovin Corporation | 860 | 630 | 756.33 |
| Intuit Inc. | 880 | 700 | 798.4 |
Analysts see significant upside potential for both AppLovin and Intuit, with consensus targets about 32% and 45% above their current prices, respectively. This suggests positive market sentiment and growth expectations.
Analyst Opinions Comparison
This section compares analysts’ ratings and grades for AppLovin Corporation (APP) and Intuit Inc. (INTU):
Rating Comparison
APP Rating
- Rating: B, classified as Very Favorable by analysts.
- Discounted Cash Flow Score: Moderate at 3, indicating neutral valuation view.
- ROE Score: Very Favorable at 5, showing strong profit generation efficiency.
- ROA Score: Very Favorable at 5, demonstrating excellent asset utilization.
- Debt To Equity Score: Very Unfavorable at 1, pointing to high financial risk.
- Overall Score: Moderate at 3, indicating average overall financial strength.
INTU Rating
- Rating: B, also classified as Very Favorable by analysts.
- Discounted Cash Flow Score: Favorable at 4, suggesting better valuation.
- ROE Score: Favorable at 4, indicating efficient profit generation.
- ROA Score: Very Favorable at 5, equally strong asset utilization.
- Debt To Equity Score: Moderate at 2, reflecting lower financial risk.
- Overall Score: Moderate at 3, also indicating average overall financial strength.
Which one is the best rated?
Both APP and INTU hold a B rating and identical overall scores of 3, indicating moderate financial strength. INTU outperforms APP on discounted cash flow and debt-to-equity scores, suggesting a more favorable valuation and lower financial risk based strictly on this data.
Scores Comparison
Here is a comparison of the Altman Z-Score and Piotroski Score for AppLovin Corporation and Intuit Inc.:
APP Scores
- Altman Z-Score: 30.7, indicating a safe financial zone with very low bankruptcy risk.
- Piotroski Score: 7, reflecting strong financial health and good investment potential.
INTU Scores
- Altman Z-Score: 9.35, indicating a safe financial zone with very low bankruptcy risk.
- Piotroski Score: 9, reflecting very strong financial health and excellent investment potential.
Which company has the best scores?
Intuit has a lower Altman Z-Score than AppLovin but both are in the safe zone. Intuit’s Piotroski Score of 9 surpasses AppLovin’s 7, indicating stronger financial health and investment appeal based on the provided data.
Grades Comparison
Here is a comparison of the recent grades assigned to AppLovin Corporation and Intuit Inc.:
AppLovin Corporation Grades
The following table summarizes AppLovin’s recent analyst grades from reputable firms:
| Grading Company | Action | New Grade | Date |
|---|---|---|---|
| Morgan Stanley | Maintain | Overweight | 2026-01-13 |
| Wells Fargo | Maintain | Overweight | 2026-01-08 |
| Jefferies | Maintain | Buy | 2025-12-11 |
| Benchmark | Maintain | Buy | 2025-12-11 |
| Citigroup | Maintain | Buy | 2025-11-12 |
| Wells Fargo | Maintain | Overweight | 2025-11-07 |
| Goldman Sachs | Maintain | Neutral | 2025-11-07 |
| JP Morgan | Maintain | Neutral | 2025-11-06 |
| Wedbush | Maintain | Outperform | 2025-11-06 |
| Piper Sandler | Maintain | Overweight | 2025-11-06 |
AppLovin’s grades predominantly indicate positive sentiment, with multiple Buy and Overweight ratings maintained, and few Neutral ratings.
Intuit Inc. Grades
The table below outlines Intuit’s recent analyst grading activity:
| Grading Company | Action | New Grade | Date |
|---|---|---|---|
| Wells Fargo | Downgrade | Equal Weight | 2026-01-08 |
| Wells Fargo | Maintain | Overweight | 2025-11-21 |
| RBC Capital | Maintain | Outperform | 2025-11-21 |
| BMO Capital | Maintain | Outperform | 2025-11-21 |
| Evercore ISI Group | Maintain | Outperform | 2025-11-18 |
| RBC Capital | Maintain | Outperform | 2025-09-02 |
| RBC Capital | Maintain | Outperform | 2025-08-22 |
| UBS | Maintain | Neutral | 2025-08-22 |
| Morgan Stanley | Maintain | Overweight | 2025-08-22 |
| Barclays | Maintain | Overweight | 2025-08-22 |
Intuit shows a strong consensus of Outperform and Overweight ratings, although there was a recent downgrade to Equal Weight by Wells Fargo.
Which company has the best grades?
Both AppLovin and Intuit have a consensus rating of “Buy” with strong analyst support. Intuit’s grades include more frequent Outperform ratings, suggesting a slightly stronger bullish outlook, while AppLovin’s grades cluster around Buy and Overweight. For investors, Intuit’s broader consensus of Outperform ratings may imply higher expected returns, whereas AppLovin maintains steady positive sentiment with fewer downgrades.
Strengths and Weaknesses
Below is a comparison of key strengths and weaknesses for AppLovin Corporation (APP) and Intuit Inc. (INTU) based on the most recent data available.
| Criterion | AppLovin Corporation (APP) | Intuit Inc. (INTU) |
|---|---|---|
| Diversification | Moderate: Revenue mainly from Advertising (3.22B) and Apps (1.49B) segments | High: Diverse revenue streams including Global Business Solutions (11.08B), Consumer (4.87B), Credit Karma (2.26B), and Professional Tax (0.62B) |
| Profitability | Very high profitability with net margin at 33.55%, ROIC at 38.7%, and ROE at 144.96% | Strong profitability; net margin 20.55%, ROIC 14.78%, ROE 19.63% |
| Innovation | Very favorable economic moat with rapidly growing ROIC (+1173%), indicating strong innovation and competitive advantage | Slightly favorable moat but declining ROIC (-5.26%), suggesting innovation challenges or increased competition |
| Global presence | Strong global presence in digital advertising and app ecosystem | Extensive global business solutions and consumer financial software footprint |
| Market Share | Focused niche in mobile advertising and apps with growing market influence | Leading market position in financial and tax software with broad user base |
Key takeaways: AppLovin shows exceptional profitability and a very favorable moat driven by innovation but has less diversification. Intuit offers broader diversification and stable profitability but faces a slight decline in its competitive advantage, signaling a need to reinforce innovation efforts.
Risk Analysis
Below is a comparative table outlining key risk factors for AppLovin Corporation (APP) and Intuit Inc. (INTU) based on the most recent data from 2025-2026:
| Metric | AppLovin Corporation (APP) | Intuit Inc. (INTU) |
|---|---|---|
| Market Risk | High beta (2.5) indicates high volatility | Moderate beta (1.25), less volatile |
| Debt level | High debt-to-equity (3.26) and debt/assets (60.6%) | Low debt-to-equity (0.34) and debt/assets (18%) |
| Regulatory Risk | Moderate, tech sector subject to data/privacy laws | Moderate, financial software faces compliance regulations |
| Operational Risk | Medium, dependent on mobile app marketing trends | Low, diversified financial software products |
| Environmental Risk | Low, limited direct environmental impact | Low, primarily software-based operations |
| Geopolitical Risk | Moderate, global app markets exposure | Moderate, international financial regulations |
The most likely and impactful risks are market volatility and high debt levels for AppLovin, which may increase financial risk despite strong profitability. Intuit shows lower financial leverage and more stable operations but faces regulatory scrutiny typical of financial service providers. Investors should weigh AppLovin’s growth potential against its elevated debt burden and risk profile.
Which Stock to Choose?
AppLovin Corporation (APP) shows a highly favorable income evolution with revenue up 224.53% over five years and net margin at 33.55%. Financial ratios are slightly favorable overall, including strong ROE at 145%, though leverage and valuation ratios appear unfavorable. The company carries notable debt levels but maintains a very favorable rating and demonstrates a very favorable economic moat with growing ROIC.
Intuit Inc. (INTU) exhibits steady income growth of 95.48% over five years with a net margin of 20.55%. Its financial ratios are favorable overall, particularly in debt management and profitability metrics, supported by a strong rating. The economic moat is slightly favorable due to a declining ROIC trend, despite efficient capital use and solid profitability indicators.
Investors focused on high growth and strong profitability might view APP’s robust income gains and expanding economic moat as attractive, while those prioritizing stable profitability and lower financial risk could find INTU’s favorable ratios and steadier income growth more aligned with their profile. The contrasting ROIC trends and debt profiles suggest the choice may depend on an individual’s risk tolerance and investment strategy.
Disclaimer: Investment carries a risk of loss of initial capital. The past performance is not a reliable indicator of future results. Be sure to understand risks before making an investment decision.
Go Further
I encourage you to read the complete analyses of AppLovin Corporation and Intuit Inc. to enhance your investment decisions: