In the dynamic world of software applications, AppLovin Corporation and Figma, Inc. stand out as innovative leaders shaping their respective niches. AppLovin excels in mobile app marketing and monetization, while Figma revolutionizes collaborative design and product development tools. Both companies operate in overlapping markets with strong growth potential, making them compelling choices for investors. This article will help you determine which company offers the most attractive investment opportunity.
Table of contents
Companies Overview
I will begin the comparison between AppLovin Corporation and Figma, Inc. by providing an overview of these two companies and their main differences.
AppLovin Overview
AppLovin Corporation focuses on building a software platform that helps mobile app developers improve marketing and monetization globally. Its solutions include marketing software, analytics tools, and real-time auctions to optimize advertising inventory. Founded in 2011 and headquartered in Palo Alto, CA, AppLovin serves advertisers, publishers, and internet platforms mainly in the application software industry.
Figma Overview
Figma, Inc. develops a browser-based collaborative design tool that supports product design and development teams. Its offerings include design prototyping, code inspection, presentation tools, and AI-powered design assistance. Incorporated in 2012 and based in San Francisco, CA, Figma operates within the software application sector, targeting designers and development teams with its innovative creative platform.
Key similarities and differences
Both companies operate in the software application industry and provide innovative technology solutions to improve productivity and user experience. AppLovin targets mobile app marketing and monetization, while Figma focuses on collaborative design and prototyping tools. They share a technology-driven business model but serve distinct user bases—AppLovin addresses advertisers and publishers, whereas Figma caters primarily to design and development professionals.
Income Statement Comparison
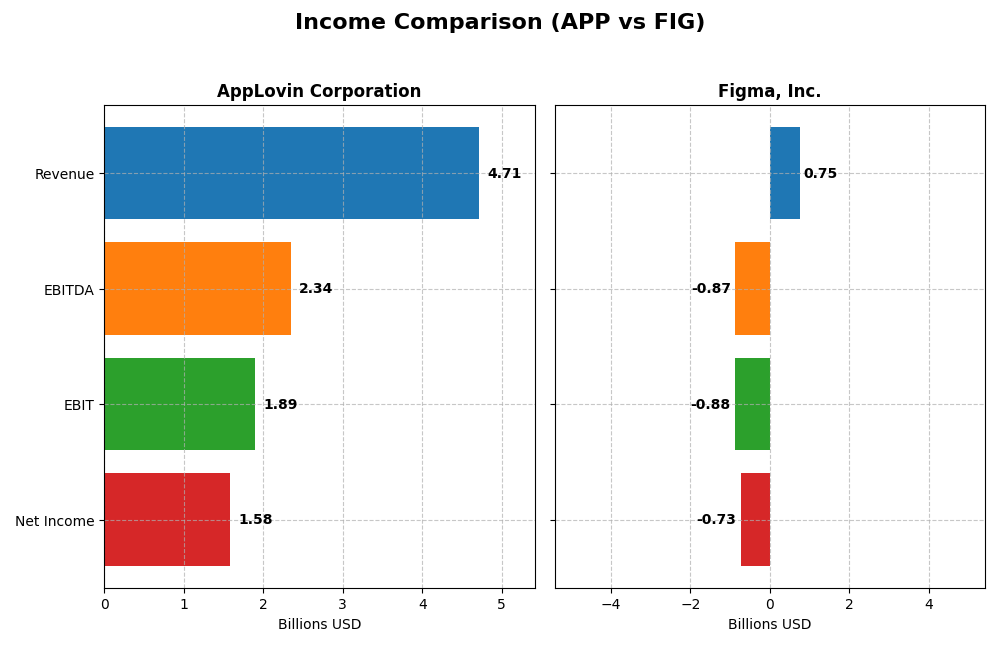
This table compares the key income statement metrics for AppLovin Corporation and Figma, Inc. for the fiscal year 2024, highlighting their financial performance and profitability.
| Metric | AppLovin Corporation | Figma, Inc. |
|---|---|---|
| Market Cap | 194.1B | 14.7B |
| Revenue | 4.71B | 749M |
| EBITDA | 2.34B | -870M |
| EBIT | 1.89B | -877M |
| Net Income | 1.58B | -732M |
| EPS | 4.68 | -3.11 |
| Fiscal Year | 2024 | 2024 |
Income Statement Interpretations
AppLovin Corporation
AppLovin has demonstrated strong revenue growth from 2020 to 2024, with a notable 43.44% increase in the most recent year, pushing revenue to $4.7B. Net income surged substantially, reflecting improved profitability and expanding margins, with net margin at 33.55%. The fiscal year 2024 marked a sharp rise in EBIT, indicating operational efficiency gains and robust earnings growth.
Figma, Inc.
Figma’s revenue rose 48.36% to $749M in 2024, showing solid top-line growth. However, despite a high gross margin of 88.32%, the company reported a significant operating loss and negative EBIT margin of -117.15%. Net income remained deeply negative at -$732M, highlighting challenges in converting revenue growth into profitability during its early post-IPO phase.
Which one has the stronger fundamentals?
AppLovin’s income statement reveals a favorable trend with high gross and net margins, consistent profit growth, and improved EPS, signifying strong fundamentals. In contrast, Figma’s income statement shows unfavorable profitability metrics despite revenue gains, with losses weighing heavily on margins and net income. Consequently, AppLovin exhibits more robust income statement fundamentals.
Financial Ratios Comparison
The table below compares key financial ratios for AppLovin Corporation (APP) and Figma, Inc. (FIG) based on the most recent fiscal year data available for 2024.
| Ratios | AppLovin Corporation (APP) | Figma, Inc. (FIG) |
|---|---|---|
| ROE | 145% | -55.3% |
| ROIC | 38.7% | -59.7% |
| P/E | 69.1 | -70.7 |
| P/B | 100.1 | 39.1 |
| Current Ratio | 2.19 | 3.66 |
| Quick Ratio | 2.19 | 3.66 |
| D/E | 3.26 | 0.02 |
| Debt-to-Assets | 60.6% | 1.6% |
| Interest Coverage | 5.89 | 0 |
| Asset Turnover | 0.80 | 0.42 |
| Fixed Asset Turnover | 23.7 | 17.1 |
| Payout Ratio | 0 | 0 |
| Dividend Yield | 0 | 0 |
Interpretation of the Ratios
AppLovin Corporation
AppLovin shows strong profitability ratios with a net margin of 33.55% and a return on equity of 144.96%, indicating efficient operations. However, concerns arise from its high debt-to-equity ratio of 3.26 and a debt-to-assets ratio of 60.59%, reflecting elevated leverage. The company does not pay dividends, likely prioritizing reinvestment and growth, with no dividend yield reported.
Figma, Inc.
Figma’s financial ratios reveal significant weaknesses, including a negative net margin of -97.74% and a return on equity of -55.29%, indicating losses and poor profitability. The company maintains low leverage with a debt-to-equity ratio of 0.02, but interest coverage is zero, implying difficulty covering interest expenses. Figma also pays no dividends, suggesting reinvestment in growth and development.
Which one has the best ratios?
AppLovin presents a more favorable ratio profile, supported by strong profitability and reasonable liquidity despite high leverage. In contrast, Figma exhibits unfavorable ratios with substantial losses and weaker operational metrics, contributing to an overall less attractive financial position based on the provided data.
Strategic Positioning
This section compares the strategic positioning of AppLovin Corporation and Figma, Inc., including Market position, Key segments, and Exposure to technological disruption:
AppLovin Corporation
- Large market cap of 194B, operating in a competitive software application industry.
- Focused on advertising and app monetization platforms, with strong revenue in advertising.
- Utilizes software platforms like AppDiscovery, Adjust, and MAX to optimize marketing.
Figma, Inc.
- Smaller market cap of 14.7B, also in software applications but with different competitive dynamics.
- Concentrated on collaborative design tools and product development software without reported revenue data.
- Develops browser-based UI design tools with AI features and collaborative functions for design teams.
AppLovin Corporation vs Figma, Inc. Positioning
AppLovin has a diversified business model with significant revenues from advertising and apps, leveraging multiple software solutions. Figma focuses narrowly on design collaboration tools, potentially limiting revenue diversification but targeting a specialized market segment.
Which has the best competitive advantage?
AppLovin demonstrates a strong and growing economic moat with ROIC well above WACC, indicating durable competitive advantage. Figma shows a declining ROIC below WACC, signaling value destruction and a weak competitive position.
Stock Comparison
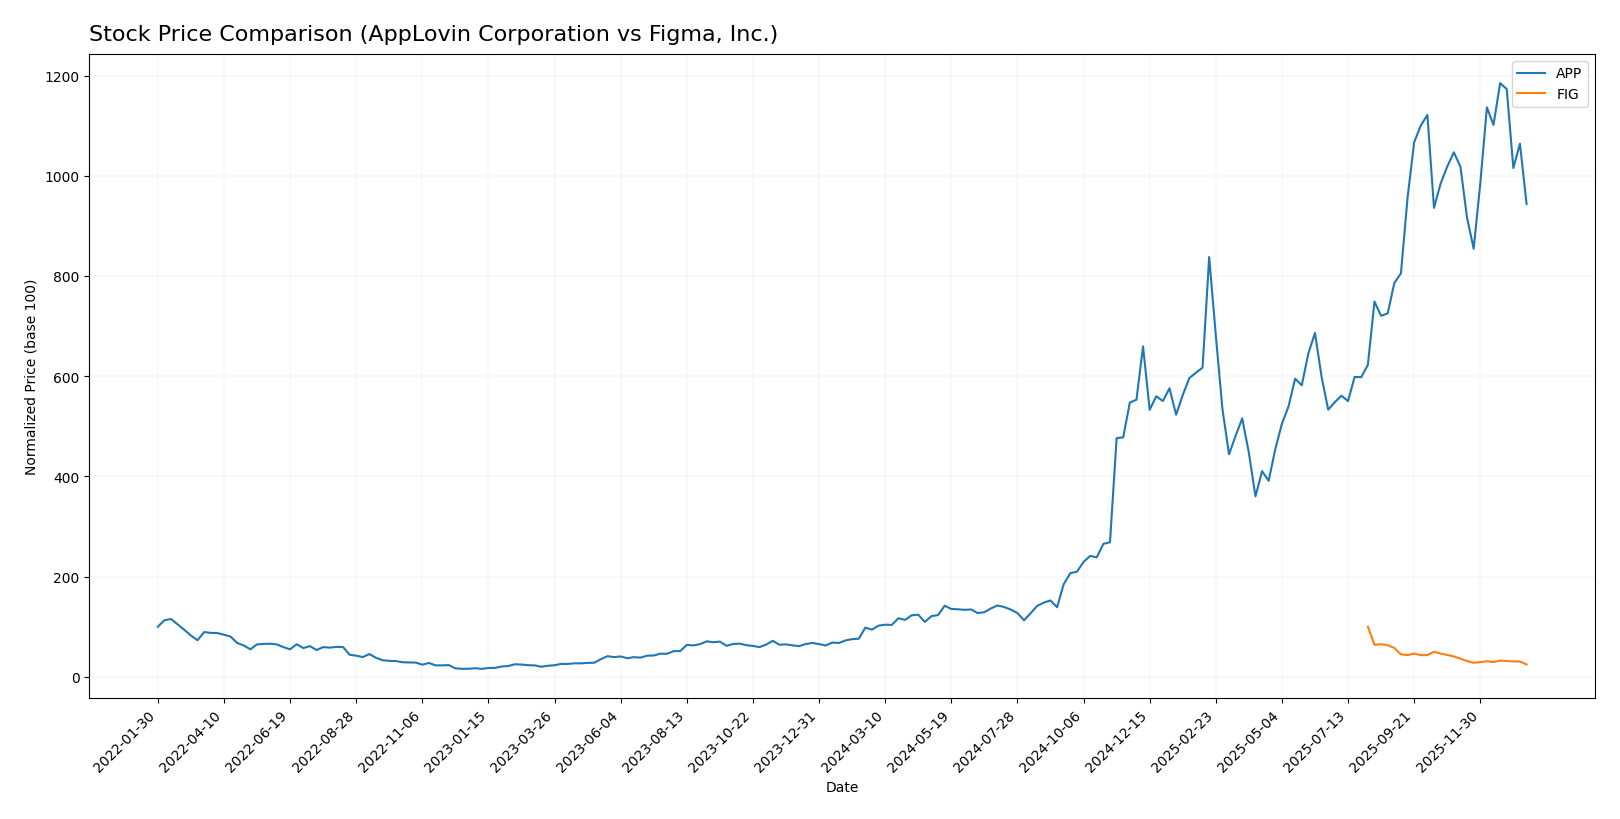
The stock price movements over the past 12 months reveal a stark contrast: AppLovin Corporation (APP) exhibits a strong bullish trend with significant gains despite recent deceleration, while Figma, Inc. (FIG) shows an accelerating bearish trend marked by steep declines.
Trend Analysis
AppLovin Corporation’s stock increased by 901.36% over the past year, indicating a bullish trend with deceleration. Its price ranged between 57.39 and 721.37, with high volatility reflected in a 201.14 standard deviation.
Figma, Inc.’s stock price dropped by 75.25% over the same period, confirming a bearish trend with accelerating decline. The price fluctuated between 30.2 and 122.0, showing lower volatility at 19.92 standard deviation.
Comparing both, AppLovin’s stock delivered substantially higher market performance than Figma, maintaining a positive momentum despite recent slight losses, whereas Figma’s trend remains negative and accelerating downward.
Target Prices
The target price consensus for AppLovin Corporation and Figma, Inc. reflects analysts’ expectations for potential price movements.
| Company | Target High | Target Low | Consensus |
|---|---|---|---|
| AppLovin Corporation | 860 | 630 | 756.33 |
| Figma, Inc. | 52 | 38 | 43.6 |
Analysts see significant upside for AppLovin Corporation, with consensus targets well above the current price of $573.85. Figma, Inc. also shows potential, with targets notably higher than its current $30.11 price, indicating bullish sentiment.
Analyst Opinions Comparison
This section compares analysts’ ratings and grades for AppLovin Corporation and Figma, Inc.:
Rating Comparison
APP Rating
- Rating: B, categorized as Very Favorable by analysts.
- Discounted Cash Flow Score: Moderate score of 3, reflecting fair valuation.
- ROE Score: Very Favorable score of 5, showing strong profitability.
- ROA Score: Very Favorable score of 5, highlighting efficient asset use.
- Debt To Equity Score: Very Unfavorable score of 1, suggesting higher risk.
- Overall Score: Moderate score of 3, a balanced overall financial standing.
FIG Rating
- Rating: C+, also considered Very Favorable according to the same evaluation.
- Discounted Cash Flow Score: Favorable score of 4, indicating better valuation.
- ROE Score: Very Unfavorable score of 1, indicating weak equity returns.
- ROA Score: Very Unfavorable score of 1, reflecting inefficient asset use.
- Debt To Equity Score: Favorable score of 4, showing stronger balance sheet.
- Overall Score: Moderate score of 2, slightly lower overall financial standing.
Which one is the best rated?
Based strictly on the provided data, APP holds a higher overall rating (B vs. C+) and stronger ROE and ROA scores, despite a weaker debt-to-equity score. FIG shows better discounted cash flow and debt-to-equity scores but lower profitability metrics.
Scores Comparison
Here is a comparison of the Altman Z-Score and Piotroski Score for the two companies:
APP Scores
- Altman Z-Score: 30.7, indicating a safe zone with very low bankruptcy risk.
- Piotroski Score: 7, classified as strong financial health.
FIG Scores
- Altman Z-Score: 14.3, also in the safe zone, showing low bankruptcy risk.
- Piotroski Score: 4, considered average financial strength.
Which company has the best scores?
Based on the provided data, APP has both a higher Altman Z-Score and a stronger Piotroski Score compared to FIG. APP shows stronger financial health and lower bankruptcy risk than FIG according to these metrics.
Grades Comparison
Here is the comparison of recent grades and ratings for AppLovin Corporation and Figma, Inc.:
AppLovin Corporation Grades
The following table summarizes recent grades from leading financial institutions for AppLovin Corporation:
| Grading Company | Action | New Grade | Date |
|---|---|---|---|
| Morgan Stanley | Maintain | Overweight | 2026-01-13 |
| Wells Fargo | Maintain | Overweight | 2026-01-08 |
| Jefferies | Maintain | Buy | 2025-12-11 |
| Benchmark | Maintain | Buy | 2025-12-11 |
| Citigroup | Maintain | Buy | 2025-11-12 |
| Wells Fargo | Maintain | Overweight | 2025-11-07 |
| Goldman Sachs | Maintain | Neutral | 2025-11-07 |
| JP Morgan | Maintain | Neutral | 2025-11-06 |
| Wedbush | Maintain | Outperform | 2025-11-06 |
| Piper Sandler | Maintain | Overweight | 2025-11-06 |
Overall, AppLovin Corporation has received predominantly positive grades, with multiple “Buy” and “Overweight” ratings maintained by several major firms.
Figma, Inc. Grades
The table below presents recent grades from reputable grading companies for Figma, Inc.:
| Grading Company | Action | New Grade | Date |
|---|---|---|---|
| Morgan Stanley | Maintain | Equal Weight | 2026-01-15 |
| Wells Fargo | Upgrade | Overweight | 2026-01-08 |
| RBC Capital | Maintain | Sector Perform | 2026-01-05 |
| Goldman Sachs | Maintain | Neutral | 2025-11-07 |
| JP Morgan | Maintain | Neutral | 2025-11-06 |
| Piper Sandler | Maintain | Overweight | 2025-11-06 |
| Wells Fargo | Maintain | Equal Weight | 2025-11-05 |
| Wells Fargo | Maintain | Equal Weight | 2025-09-04 |
| Morgan Stanley | Maintain | Equal Weight | 2025-09-04 |
| RBC Capital | Maintain | Sector Perform | 2025-09-04 |
Figma, Inc. shows a more mixed set of ratings, mostly “Equal Weight” and “Neutral,” with some recent upgrades but fewer strong buy recommendations.
Which company has the best grades?
AppLovin Corporation holds generally stronger grades, with consistent “Buy” and “Overweight” recommendations from multiple firms, indicating more bullish analyst sentiment. Figma, Inc.’s ratings are more conservative, with a consensus leaning towards “Hold.” For investors, this disparity may reflect differing expectations for growth and risk profiles between the two companies.
Strengths and Weaknesses
The table below compares key strengths and weaknesses of AppLovin Corporation (APP) and Figma, Inc. (FIG) based on their recent financial and competitive data.
| Criterion | AppLovin Corporation (APP) | Figma, Inc. (FIG) |
|---|---|---|
| Diversification | Strong diversification with significant revenue from Advertising ($3.22B) and Apps ($1.49B) segments | Limited diversification, primarily focused on design software |
| Profitability | High profitability: net margin 33.55%, ROIC 38.7%, ROE 144.96% | Negative profitability: net margin -97.74%, ROIC -59.68%, ROE -55.29% |
| Innovation | Consistent innovation supporting strong ROIC growth (+1173%) | Innovation present but unable to translate into profitability; ROIC declining (-1014%) |
| Global presence | Established global footprint with scalable advertising platform | Smaller global presence, more niche market focus |
| Market Share | Significant market share in mobile advertising and app monetization | Growing market share in design software but facing intense competition |
Key takeaways: AppLovin exhibits a robust financial profile with growing profitability and diversified revenue, signaling a durable competitive advantage. Conversely, Figma is struggling with profitability and value creation despite innovation efforts, indicating higher investment risk at present.
Risk Analysis
Below is a comparative table of key risks for AppLovin Corporation (APP) and Figma, Inc. (FIG) based on the most recent data from 2024:
| Metric | AppLovin Corporation (APP) | Figma, Inc. (FIG) |
|---|---|---|
| Market Risk | High beta (2.5), volatile stock price | Negative beta (-3.8), unusual market behavior |
| Debt level | High debt-to-equity (3.26), 60.6% debt/assets | Very low debt (0.02), 1.6% debt/assets |
| Regulatory Risk | Moderate, US tech sector exposure | Moderate, US tech and software regulations |
| Operational Risk | Moderate, strong ROE but high leverage | High, significant negative margins and ROE |
| Environmental Risk | Low, software industry with minimal environmental impact | Low, software industry with minimal environmental impact |
| Geopolitical Risk | Moderate, US-based with international clients | Moderate, US-based with global collaboration |
The most impactful risks are AppLovin’s high debt load and market volatility, increasing financial risk despite strong profitability. Figma’s challenges lie in operational losses and poor profitability metrics, raising concerns about sustainability. Both face moderate regulatory and geopolitical risks typical of US tech firms.
Which Stock to Choose?
AppLovin Corporation (APP) has shown strong income growth with a 224.53% revenue increase over five years and a favorable global income statement rating. Its financial ratios are slightly favorable overall, supported by high profitability, robust returns on equity (145%) and invested capital (38.7%), though debt levels remain elevated. APP’s moat evaluation is very favorable, indicating durable competitive advantages and value creation. The company holds a very favorable B rating, with strong Altman Z and Piotroski scores signaling financial stability.
Figma, Inc. (FIG) exhibits mixed income results, with favorable gross margin but unfavorable EBIT and net margins, and an overall unfavorable income statement evaluation. Its financial ratios are globally unfavorable, reflecting negative returns and operational challenges despite low debt levels. FIG’s moat status is very unfavorable, pointing to declining profitability and value destruction. The firm has a very favorable C+ rating but moderate financial health scores, suggesting caution regarding its stability.
For investors, APP may appear more suitable for those prioritizing quality and growth investing due to its strong profitability, improving income, and solid moat. Conversely, FIG might appeal to risk-tolerant investors focused on potential turnaround or value opportunities, considering its lower debt and recent revenue growth but weaker profitability and financial metrics. The choice could depend on an investor’s risk appetite and strategy preferences.
Disclaimer: Investment carries a risk of loss of initial capital. The past performance is not a reliable indicator of future results. Be sure to understand risks before making an investment decision.
Go Further
I encourage you to read the complete analyses of AppLovin Corporation and Figma, Inc. to enhance your investment decisions: