Home > Comparison > Technology > APP vs FICO
The competitive dynamic between AppLovin Corporation and Fair Isaac Corporation shapes the evolving landscape of the technology sector. AppLovin operates as a nimble, mobile-focused software platform specializing in app marketing and monetization. In contrast, Fair Isaac stands as a mature analytics and decision management software leader with broad enterprise applications. This analysis aims to identify which business model presents a superior risk-adjusted opportunity in a sector defined by innovation and digital transformation.
Table of contents
Companies Overview
AppLovin and Fair Isaac Corporation both hold critical roles in the software application sector, shaping how businesses leverage technology globally.
AppLovin Corporation: Mobile Marketing Innovator
AppLovin dominates the mobile app marketing space with its software platform that connects advertisers and publishers through real-time auctions. Its revenue stems from solutions like AppDiscovery, Adjust analytics, and MAX in-app bidding. In 2026, AppLovin prioritizes optimizing ad inventory value and expanding international reach to solidify its competitive position.
Fair Isaac Corporation: Analytics and Decision Management Leader
Fair Isaac excels in decision management software and scoring solutions that automate and enhance business decisions worldwide. It generates revenue from its Scores and Software segments, including the modular FICO Platform. The company focuses on deepening analytics integration and broadening client adoption across multiple industries in the current year.
Strategic Collision: Similarities & Divergences
Both companies rely on data-driven software but differ in approach: AppLovin focuses on an open auction-based ecosystem, while Fair Isaac offers customizable, modular analytic solutions. They compete mainly in enterprise software for decision-making and marketing efficiency. Their investment profiles diverge with AppLovin emphasizing growth in mobile advertising, and Fair Isaac targeting steady expansion in analytics-driven risk management.
Income Statement Comparison
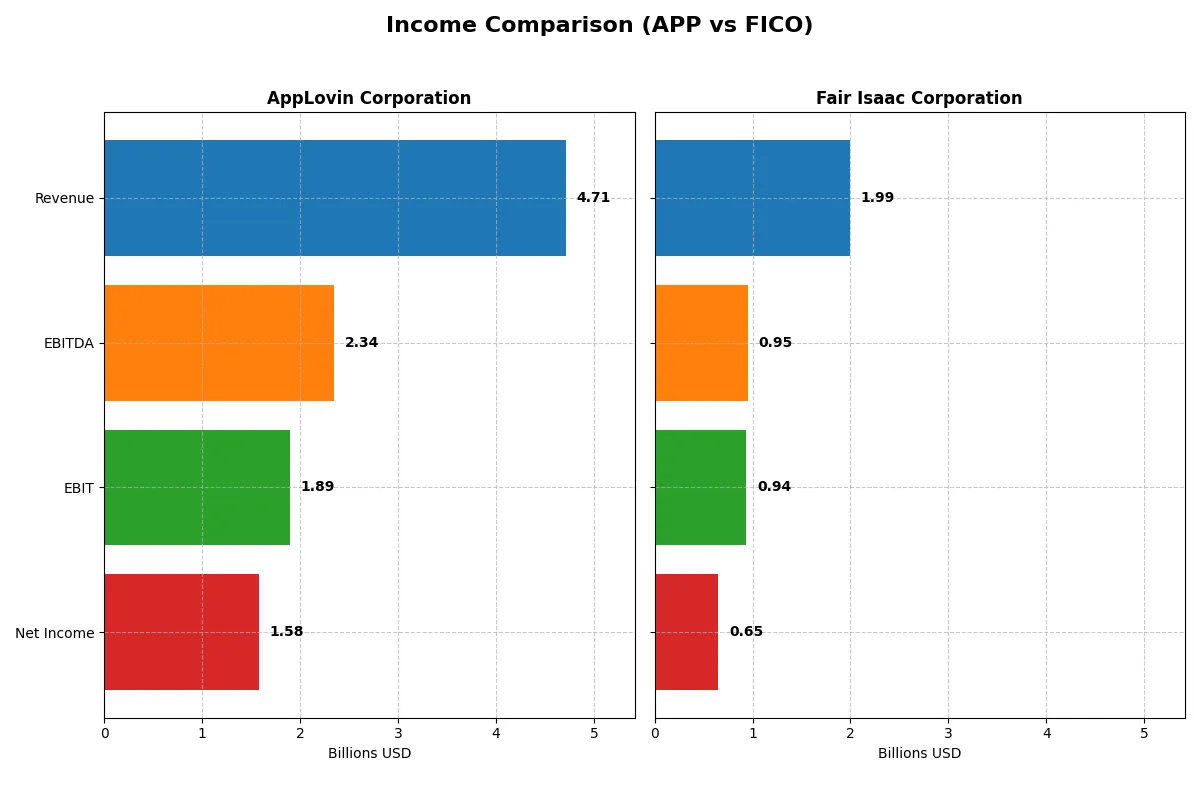
This table dissects the core profitability and scalability of both corporate engines to reveal who dominates the bottom line:
| Metric | AppLovin Corporation (APP) | Fair Isaac Corporation (FICO) |
|---|---|---|
| Revenue | 4.71B | 1.99B |
| Cost of Revenue | 1.17B | 354M |
| Operating Expenses | 1.67B | 712M |
| Gross Profit | 3.54B | 1.64B |
| EBITDA | 2.34B | 951M |
| EBIT | 1.89B | 936M |
| Interest Expense | 318M | 134M |
| Net Income | 1.58B | 652M |
| EPS | 4.68 | 26.9 |
| Fiscal Year | 2024 | 2025 |
Income Statement Analysis: The Bottom-Line Duel
The income statement comparison reveals which company operates with superior efficiency and delivers stronger profitability through its core business engine.
AppLovin Corporation Analysis
AppLovin’s revenue surged from 3.28B in 2023 to 4.71B in 2024, marking a 43% increase. Net income exploded from 355M to 1.58B, reflecting a sharp momentum shift. Gross margin stands robust at 75.2%, and net margin expanded to 33.6%, signaling improved operational leverage and cost control in 2024.
Fair Isaac Corporation Analysis
Fair Isaac’s revenue climbed steadily from 1.72B in 2024 to nearly 2.0B in 2025, a 16% increase. Net income advanced from 513M to 652M, maintaining solid growth. The company boasts a higher gross margin of 82.2% and an EBIT margin of 47.0%, showing superior cost efficiency and consistent profitability expansion.
Verdict: Rapid Growth vs. High Margin Efficiency
AppLovin outpaces Fair Isaac in revenue and net income growth, posting a remarkable 1362% net income increase over five years. However, Fair Isaac commands superior margins, reflecting a more efficient cost structure. Investors seeking dynamic growth may prefer AppLovin’s trajectory, while those valuing margin stability might lean toward Fair Isaac’s consistent profitability.
Financial Ratios Comparison
These vital ratios act as a diagnostic tool to expose the underlying fiscal health, valuation premiums, and capital efficiency of the companies analyzed below:
| Ratios | AppLovin Corporation (APP) | Fair Isaac Corporation (FICO) |
|---|---|---|
| ROE | 1.45 | -0.37 |
| ROIC | 0.39 | 0.53 |
| P/E | 69.06 | 55.64 |
| P/B | 100.11 | -20.78 |
| Current Ratio | 2.19 | 0.83 |
| Quick Ratio | 2.19 | 0.83 |
| D/E | 3.26 | -1.76 |
| Debt-to-Assets | 0.61 | 1.65 |
| Interest Coverage | 5.89 | 6.92 |
| Asset Turnover | 0.80 | 1.07 |
| Fixed Asset Turnover | 23.71 | 21.20 |
| Payout ratio | 0 | 0 |
| Dividend yield | 0 | 0 |
| Fiscal Year | 2024 | 2025 |
Efficiency & Valuation Duel: The Vital Signs
Financial ratios serve as a company’s DNA, exposing hidden risks and operational strengths behind the numbers.
AppLovin Corporation
AppLovin boasts a stellar 145% ROE and a robust 33.55% net margin, signaling exceptional profitability. However, its valuation appears stretched with a P/E of 69 and a P/B of 100, suggesting investor optimism may be priced in. The company does not pay dividends, instead reinvesting heavily in R&D to fuel growth.
Fair Isaac Corporation
Fair Isaac delivers strong operational efficiency with a 53% ROIC and solid 32.75% net margin. Its P/E of 56 is high but less extreme than AppLovin’s. Despite negative ROE, Fair Isaac maintains favorable asset turnover and interest coverage. The firm also forgoes dividends, focusing on reinvestment to sustain innovation.
Premium Valuation vs. Operational Safety
AppLovin’s profitability dazzles, yet its sky-high multiples raise valuation risk. Fair Isaac offers more balanced operational metrics with moderate valuation pressures. Investors seeking aggressive growth may lean toward AppLovin, while those prioritizing operational resilience might prefer Fair Isaac’s steadier profile.
Which one offers the Superior Shareholder Reward?
I observe that neither AppLovin Corporation (APP) nor Fair Isaac Corporation (FICO) pay dividends in 2026. APP reinvests robustly, generating 6.2 FCF/share with zero dividend payout, focusing on growth instead. FICO also forgoes dividends but delivers much higher free cash flow at ~31.8/share. Both companies engage in share buybacks, a key return driver, though FICO’s larger free cash flow suggests a more aggressive buyback potential. APP’s payout ratio is 0%, emphasizing retention, while FICO’s scale and margins (47% EBIT) support sustained buybacks. Given their capital allocation, FICO offers a superior total shareholder return profile in 2026 due to stronger free cash flow and more sustainable buyback capacity.
Comparative Score Analysis: The Strategic Profile
The radar chart reveals the fundamental DNA and trade-offs of AppLovin Corporation and Fair Isaac Corporation, highlighting their financial strengths and valuation challenges:
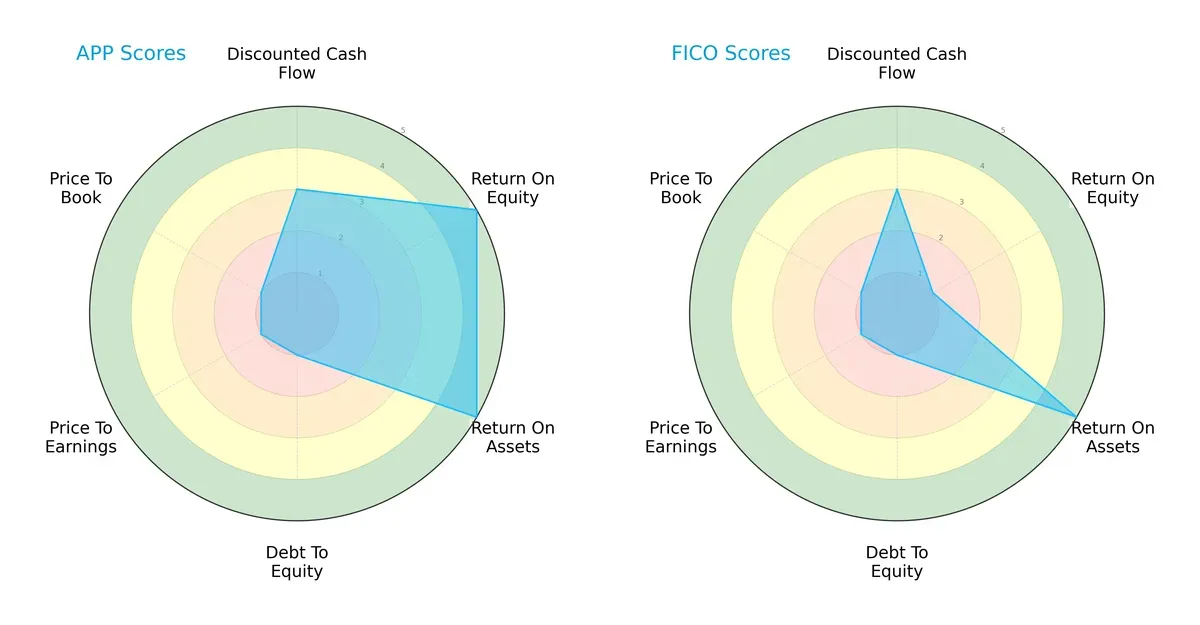
AppLovin shows superior profitability with very favorable ROE and ROA scores of 5, but suffers from poor financial leverage and valuation metrics (debt/equity, P/E, P/B scores all 1). Fair Isaac matches AppLovin’s asset efficiency but lags notably on ROE at 1, indicating weaker profit generation from equity. Both face valuation headwinds, but AppLovin’s balanced profitability contrasts with Fair Isaac’s reliance on asset use, exposing a more one-dimensional profile.
—
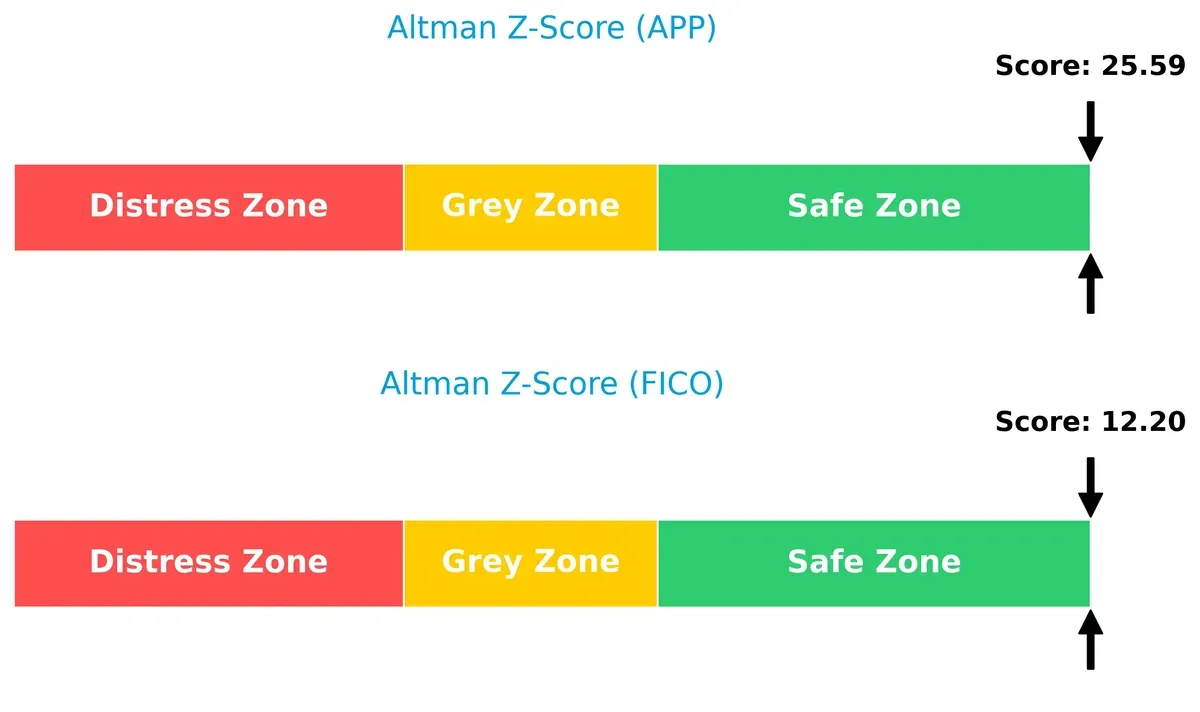
Bankruptcy Risk: Solvency Showdown
Both firms reside comfortably in the safe zone, but AppLovin’s Altman Z-Score of 25.6 far exceeds Fair Isaac’s 12.2, implying a substantially stronger buffer against bankruptcy risk in this market cycle:
—
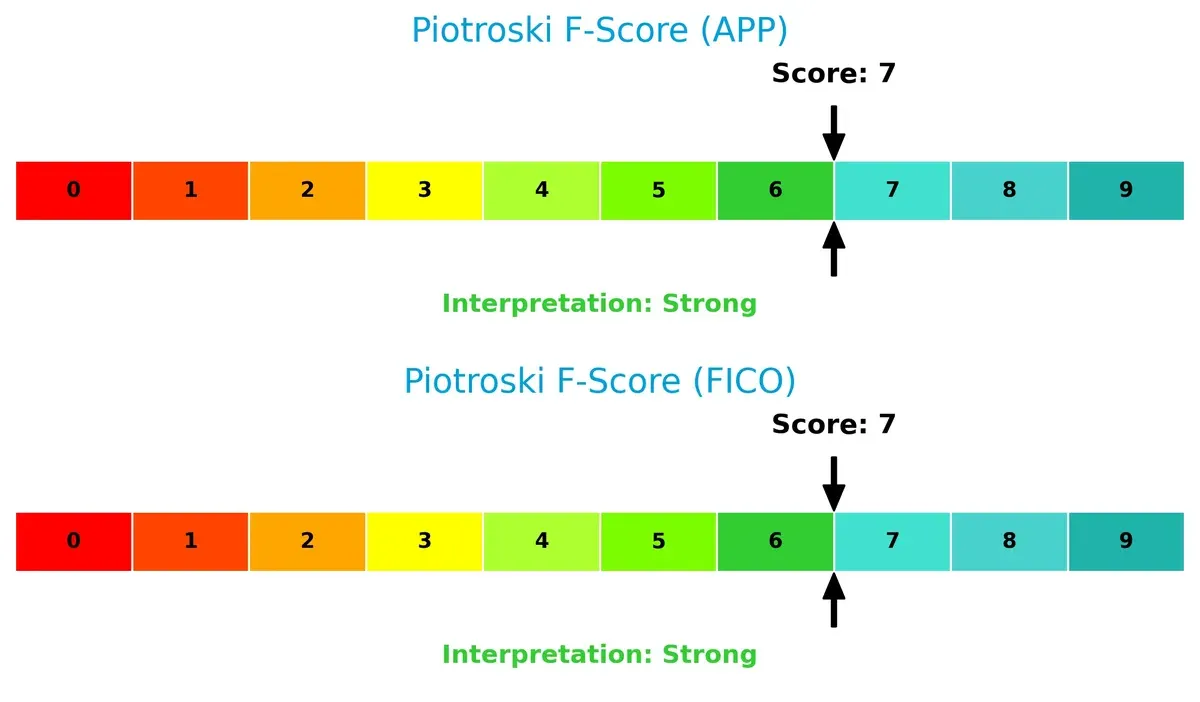
Financial Health: Quality of Operations
Both companies achieve a strong Piotroski F-Score of 7, signaling robust financial health and operational quality. Neither shows immediate red flags in internal metrics, suggesting solid fundamentals for long-term durability:
How are the two companies positioned?
This section dissects the operational DNA of APP and FICO by comparing their revenue distribution and internal dynamics. The goal is to confront their economic moats and identify the more resilient, sustainable competitive advantage today.
Revenue Segmentation: The Strategic Mix
The following visual comparison dissects how AppLovin Corporation and Fair Isaac Corporation diversify their income streams and where their primary sector bets lie:
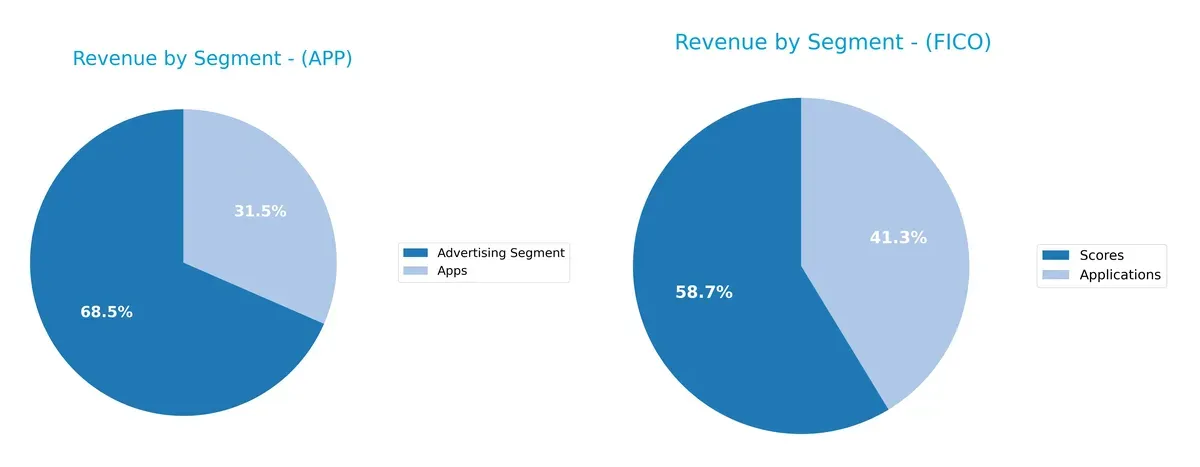
AppLovin’s 2024 revenue pivots mainly on Advertising at $3.22B, overshadowing Apps at $1.49B, signaling reliance on its ad ecosystem. Conversely, Fair Isaac balances its 2025 revenue more evenly between Scores at $1.17B and Applications at $822M, showing a diversified model. AppLovin’s concentration risks contrast with Fair Isaac’s strategic spread, which anchors resilience through software and scoring services.
Strengths and Weaknesses Comparison
This table compares the strengths and weaknesses of AppLovin Corporation and Fair Isaac Corporation:
AppLovin Corporation Strengths
- Strong profitability with 33.55% net margin
- High ROE at 144.96% and ROIC 38.7%
- Solid liquidity ratios above 2.0
- Significant Advertising and Apps revenue diversification
- Large U.S. and Rest of World geographic presence
Fair Isaac Corporation Strengths
- High ROIC at 52.96%
- Favorable PB ratio indicating undervaluation
- Strong interest coverage and asset turnovers
- Diverse geography including Americas, Asia Pacific, and EMEA
- Balanced revenue across Applications and Scores segments
AppLovin Corporation Weaknesses
- Elevated debt-to-equity at 3.26 and 60.59% debt-to-assets
- High WACC and valuation multiples (PE 69, PB 100)
- No dividend yield
- Moderate asset turnover at 0.8
Fair Isaac Corporation Weaknesses
- Negative ROE at -37.34% signals profitability issues
- Low current ratio at 0.83 hints liquidity risk
- High debt-to-assets at 164.6% despite favorable debt/equity
- No dividend yield
- PE ratio still relatively high at 55.64
Both companies show strong returns on invested capital and profitability but face risks from leverage and valuation metrics. APP’s liquidity cushions debt concerns, while FICO’s negative ROE and liquidity ratios warrant caution. Their geographic and product diversifications support strategic resilience.
The Moat Duel: Analyzing Competitive Defensibility
A structural moat shields long-term profits from relentless competition erosion. Understanding each firm’s moat reveals their lasting economic advantage:
AppLovin Corporation: Dynamic Switching Costs
AppLovin’s moat centers on high switching costs via its integrated app marketing and monetization platform. Its 33.5% net margin and soaring 1173% ROIC growth confirm efficient capital use. Expanding global mobile ad markets in 2026 could deepen this advantage.
Fair Isaac Corporation: Enduring Intangible Assets
Fair Isaac relies on proprietary analytics and credit scoring algorithms as intangible assets. Its 32.7% net margin and stable 61.9% ROIC growth reflect solid value creation. Continued innovation in decision management software supports expansion into new financial sectors.
Verdict: Switching Costs vs. Intangible Assets in Tech Platforms
Both boast robust moats with very favorable ROIC vs. WACC. AppLovin’s rapidly growing ROIC signals a widening moat, while Fair Isaac’s steady growth reflects a deep, durable moat. AppLovin is better positioned to defend market share amid fast mobile ad evolution.
Which stock offers better returns?
The past year reveals starkly different trajectories: AppLovin soared with a 646% gain but slowed recently, while Fair Isaac showed modest growth before a sharper recent decline.
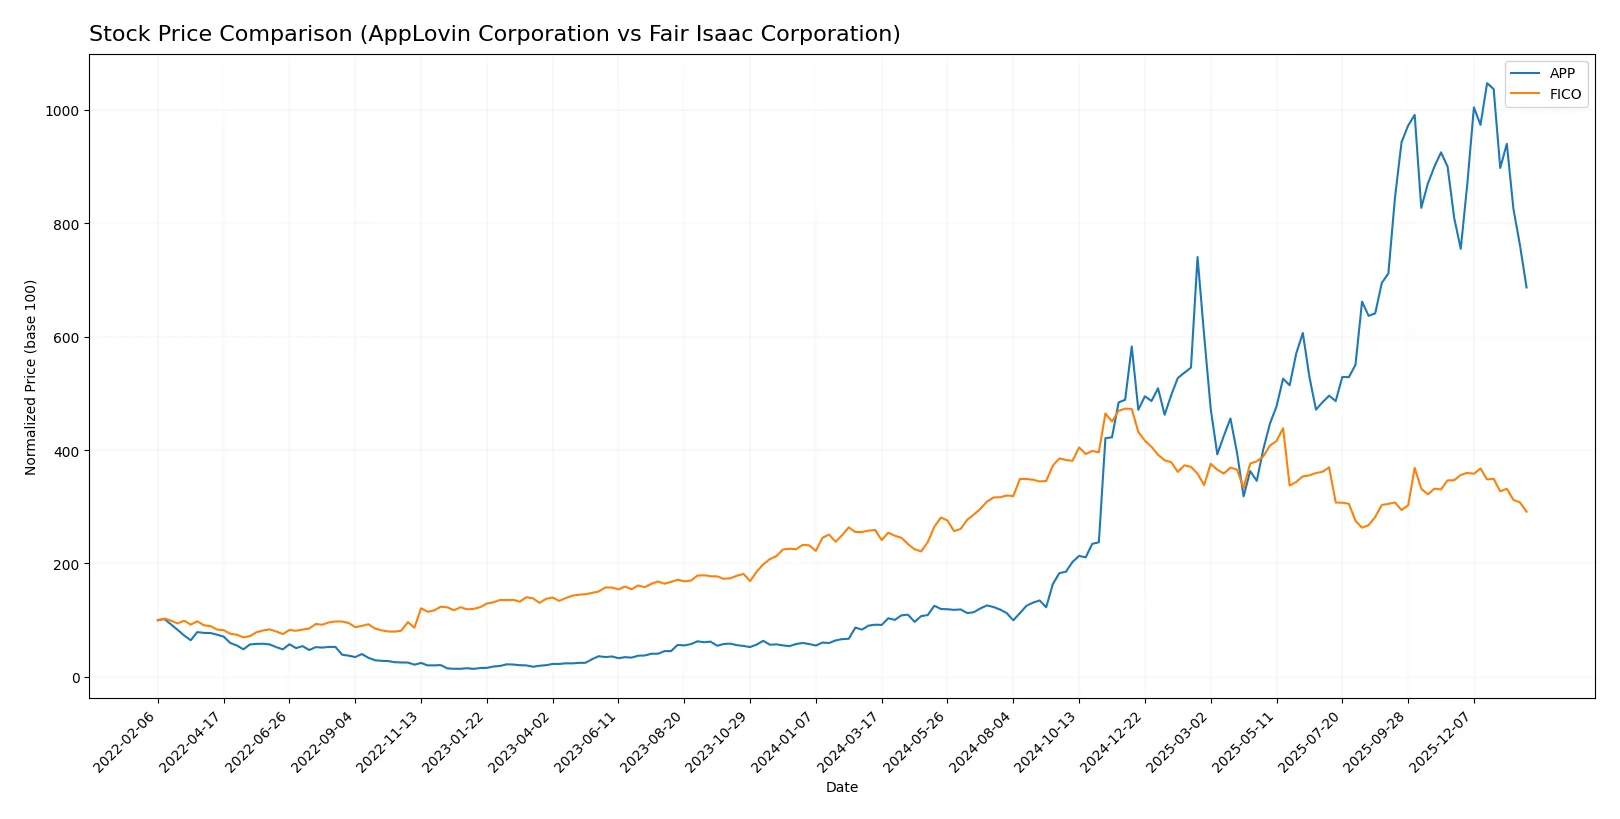
Trend Comparison
AppLovin’s stock surged 645.99% over the past 12 months, marking a bullish trend with decelerating momentum. The price ranged widely from 63.13 to 721.37, indicating high volatility.
Fair Isaac’s stock rose 12.51% over the last year, also bullish but with deceleration. Its price spanned 1110.85 to 2375.03, showing greater absolute price levels but moderate gains.
Comparing both, AppLovin delivered the highest market performance, significantly outpacing Fair Isaac despite recent downward pressure in the last quarter.
Target Prices
Analysts show a bullish consensus for both AppLovin Corporation and Fair Isaac Corporation, indicating upside potential.
| Company | Target Low | Target High | Consensus |
|---|---|---|---|
| AppLovin Corporation | 630 | 860 | 752 |
| Fair Isaac Corporation | 1640 | 2400 | 2115 |
AppLovin’s consensus target price of 752 implies a 59% upside from its current 473. Fair Isaac’s 2115 consensus suggests a 45% gain from its 1463 share price. Both stocks reflect strong analyst confidence above current market levels.

Don’t Let Luck Decide Your Entry Point
Optimize your entry points with our advanced ProRealTime indicators. You’ll get efficient buy signals with precise price targets for maximum performance. Start outperforming now!
How do institutions grade them?
AppLovin Corporation Grades
The following table summarizes recent grade actions by reputable analysts for AppLovin Corporation:
| Grading Company | Action | New Grade | Date |
|---|---|---|---|
| Needham | Upgrade | Buy | 2026-01-26 |
| Morgan Stanley | Maintain | Overweight | 2026-01-13 |
| Wells Fargo | Maintain | Overweight | 2026-01-08 |
| Benchmark | Maintain | Buy | 2025-12-11 |
| Jefferies | Maintain | Buy | 2025-12-11 |
| Citigroup | Maintain | Buy | 2025-11-12 |
| Goldman Sachs | Maintain | Neutral | 2025-11-07 |
| Wells Fargo | Maintain | Overweight | 2025-11-07 |
| Piper Sandler | Maintain | Overweight | 2025-11-06 |
| UBS | Maintain | Buy | 2025-11-06 |
Fair Isaac Corporation Grades
The following table summarizes recent grade actions by reputable analysts for Fair Isaac Corporation:
| Grading Company | Action | New Grade | Date |
|---|---|---|---|
| Needham | Maintain | Buy | 2026-01-29 |
| Jefferies | Maintain | Buy | 2026-01-16 |
| Wells Fargo | Maintain | Overweight | 2026-01-14 |
| JP Morgan | Maintain | Neutral | 2025-11-06 |
| BMO Capital | Maintain | Outperform | 2025-11-06 |
| Jefferies | Maintain | Buy | 2025-11-06 |
| Baird | Maintain | Outperform | 2025-11-06 |
| Wells Fargo | Maintain | Overweight | 2025-10-14 |
| Needham | Maintain | Buy | 2025-10-02 |
| Barclays | Maintain | Overweight | 2025-10-02 |
Which company has the best grades?
Both companies hold strong institutional support with multiple Buy and Overweight ratings. AppLovin shows a recent upgrade to Buy by Needham. Fair Isaac has consistent Buy and Outperform ratings from several firms. Investors may interpret these solid grades as confidence in both companies’ outlooks.
Risks specific to each company
The following categories identify the critical pressure points and systemic threats facing both firms in the 2026 market environment:
1. Market & Competition
AppLovin Corporation
- Faces intense competition in mobile app marketing software, with rapid innovation cycles demanding constant adaptation.
Fair Isaac Corporation
- Operates in analytics and decision software, facing competition from AI-driven disruptors and evolving fintech demands.
2. Capital Structure & Debt
AppLovin Corporation
- High debt-to-equity ratio (3.26) and 60.6% debt-to-assets signal elevated financial leverage and risk.
Fair Isaac Corporation
- Debt-to-equity negative but debt-to-assets very high (164.6%), indicating complex capital structure and risk of over-leverage.
3. Stock Volatility
AppLovin Corporation
- Beta at 2.5 signals high stock price volatility, increasing investment risk and market sensitivity.
Fair Isaac Corporation
- Beta at 1.29 reflects moderate volatility, more stable in turbulent markets.
4. Regulatory & Legal
AppLovin Corporation
- Subject to data privacy laws impacting marketing software, with potential fines for non-compliance.
Fair Isaac Corporation
- Faces stringent regulatory scrutiny in credit scoring, fraud detection, and financial compliance sectors worldwide.
5. Supply Chain & Operations
AppLovin Corporation
- Relies on digital infrastructure and third-party app ecosystems, vulnerable to platform policy changes.
Fair Isaac Corporation
- Operations depend on data integrity and software deployment; risks arise from cyber threats and tech disruptions.
6. ESG & Climate Transition
AppLovin Corporation
- ESG risk moderate; pressure to improve data privacy and reduce carbon footprint in tech operations.
Fair Isaac Corporation
- ESG challenges include responsible AI use and compliance with increasing sustainability regulations in financial services.
7. Geopolitical Exposure
AppLovin Corporation
- International business exposes it to cross-border regulatory shifts and trade tensions impacting digital advertising.
Fair Isaac Corporation
- Global presence in scoring and analytics exposes it to geopolitical risks, especially in EMEA and APAC regions.
Which company shows a better risk-adjusted profile?
AppLovin’s highest risk stems from its heavy leverage and stock volatility. Fair Isaac’s greatest threat lies in its complex debt structure and regulatory demands. Between them, Fair Isaac manages moderate volatility and scores better on financial stability metrics. This suggests Fair Isaac offers a marginally better risk-adjusted profile, despite some capital structure concerns. Notably, AppLovin’s beta of 2.5 versus Fair Isaac’s 1.29 highlights AppLovin’s heightened market sensitivity, justifying investor caution.
Final Verdict: Which stock to choose?
AppLovin’s superpower lies in its unmatched growth engine, fueled by rapidly expanding profitability and a rock-solid return on invested capital. Its point of vigilance is its high leverage, which could pressure financial flexibility. This stock suits aggressive growth portfolios seeking dynamic tech exposure.
Fair Isaac commands a strategic moat through its entrenched analytics platform and recurring revenue stream, providing consistent cash flow and durability. It carries a more conservative risk profile than AppLovin, fitting well into GARP portfolios balancing growth with reasonable stability.
If you prioritize high-growth momentum and can tolerate leverage risk, AppLovin outshines with its explosive earnings expansion and value creation. However, if you seek steadier cash flow and a durable competitive advantage with more financial safety, Fair Isaac offers better stability despite a slower pace.
Disclaimer: Investment carries a risk of loss of initial capital. The past performance is not a reliable indicator of future results. Be sure to understand risks before making an investment decision.
Go Further
I encourage you to read the complete analyses of AppLovin Corporation and Fair Isaac Corporation to enhance your investment decisions: