In the rapidly evolving software application industry, AppLovin Corporation and Elastic N.V. stand out as innovative leaders with distinct approaches. AppLovin excels in mobile app marketing and monetization, while Elastic focuses on advanced search and data analytics solutions for multi-cloud environments. Both companies compete for investor attention due to their strong market presence and growth potential. In this article, I will help you determine which company offers the most compelling investment opportunity.
Table of contents
Companies Overview
I will begin the comparison between AppLovin Corporation and Elastic N.V. by providing an overview of these two companies and their main differences.
AppLovin Corporation Overview
AppLovin Corporation focuses on building a software-based platform that helps mobile app developers improve marketing and monetization globally. Its solutions include AppDiscovery for marketing, Adjust for analytics, and MAX for in-app advertising auctions. Founded in 2011 and headquartered in Palo Alto, California, AppLovin operates within the Software – Application industry and serves advertisers, publishers, and internet platforms.
Elastic N.V. Overview
Elastic N.V. delivers technology solutions tailored for multi-cloud environments, centered on its Elastic Stack software products. These include Elasticsearch for search and analytics, Kibana for data visualization, Beats for data shipping, and Logstash for data processing. Incorporated in 2012 and based in Mountain View, California, Elastic targets a broad range of use cases in search, logging, metrics, and application monitoring within the Software – Application sector.
Key similarities and differences
Both AppLovin and Elastic operate in the Software – Application industry and provide technology solutions that support data processing and analytics. However, AppLovin emphasizes mobile app marketing and monetization platforms, while Elastic specializes in search, data ingestion, and multi-cloud software stacks. Their business models differ in focus: AppLovin connects advertisers with publishers via auctions, whereas Elastic offers a suite of tools for data search, visualization, and management.
Income Statement Comparison
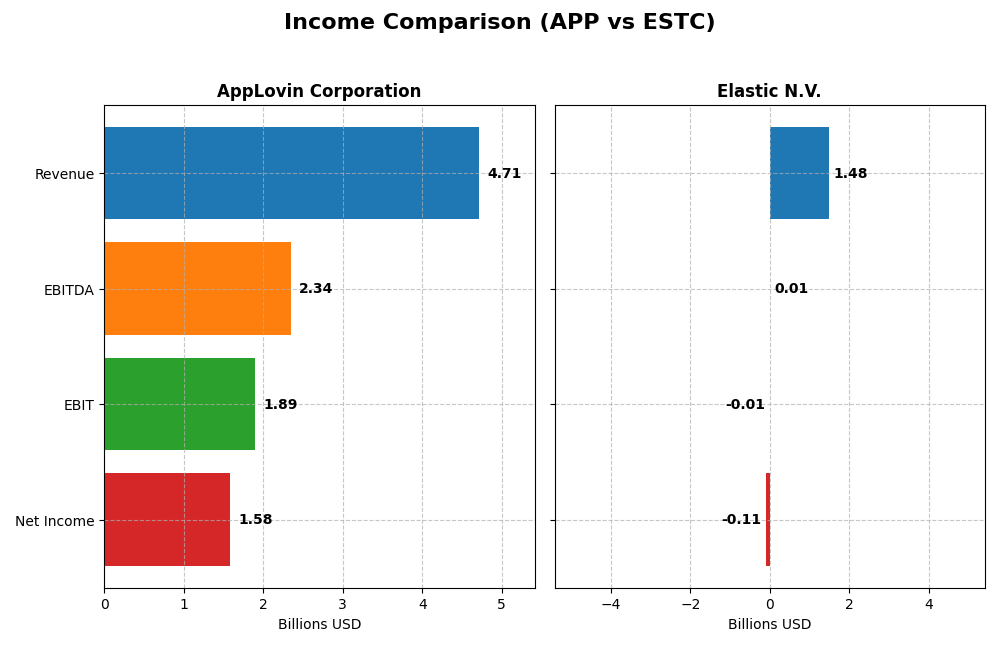
The table below summarizes the key income statement metrics for AppLovin Corporation and Elastic N.V. for their most recent fiscal years, providing a direct financial comparison.
| Metric | AppLovin Corporation (APP) | Elastic N.V. (ESTC) |
|---|---|---|
| Market Cap | 193B | 7.6B |
| Revenue | 4.71B | 1.48B |
| EBITDA | 2.34B | 6.1M |
| EBIT | 1.89B | -6.3M |
| Net Income | 1.58B | -108M |
| EPS | 4.68 | -1.04 |
| Fiscal Year | 2024 | 2025 |
Income Statement Interpretations
AppLovin Corporation
AppLovin Corporation has demonstrated robust revenue growth from 2020 to 2024, surging from 1.45B to 4.71B USD. Net income reversed from losses in 2020 and 2022 to a strong 1.58B USD in 2024. Margins improved notably, with a 75.22% gross margin and 33.55% net margin in 2024. The latest year exhibited accelerated growth and margin expansion.
Elastic N.V.
Elastic N.V. showed steady revenue growth between 2021 and 2025, increasing to 1.48B USD. However, net income remained negative in 2025 at -108M USD despite some prior positive years. Gross margin remained favorable at 74.39%, but EBIT and net margins were negative in 2025. The latest year saw improved revenue but continued net losses and margin pressure.
Which one has the stronger fundamentals?
AppLovin’s fundamentals appear stronger with consistent revenue and net income growth, high and improving profitability margins, and favorable evaluations across nearly all income metrics. Elastic, while growing revenue, faces profitability challenges with negative EBIT and net margins in the latest year, reflecting higher risk and less stable earnings quality.
Financial Ratios Comparison
The table below presents the latest financial ratios for AppLovin Corporation and Elastic N.V., reflecting their fiscal year 2024 and the most recent quarter respectively.
| Ratios | AppLovin Corporation (APP) | Elastic N.V. (ESTC) |
|---|---|---|
| ROE | 144.96% | -11.66% |
| ROIC | 38.70% | -3.45% |
| P/E | 69.06 | -82.65 |
| P/B | 100.11 | 9.64 |
| Current Ratio | 2.19 | 1.92 |
| Quick Ratio | 2.19 | 1.92 |
| D/E | 3.26 | 0.64 |
| Debt-to-Assets | 60.59% | 22.95% |
| Interest Coverage | 5.89 | -2.17 |
| Asset Turnover | 0.80 | 0.57 |
| Fixed Asset Turnover | 23.71 | 51.28 |
| Payout ratio | 0 | 0 |
| Dividend yield | 0% | 0% |
Interpretation of the Ratios
AppLovin Corporation
AppLovin shows strong profitability with a net margin of 33.55%, ROE of 144.96%, and ROIC of 38.7%, indicating efficient capital use despite a high WACC of 15.45%. Liquidity ratios are favorable with a current ratio of 2.19, but leverage is elevated with a debt-to-equity of 3.26 and debt-to-assets at 60.59%. The company does not pay dividends, likely prioritizing reinvestment and growth.
Elastic N.V.
Elastic’s key profitability ratios are weak, with negative net margin (-7.29%), ROE (-11.66%), and ROIC (-3.45%), reflecting operational challenges. Liquidity appears solid with a current ratio of 1.92 and low debt-to-assets at 22.95%, but interest coverage is negative, signaling potential solvency issues. No dividends are paid, consistent with its reinvestment strategy during growth.
Which one has the best ratios?
AppLovin’s ratios are slightly favorable overall, showing strong profitability and liquidity despite high leverage and valuation multiples. Elastic presents a neutral profile with balanced liquidity and lower leverage but suffers from negative profitability and interest coverage. Based on these metrics alone, AppLovin demonstrates stronger financial performance while Elastic exhibits more caution in leverage.
Strategic Positioning
This section compares the strategic positioning of AppLovin Corporation and Elastic N.V., including market position, key segments, and exposure to technological disruption:
AppLovin Corporation
- Large market cap of $193B, operating in a competitive app marketing and monetization software space.
- Key segments include Advertising ($3.2B) and Apps ($1.5B), driven by mobile app marketing and monetization.
- Exposure to technological disruption through real-time ad auctions and app analytics platforms.
Elastic N.V.
- Smaller market cap of $7.6B, competing in the search and data analytics software industry.
- Key segments are Subscription ($1.4B) and Professional Services ($99M), focused on multi-cloud search solutions.
- Exposure via cloud-native Elastic Stack products for search, analysis, and data visualization across formats.
AppLovin Corporation vs Elastic N.V. Positioning
AppLovin shows a more concentrated focus on mobile app marketing and monetization, yielding a large revenue base mainly from advertising. Elastic’s approach is more diversified across subscription and services in cloud-based search technologies, with smaller scale but broader data use cases.
Which has the best competitive advantage?
AppLovin exhibits a very favorable moat with ROIC significantly above WACC and growing profitability, indicating a durable competitive advantage. Elastic shows slightly unfavorable moat status with ROIC below WACC but improving profitability, reflecting a weaker competitive position.
Stock Comparison
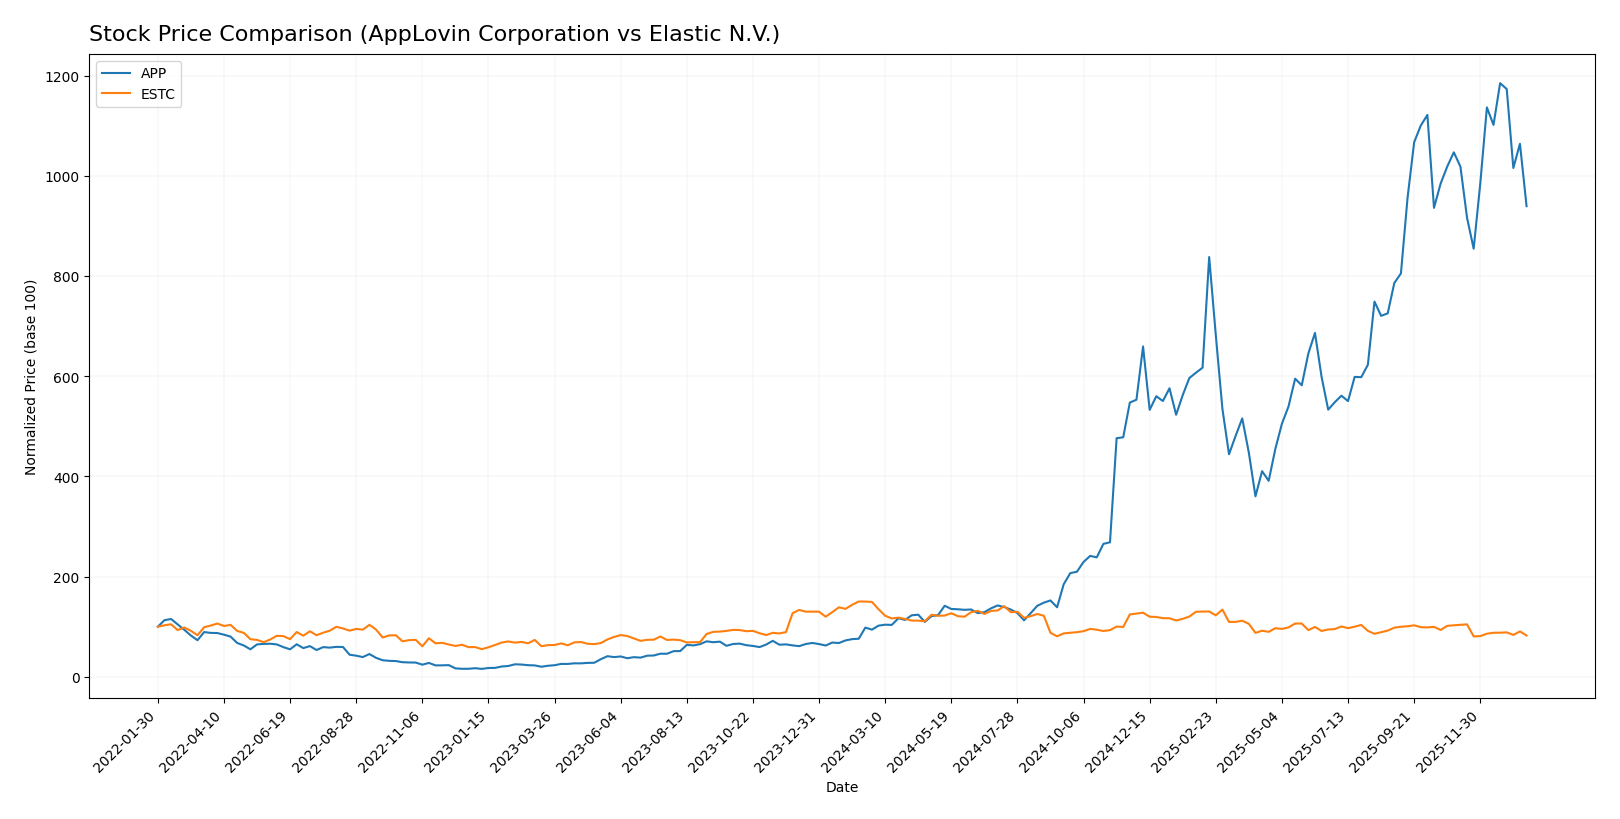
The stock price movements over the past year reveal a stark contrast in performance, with AppLovin Corporation showing a strong bullish trend despite recent deceleration, while Elastic N.V. experienced a sustained bearish trend with ongoing deceleration.
Trend Analysis
AppLovin Corporation’s stock exhibited a robust bullish trend over the past 12 months, rising 896.58%. However, this growth showed signs of deceleration. The stock price fluctuated widely, with a high volatility reflected in a 201.1 standard deviation.
Elastic N.V. displayed a bearish trend over the same period, losing 44.82% of its value, accompanied by deceleration. Its price range was narrower with lower volatility, indicated by a 14.08 standard deviation.
Comparing both stocks, AppLovin delivered the highest market performance with a substantial positive price change versus Elastic’s notable decline.
Target Prices
Analysts present a cautiously optimistic target consensus for AppLovin Corporation and Elastic N.V.
| Company | Target High | Target Low | Consensus |
|---|---|---|---|
| AppLovin Corporation | 860 | 630 | 756.33 |
| Elastic N.V. | 134 | 76 | 108 |
The consensus targets for AppLovin at 756.33 significantly exceed its current price of 570, indicating upside potential. Elastic’s consensus target of 108 also suggests a notable increase from its current price near 71.73.
Analyst Opinions Comparison
This section compares the analysts’ ratings and grades for AppLovin Corporation and Elastic N.V.:
Rating Comparison
APP Rating
- Rating: B, classified as Very Favorable.
- Discounted Cash Flow Score: 3, Moderate rating.
- ROE Score: 5, Very Favorable indicating strong profit generation.
- ROA Score: 5, Very Favorable showing efficient asset use.
- Debt To Equity Score: 1, Very Unfavorable indicating higher financial risk.
- Overall Score: 3, Moderate overall financial standing.
ESTC Rating
- Rating: C-, classified as Very Favorable.
- Discounted Cash Flow Score: 3, Moderate rating.
- ROE Score: 1, Very Unfavorable indicating weak profit generation.
- ROA Score: 1, Very Unfavorable showing poor asset use.
- Debt To Equity Score: 1, Very Unfavorable indicating higher financial risk.
- Overall Score: 1, Very Unfavorable overall financial standing.
Which one is the best rated?
Based on the data, AppLovin Corporation is better rated overall, with higher ROE and ROA scores and a superior overall score. Elastic N.V. shows weaker profitability and financial standing despite similar DCF and debt ratings.
Scores Comparison
Here is a comparison of the financial health scores for AppLovin Corporation and Elastic N.V.:
APP Scores
- Altman Z-Score: Very high at 30.7, indicating safe zone.
- Piotroski Score: Strong financial health with a score of 7.
ESTC Scores
- Altman Z-Score: Moderate at 3.51, indicating safe zone.
- Piotroski Score: Average financial health with a score of 4.
Which company has the best scores?
Based strictly on the provided data, APP has higher scores in both Altman Z-Score and Piotroski Score, indicating stronger financial stability and health compared to ESTC.
Grades Comparison
Here is a comparison of the latest reliable grades for AppLovin Corporation and Elastic N.V.:
AppLovin Corporation Grades
The following table summarizes recent grades assigned by reputable financial institutions for AppLovin Corporation:
| Grading Company | Action | New Grade | Date |
|---|---|---|---|
| Morgan Stanley | Maintain | Overweight | 2026-01-13 |
| Wells Fargo | Maintain | Overweight | 2026-01-08 |
| Jefferies | Maintain | Buy | 2025-12-11 |
| Benchmark | Maintain | Buy | 2025-12-11 |
| Citigroup | Maintain | Buy | 2025-11-12 |
| Wells Fargo | Maintain | Overweight | 2025-11-07 |
| Goldman Sachs | Maintain | Neutral | 2025-11-07 |
| JP Morgan | Maintain | Neutral | 2025-11-06 |
| Wedbush | Maintain | Outperform | 2025-11-06 |
| Piper Sandler | Maintain | Overweight | 2025-11-06 |
Overall, AppLovin’s grades predominantly reflect positive ratings, with several buy and overweight recommendations, and no downward revisions.
Elastic N.V. Grades
The table below shows recent grades provided by recognized financial firms for Elastic N.V.:
| Grading Company | Action | New Grade | Date |
|---|---|---|---|
| Barclays | Maintain | Overweight | 2026-01-12 |
| RBC Capital | Maintain | Outperform | 2026-01-05 |
| Jefferies | Maintain | Buy | 2026-01-05 |
| Citigroup | Maintain | Buy | 2025-11-24 |
| Wedbush | Maintain | Outperform | 2025-11-21 |
| B of A Securities | Maintain | Neutral | 2025-11-21 |
| Guggenheim | Maintain | Buy | 2025-11-21 |
| Wells Fargo | Maintain | Equal Weight | 2025-11-21 |
| RBC Capital | Maintain | Outperform | 2025-11-21 |
| Canaccord Genuity | Maintain | Buy | 2025-11-21 |
Elastic’s grades show a solid pattern of buy and outperform recommendations, with some neutral and equal weight ratings, and no sell or downgrade actions.
Which company has the best grades?
Both companies exhibit predominantly positive grades with consensus “Buy” ratings. Elastic N.V. has a slightly broader range of outperform and buy ratings, while AppLovin shows multiple overweight and buy grades. Investors may interpret Elastic’s slightly more frequent outperform ratings as a marginally stronger endorsement, potentially influencing portfolio weighting decisions.
Strengths and Weaknesses
Below is a comparison table highlighting the key strengths and weaknesses of AppLovin Corporation (APP) and Elastic N.V. (ESTC) based on their recent financial performance, market position, and operational metrics.
| Criterion | AppLovin Corporation (APP) | Elastic N.V. (ESTC) |
|---|---|---|
| Diversification | Strong diversification with significant revenue from Advertising (3.22B) and Apps (1.49B) segments | Moderate diversification focused mainly on Subscription (1.38B) and Professional Services (98.8M) |
| Profitability | High profitability: Net margin 33.55%, ROIC 38.7%, ROE 144.96% | Negative profitability: Net margin -7.29%, ROIC -3.45%, ROE -11.66% |
| Innovation | Very favorable economic moat with growing ROIC (+1173%), showing durable competitive advantage | Slightly unfavorable moat, shedding value but improving profitability (ROIC trend +85.8%) |
| Global presence | Established global player with strong asset turnover (0.8) and excellent fixed asset turnover (23.71) | Growing presence, supported by strong fixed asset turnover (51.28), but weaker asset turnover (0.57) |
| Market Share | High market presence in mobile advertising and app ecosystems | Focused market niche in search and analytics with growing subscription base |
Key takeaway: AppLovin demonstrates a robust financial position with a strong, durable competitive advantage and broad revenue diversification. Elastic, although currently less profitable, shows improving trends and potential for growth in its subscription business, warranting cautious monitoring.
Risk Analysis
Below is a comparative risk assessment of AppLovin Corporation (APP) and Elastic N.V. (ESTC) based on the latest available data for 2025-2026.
| Metric | AppLovin Corporation (APP) | Elastic N.V. (ESTC) |
|---|---|---|
| Market Risk | High beta (2.5), volatile price range | Moderate beta (0.93), less volatile |
| Debt level | High debt-to-equity (3.26), 60.6% debt to assets | Moderate debt-to-equity (0.64), 23% debt to assets |
| Regulatory Risk | Moderate, US tech regulations | Moderate, US and EU regulations impact |
| Operational Risk | Moderate, reliant on mobile ad market | Moderate, dependent on cloud infrastructure stability |
| Environmental Risk | Low, primarily software-based | Low, primarily software-based |
| Geopolitical Risk | Moderate, US focus with some international exposure | Moderate, US and EU exposure |
The most impactful risks are AppLovin’s high leverage and market volatility, increasing financial risk despite strong profitability. Elastic shows better debt management but struggles with profitability, heightening operational and market risks. Both face similar regulatory and geopolitical challenges typical of US-based tech firms. Caution is advised given APP’s high financial leverage and ESTC’s current profitability issues.
Which Stock to Choose?
AppLovin Corporation (APP) shows a strong income evolution with favorable revenue and margin growth, excellent profitability, and solid financial ratios, including high ROE and ROIC. However, it carries significant debt, reflected in an unfavorable debt-to-equity ratio, while maintaining a very favorable overall rating.
Elastic N.V. (ESTC) presents moderate income growth with mixed profitability—negative net and EBIT margins—and a neutral financial ratios profile. The company’s debt levels are low and manageable, but key profitability ratios are unfavorable, and its overall rating remains very favorable despite some financial challenges.
Investors focused on growth and profitability may find APP’s robust income and strong moat status more appealing, while those with a preference for lower debt exposure and moderate financial risk might see ESTC’s profile as more suitable. The choice could depend on the investor’s risk tolerance and strategic priorities.
Disclaimer: Investment carries a risk of loss of initial capital. The past performance is not a reliable indicator of future results. Be sure to understand risks before making an investment decision.
Go Further
I encourage you to read the complete analyses of AppLovin Corporation and Elastic N.V. to enhance your investment decisions: