Home > Comparison > Technology > APP vs DDOG
The strategic rivalry between AppLovin Corporation and Datadog, Inc. shapes the evolution of the technology software application sector. AppLovin operates a mobile app marketing and monetization platform, emphasizing real-time ad auctions and analytics. Datadog delivers a comprehensive cloud monitoring and analytics SaaS platform, focusing on infrastructure and security observability. This analysis evaluates which firm’s operational model offers superior risk-adjusted returns for a diversified portfolio amid sector innovation and growth dynamics.
Table of contents
Companies Overview
AppLovin Corporation and Datadog, Inc. stand as pivotal players in the software application market with distinct strategic aims.
AppLovin Corporation: Mobile Marketing Innovator
AppLovin dominates the mobile app marketing space by providing a software platform that enhances app monetization through advanced tools like AppDiscovery and MAX. Its core revenue emerges from matching advertiser demand with publisher supply via real-time auctions. In 2026, it focuses on optimizing in-app advertising efficiency and expanding its global footprint.
Datadog, Inc.: Cloud Monitoring Leader
Datadog commands the cloud monitoring sector with a SaaS analytics platform that integrates infrastructure, application, and security monitoring. Its revenue derives from subscription-based services delivering real-time observability across tech stacks. In 2026, it prioritizes deepening cloud security capabilities and broadening developer-focused observability solutions.
Strategic Collision: Similarities & Divergences
Both operate in software applications but target different user needs: AppLovin emphasizes mobile advertising ecosystems, while Datadog centers on cloud infrastructure monitoring. Their primary battleground lies in capturing software service budgets across digital enterprises. AppLovin offers a dynamic ad-tech investment profile, whereas Datadog presents a stable growth story rooted in critical IT operations software.
Income Statement Comparison
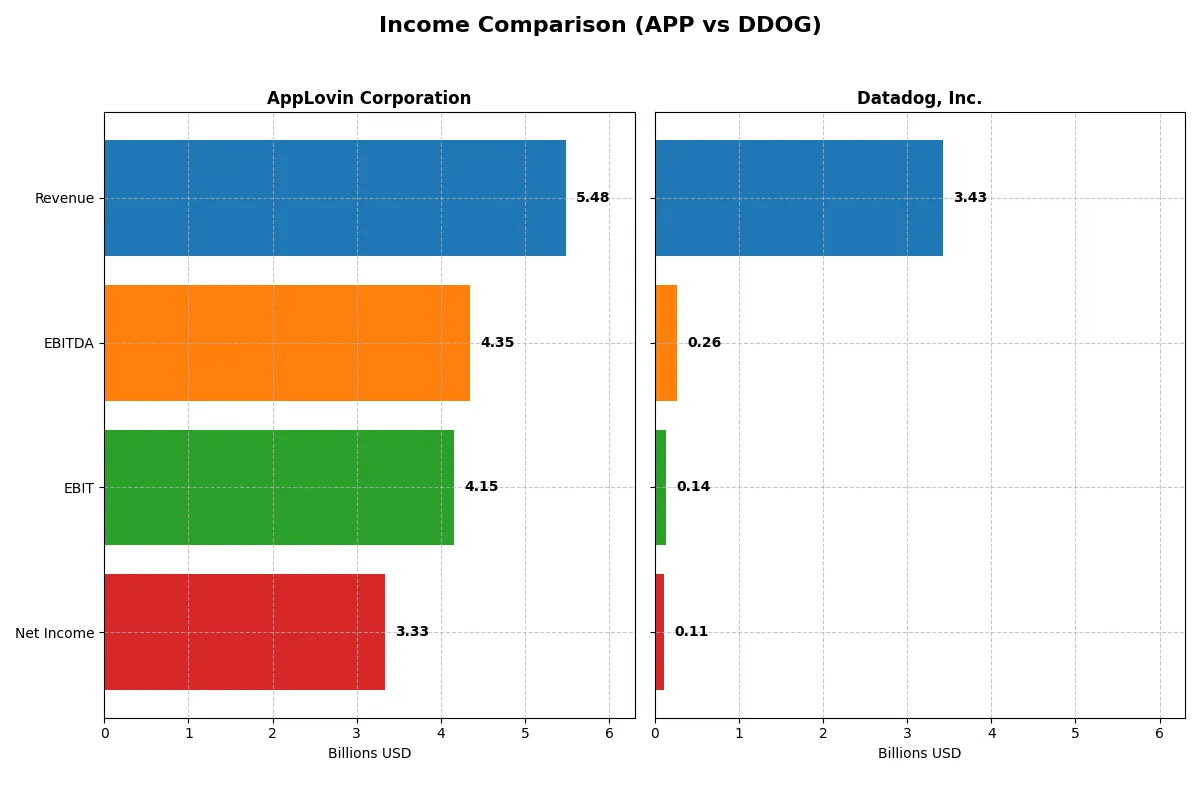
This data dissects the core profitability and scalability of both corporate engines to reveal who dominates the bottom line:
| Metric | AppLovin (APP) | Datadog (DDOG) |
|---|---|---|
| Revenue | 5.48B | 3.43B |
| Cost of Revenue | 665.1M | 687.0M |
| Operating Expenses | 663.7M | 2.78B |
| Gross Profit | 4.82B | 2.74B |
| EBITDA | 4.35B | 261.0M |
| EBIT | 4.15B | 138.1M |
| Interest Expense | 207.0M | 11.1M |
| Net Income | 3.33B | 107.7M |
| EPS | 9.84 | 0.31 |
| Fiscal Year | 2025 | 2025 |
Income Statement Analysis: The Bottom-Line Duel
This income statement comparison reveals which company runs a more efficient and profitable corporate engine in the current market landscape.
AppLovin Corporation Analysis
AppLovin’s revenue nearly doubled from 2021 to 2025, hitting 5.48B in 2025 with net income surging to 3.33B. Its gross margin stands impressively at 87.9%, while net margin reaches 60.8%, both signaling robust profitability. The 2025 EBIT margin of 75.8% highlights exceptional operational efficiency and strong momentum.
Datadog, Inc. Analysis
Datadog’s revenue grew steadily to 3.43B in 2025, with net income at 108M. Gross margin remains healthy at 80%, but net margin lags at 3.1%, reflecting pressure on profitability. EBIT margin is modest at 4.0%, and recent declines in EBIT and net margin growth suggest efficiency challenges despite solid top-line expansion.
Margin Excellence vs. Revenue Growth
AppLovin dominates with superior margins and explosive net income growth, outperforming Datadog’s scale and revenue growth speed. For investors prioritizing profitability and operational leverage, AppLovin’s profile offers a clearer fundamental edge. Datadog’s growth story demands caution given its margin compression and profitability pressures.
Financial Ratios Comparison
These vital ratios act as a diagnostic tool to expose the underlying fiscal health, valuation premiums, and capital efficiency for AppLovin Corporation (APP) and Datadog, Inc. (DDOG):
| Ratios | AppLovin (APP) | Datadog (DDOG) |
|---|---|---|
| ROE | 156.2% | 2.89% |
| ROIC | 60.7% | -0.74% |
| P/E | 68.5 | 438.4 |
| P/B | 106.9 | 12.7 |
| Current Ratio | 3.32 | 3.38 |
| Quick Ratio | 3.32 | 3.38 |
| D/E (Debt to Equity) | 1.66 | 0.41 |
| Debt-to-Assets | 48.8% | 23.1% |
| Interest Coverage | 20.1 | -4.01 |
| Asset Turnover | 0.75 | 0.52 |
| Fixed Asset Turnover | 37.1 | 6.20 |
| Payout ratio | 0 | 0 |
| Dividend yield | 0% | 0% |
| Fiscal Year | 2025 | 2025 |
Efficiency & Valuation Duel: The Vital Signs
Ratios serve as a company’s financial DNA, uncovering hidden risks and signaling operational strength or weakness in portfolio analysis.
AppLovin Corporation
AppLovin delivers outstanding profitability with a 156% ROE and a net margin above 60%, demonstrating operational efficiency. However, its valuation multiples are stretched, with a P/E of 68.5 and a P/B over 100. The company pays no dividend, opting to reinvest heavily in R&D and growth, which supports future expansion but raises valuation risk.
Datadog, Inc.
Datadog posts weak profitability metrics: a 2.9% ROE and a slim 3.1% net margin, indicating operational challenges. Its P/E ratio of 438 signals an expensive stock, compounded by a moderate P/B of 12.7. Like AppLovin, it forgoes dividends, focusing on aggressive R&D investment, though its lower debt level offers some financial stability.
Premium Valuation vs. Operational Safety
AppLovin balances extraordinary profitability with stretched valuation, while Datadog struggles with profitability but maintains moderate leverage. AppLovin suits investors seeking growth backed by earnings; Datadog fits those tolerant of high valuation risk and focused on innovation potential.
Which one offers the Superior Shareholder Reward?
AppLovin (APP) and Datadog (DDOG) both forgo dividends, emphasizing reinvestment and buybacks. APP delivers a robust free cash flow per share of 11.7 versus DDOG’s 2.9 in 2025, fueling aggressive buybacks. APP’s payout ratio is zero, preserving capital for growth and debt reduction. DDOG also invests heavily in growth, but with weaker margins and higher valuation multiples. APP’s sustainable distribution model, supported by strong cash flow and prudent leverage, offers a more attractive total return profile in 2026.
Comparative Score Analysis: The Strategic Profile
The radar chart reveals the fundamental DNA and trade-offs of AppLovin Corporation and Datadog, Inc., highlighting their strategic financial strengths and vulnerabilities:
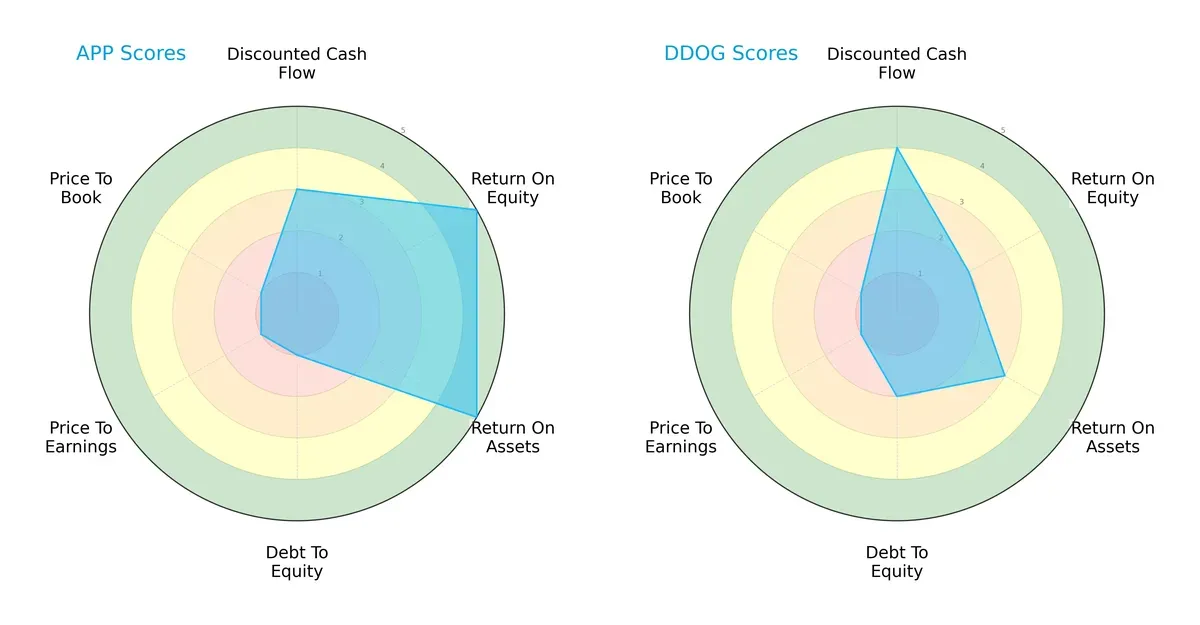
AppLovin excels in profitability metrics with top ROE and ROA scores (5 each), signaling strong operational efficiency. Datadog shows a higher DCF score (4 vs. 3), suggesting better future cash flow prospects. However, both firms suffer from poor valuation scores (P/E and P/B at 1). AppLovin’s balance sheet is riskier, reflected in a weaker debt-to-equity score (1 vs. 2). Overall, AppLovin relies on profitability dominance, while Datadog presents a more balanced but moderate financial profile.
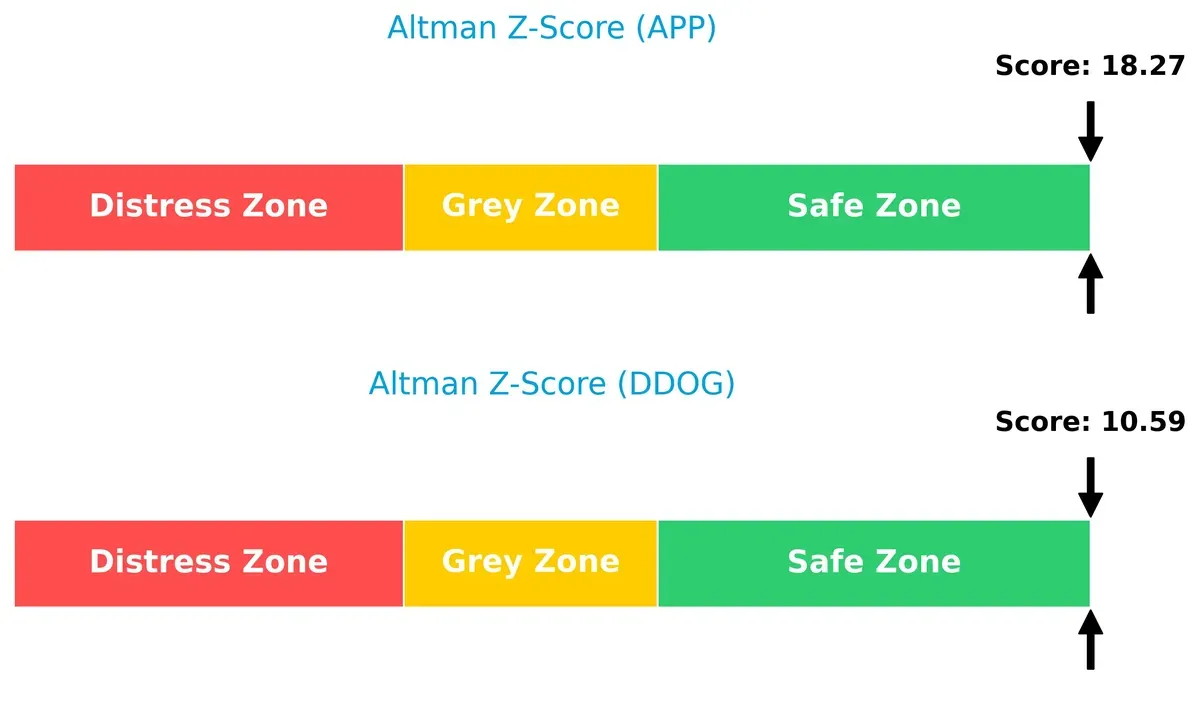
Bankruptcy Risk: Solvency Showdown
The Altman Z-Score gap confirms both companies are comfortably in the safe zone, with AppLovin at 18.3 and Datadog at 10.6, implying robust long-term survival prospects in this cycle:
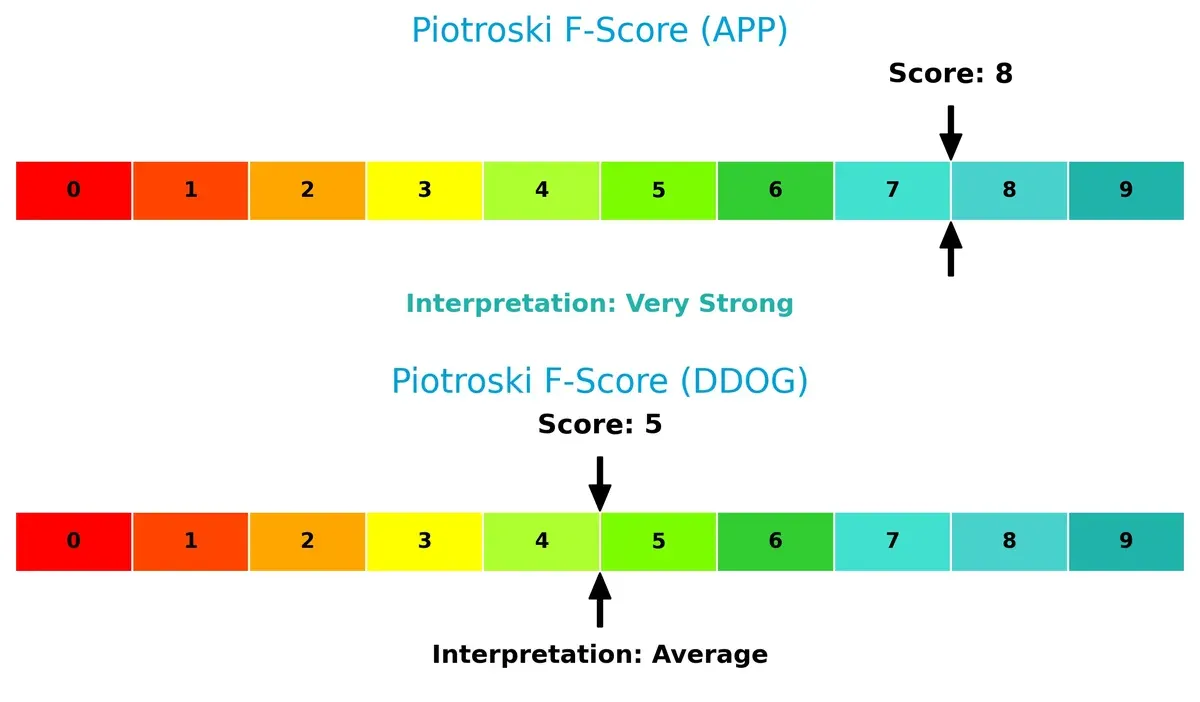
Financial Health: Quality of Operations
AppLovin’s Piotroski F-Score of 8 indicates very strong financial health, outperforming Datadog’s average score of 5. This gap points to AppLovin’s superior internal operational quality and fewer red flags:
How are the two companies positioned?
This section dissects APP and DDOG’s operational DNA by comparing their revenue breakdown and internal strengths and weaknesses. The goal is to confront their economic moats and identify which model delivers the most resilient competitive advantage today.
Revenue Segmentation: The Strategic Mix
This visual comparison dissects how AppLovin Corporation and Datadog, Inc. diversify their income streams and where their primary sector bets lie:
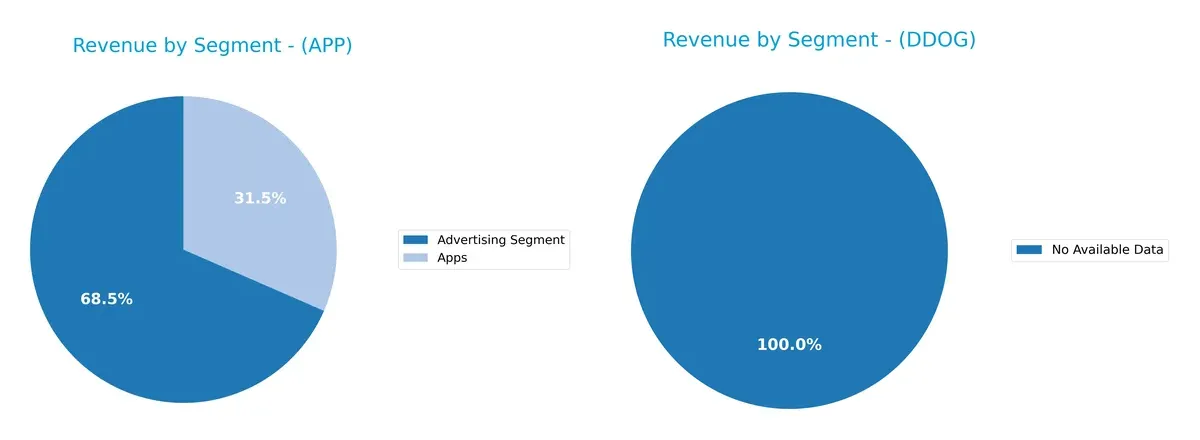
AppLovin anchors its revenue in two main segments: Advertising at $3.22B and Apps at $1.49B for 2024, showing a moderately diversified model. Datadog lacks available segmentation data, preventing a direct comparison. AppLovin’s heavy reliance on advertising reveals concentration risk but also signals strong ecosystem lock-in through ad monetization, while the apps segment supports platform growth. Without Datadog’s data, AppLovin’s approach stands out for its clear dual-segment focus.
Strengths and Weaknesses Comparison
This table compares the strengths and weaknesses of AppLovin Corporation and Datadog, Inc.:
AppLovin Corporation Strengths
- High net margin at 60.83%
- Exceptional ROE of 156.17%
- Strong ROIC at 60.71%
- Favorable quick ratio of 3.32
- Large US and international revenue base exceeding 4.7B total in 2024
- Diverse product segments including Advertising and Apps
Datadog, Inc. Strengths
- Favorable debt to equity ratio at 0.41
- Low debt to assets at 23.11%
- Positive interest coverage at 12.49
- Favorable quick ratio of 3.38
- Growing international revenue reaching 810M in 2024
- Solid fixed asset turnover at 6.2
AppLovin Corporation Weaknesses
- High WACC at 15.1% compared to ROIC
- Overvalued PE of 68.47 and PB of 106.94
- Elevated debt to equity at 1.66
- Unfavorable current ratio despite strong quick ratio
- No dividend yield
- Market concentration in US and Rest of World segments
Datadog, Inc. Weaknesses
- Low profitability with net margin at 3.14% and negative ROIC
- Very high PE at 438.37 and unfavorable PB at 12.65
- Unfavorable current ratio despite quick ratio strength
- No dividend yield
- Heavy reliance on North America, limited product diversification
AppLovin shows robust profitability and operational efficiency but faces valuation and leverage concerns. Datadog exhibits solid balance sheet metrics but struggles with profitability and valuation. Both companies’ geographic and product diversity influence their strategic positioning.
The Moat Duel: Analyzing Competitive Defensibility
A structural moat is the only true shield protecting long-term profits from relentless competitive erosion. Let’s break down the battle of moats between:
AppLovin Corporation: Dominant Switching Costs Moat
AppLovin’s moat stems from high switching costs embedded in its mobile app marketing platform. This manifests in a stellar ROIC 45% above WACC and stable margins above 60%. In 2026, expansion in international markets and in-app bidding tech could deepen its moat.
Datadog, Inc.: Emerging Ecosystem Lock-in Moat
Datadog leverages a growing ecosystem of integrated cloud monitoring tools, contrasting AppLovin’s switching cost moat. Despite currently shedding value (ROIC below WACC), its ROIC trend is improving. New product suites and AI-driven analytics may bolster its competitive position.
Switching Costs vs. Ecosystem Expansion: Who Holds the Moat Edge?
AppLovin’s wider moat is clear, with high excess returns and margin dominance. Datadog’s moat is narrower but showing promise through growing ROIC and ecosystem integration. AppLovin remains better equipped to defend and expand market share in 2026.
Which stock offers better returns?
Over the past year, AppLovin Corporation surged with a strong overall gain despite recent weakness, while Datadog, Inc. showed marginal overall growth with a notable recent decline.
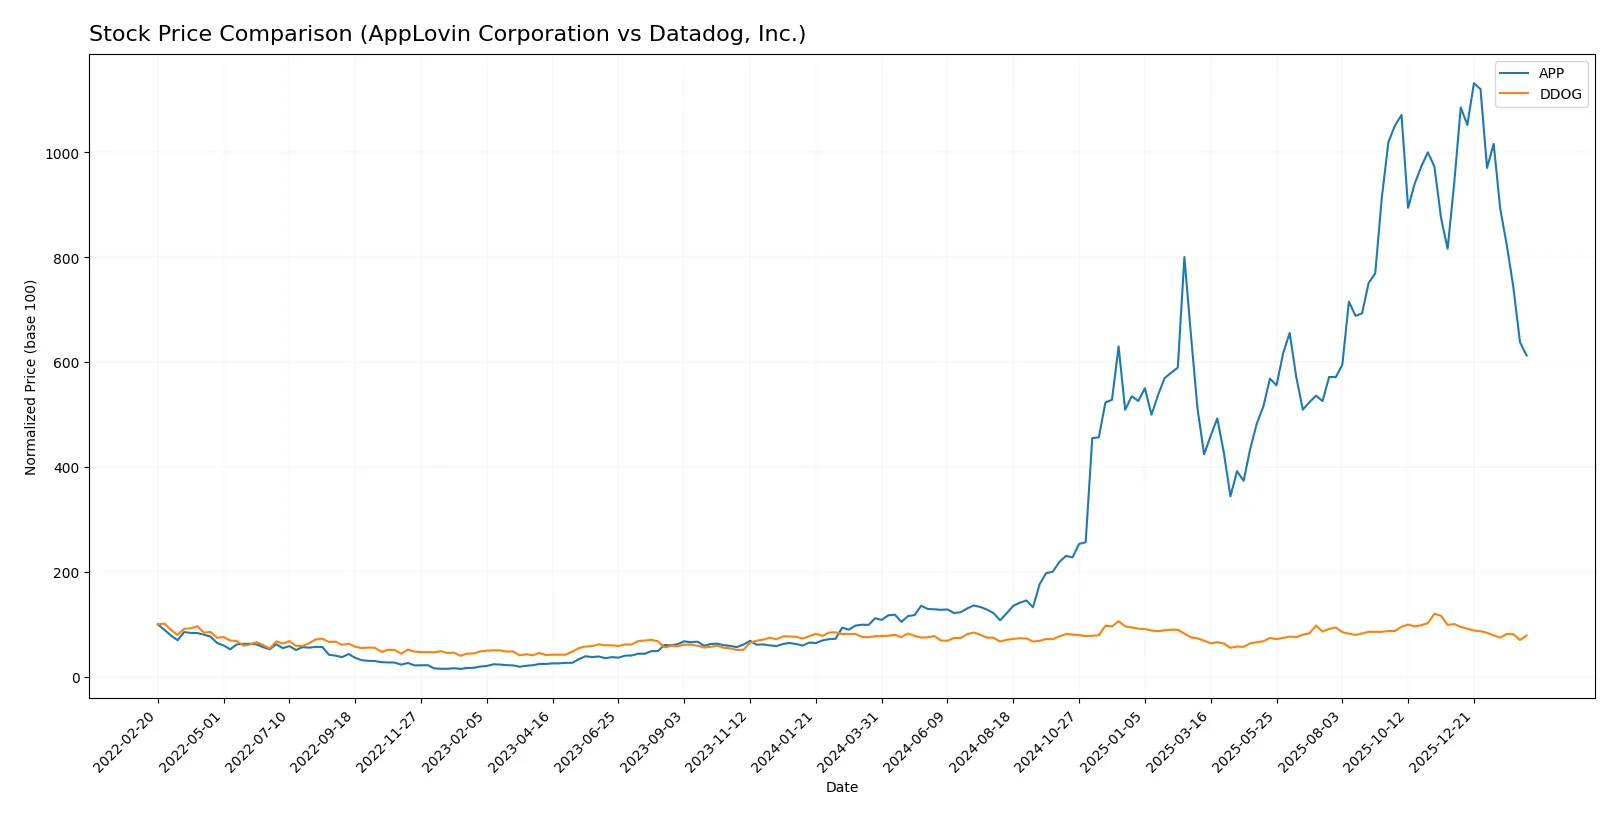
Trend Comparison
AppLovin’s stock gained 448.29% over the last 12 months, indicating a bullish trend with decelerating momentum and a high volatility of 196.68. The stock peaked at 721.37 and bottomed at 66.8.
Datadog’s stock rose 1.77% over the same period, reflecting a neutral overall trend with deceleration and much lower volatility at 18.68. It hit a high of 191.24 and a low of 87.93.
AppLovin outperformed Datadog significantly, delivering the highest market returns despite recent downward pressure experienced by both stocks.
Target Prices
Analysts show a positive target consensus for AppLovin Corporation and Datadog, Inc., indicating upside potential from current prices.
| Company | Target Low | Target High | Consensus |
|---|---|---|---|
| AppLovin Corporation | 543 | 835 | 690.93 |
| Datadog, Inc. | 105 | 215 | 175.07 |
Consensus targets exceed current prices significantly, reflecting analyst confidence in growth prospects. AppLovin’s consensus is 77% above its $390 price, while Datadog’s target is 40% higher than its $125 price.

Don’t Let Luck Decide Your Entry Point
Optimize your entry points with our advanced ProRealTime indicators. You’ll get efficient buy signals with precise price targets for maximum performance. Start outperforming now!
How do institutions grade them?
The following tables summarize institutional grades for AppLovin Corporation and Datadog, Inc.:
AppLovin Corporation Grades
Below are the latest grades from major grading companies for AppLovin Corporation.
| Grading Company | Action | New Grade | Date |
|---|---|---|---|
| Wells Fargo | Maintain | Overweight | 2026-02-12 |
| Citigroup | Maintain | Buy | 2026-02-12 |
| RBC Capital | Maintain | Outperform | 2026-02-12 |
| UBS | Maintain | Buy | 2026-02-12 |
| Wedbush | Maintain | Outperform | 2026-02-12 |
| Piper Sandler | Maintain | Overweight | 2026-02-12 |
| Jefferies | Maintain | Buy | 2026-02-12 |
| Scotiabank | Maintain | Sector Outperform | 2026-02-12 |
| BTIG | Maintain | Buy | 2026-02-12 |
| Goldman Sachs | Maintain | Neutral | 2026-02-12 |
Datadog, Inc. Grades
The table below lists recent institutional grades for Datadog, Inc.
| Grading Company | Action | New Grade | Date |
|---|---|---|---|
| DA Davidson | Maintain | Buy | 2026-02-11 |
| Macquarie | Maintain | Outperform | 2026-02-11 |
| Barclays | Maintain | Overweight | 2026-02-11 |
| Rosenblatt | Maintain | Buy | 2026-02-11 |
| Raymond James | Maintain | Outperform | 2026-02-11 |
| Scotiabank | Maintain | Sector Outperform | 2026-02-11 |
| RBC Capital | Maintain | Outperform | 2026-02-11 |
| Wedbush | Maintain | Outperform | 2026-02-11 |
| Citizens | Maintain | Market Perform | 2026-02-11 |
| BTIG | Maintain | Buy | 2026-02-10 |
Which company has the best grades?
Both companies maintain strong institutional support with mostly “Buy” and “Outperform” ratings. Datadog has a slight edge with more consistent “Outperform” calls. This could signal stronger investor confidence in Datadog’s near-term prospects.
Risks specific to each company
The following categories identify the critical pressure points and systemic threats facing both firms in the 2026 market environment:
1. Market & Competition
AppLovin Corporation
- Faces intense competition in mobile app marketing; must innovate to maintain growth.
Datadog, Inc.
- Competes in cloud monitoring; differentiation critical amid growing SaaS rivals.
2. Capital Structure & Debt
AppLovin Corporation
- High debt-to-equity ratio (1.66) increases financial risk despite strong interest coverage.
Datadog, Inc.
- Maintains conservative leverage (0.41 DE), reducing financial distress risk.
3. Stock Volatility
AppLovin Corporation
- Beta of 2.49 signals high price volatility; market swings strongly impact valuation.
Datadog, Inc.
- Lower beta at 1.29 indicates more stable stock behavior relative to the market.
4. Regulatory & Legal
AppLovin Corporation
- Subject to data privacy regulations impacting app marketing practices globally.
Datadog, Inc.
- Faces compliance challenges in cloud security and data monitoring regulations.
5. Supply Chain & Operations
AppLovin Corporation
- Relies on software platform scalability; operational efficiency crucial amid growth.
Datadog, Inc.
- Depends on cloud infrastructure; operational resilience key to service continuity.
6. ESG & Climate Transition
AppLovin Corporation
- Limited public ESG disclosures; potential reputational risks in sustainability focus.
Datadog, Inc.
- Increasing ESG focus in cloud operations; opportunity to lead in green IT solutions.
7. Geopolitical Exposure
AppLovin Corporation
- International operations expose it to trade tensions and data localization laws.
Datadog, Inc.
- Global cloud footprint faces risks from geopolitical conflicts and regulatory divergence.
Which company shows a better risk-adjusted profile?
AppLovin’s primary risk is its elevated financial leverage combined with high stock volatility, which raises capital structure concerns despite strong profitability metrics. Datadog’s most impactful risk is its low profitability and high valuation multiples, amplifying downside if growth slows. Overall, Datadog offers a more stable capital structure and lower volatility, but weaker earnings quality. AppLovin’s superior profitability and financial strength provide a better risk-adjusted profile, though investors must monitor its debt levels closely. The stark contrast in debt-to-equity ratios (1.66 vs. 0.41) underscores why leverage is my top concern for AppLovin in 2026.
Final Verdict: Which stock to choose?
AppLovin’s superpower lies in its unmatched ability to generate extraordinary returns on invested capital. It transforms every dollar into substantial profits, signaling a very favorable moat. A point of vigilance remains its high valuation multiples, which may pressure future upside. This stock suits an Aggressive Growth portfolio aiming to capitalize on strong momentum and profitability.
Datadog commands a strategic moat through its cloud monitoring dominance, backed by recurring revenue streams that provide revenue visibility. While its profitability metrics lag behind AppLovin’s, it offers a safer financial profile with lower leverage and steadier liquidity. Datadog fits well within a GARP (Growth at a Reasonable Price) portfolio, balancing growth potential and risk control.
If you prioritize high return efficiency and value creation, AppLovin emerges as the compelling choice due to its strong economic moat and explosive income growth. However, if you seek steadier financial footing and a defensible market position, Datadog offers better stability despite its current profitability challenges. Both companies present distinct analytical scenarios aligned with different investor risk appetites and time horizons.
Disclaimer: Investment carries a risk of loss of initial capital. The past performance is not a reliable indicator of future results. Be sure to understand risks before making an investment decision.
Go Further
I encourage you to read the complete analyses of AppLovin Corporation and Datadog, Inc. to enhance your investment decisions: