In the fast-evolving software industry, AppLovin Corporation and Cadence Design Systems, Inc. stand out with distinct yet overlapping market footprints. AppLovin excels in mobile app marketing and monetization platforms, while Cadence leads in advanced software and hardware solutions for integrated circuit design. Both companies drive innovation but target different tech niches, making their comparison crucial for investors seeking growth and stability. Let’s explore which company presents the most compelling investment opportunity.
Table of contents
Companies Overview
I will begin the comparison between AppLovin Corporation and Cadence Design Systems, Inc. by providing an overview of these two companies and their main differences.
AppLovin Corporation Overview
AppLovin Corporation focuses on building a software platform to help mobile app developers improve marketing and monetization. Its solutions include marketing software, analytics, and in-app bidding to optimize advertising inventory. Founded in 2011 and headquartered in Palo Alto, California, AppLovin serves clients globally in the mobile app ecosystem.
Cadence Design Systems, Inc. Overview
Cadence Design Systems, Inc. provides software, hardware, and services for integrated circuit (IC) design and verification. Its offerings cover functional verification, digital IC design, custom IC simulation, and system design across industries like 5G, automotive, and aerospace. Founded in 1987 and based in San Jose, California, Cadence operates worldwide with a broad technology portfolio.
Key similarities and differences
Both companies operate in the software application industry and serve the technology sector, yet their focus differs significantly. AppLovin targets mobile app marketing and monetization, while Cadence specializes in IC design and verification solutions. AppLovin has a smaller workforce and market cap compared to Cadence, reflecting their different market scopes and product offerings.
Income Statement Comparison
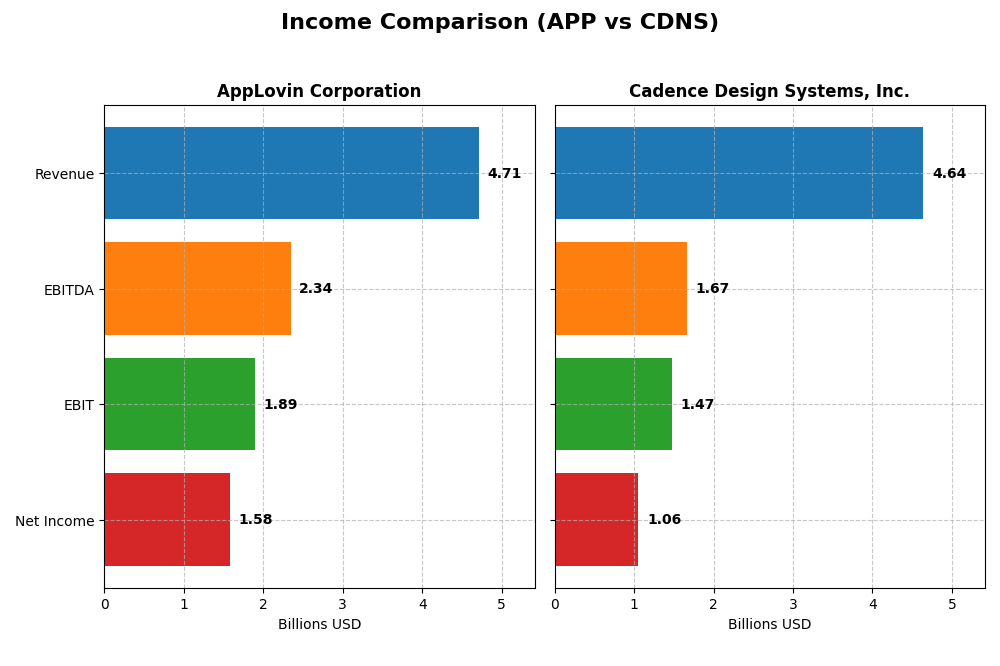
The following table presents a side-by-side comparison of the most recent fiscal year income statement metrics for AppLovin Corporation and Cadence Design Systems, Inc.
| Metric | AppLovin Corporation | Cadence Design Systems, Inc. |
|---|---|---|
| Market Cap | 194B | 86.5B |
| Revenue | 4.71B | 4.64B |
| EBITDA | 2.34B | 1.67B |
| EBIT | 1.89B | 1.47B |
| Net Income | 1.58B | 1.06B |
| EPS | 4.68 | 3.89 |
| Fiscal Year | 2024 | 2024 |
Income Statement Interpretations
AppLovin Corporation
AppLovin demonstrated strong revenue growth from 2020 to 2024, surging over 220% overall, with net income expanding even more sharply by approximately 1360%. Margins have improved significantly, with a gross margin of 75.22% and a net margin of 33.55% in 2024, both marked as favorable. The latest year saw a remarkable acceleration in profitability, with net income and EBIT margins expanding robustly, reflecting enhanced operational efficiency.
Cadence Design Systems, Inc.
Cadence showed steady revenue growth near 73% over the five-year span, accompanied by net income growth of nearly 79%. Gross margin remained high at 86.05% in 2024, with a solid EBIT margin of 31.71%. However, net margin growth in the most recent year was negative, signaling some pressure on profitability despite continued revenue expansion. Overall, margins and operating performance remain strong but showed some softness in recent net margin trends.
Which one has the stronger fundamentals?
AppLovin’s fundamentals appear stronger given its rapid and substantial growth in revenue, net income, and all key margins, including a significant rise in net margin and EPS in 2024. Cadence maintains high gross margins and steady growth but experienced a decline in net margin last year, which slightly tempers its strength. Both are favorable, yet AppLovin’s recent acceleration in profitability stands out.
Financial Ratios Comparison
The table below presents key financial ratios for AppLovin Corporation and Cadence Design Systems, Inc. based on their most recent fiscal year data as of 2024.
| Ratios | AppLovin Corporation (APP) | Cadence Design Systems, Inc. (CDNS) |
|---|---|---|
| ROE | 1.45 | 0.23 |
| ROIC | 0.39 | 0.13 |
| P/E | 69.1 | 77.2 |
| P/B | 100.1 | 17.4 |
| Current Ratio | 2.19 | 2.93 |
| Quick Ratio | 2.19 | 2.74 |
| D/E (Debt-to-Equity) | 3.26 | 0.55 |
| Debt-to-Assets | 0.61 | 0.29 |
| Interest Coverage | 5.89 | 17.77 |
| Asset Turnover | 0.80 | 0.52 |
| Fixed Asset Turnover | 23.71 | 7.68 |
| Payout ratio | 0 | 0 |
| Dividend yield | 0 | 0 |
Interpretation of the Ratios
AppLovin Corporation
AppLovin shows strong profitability with a net margin of 33.55% and an exceptionally high return on equity at 144.96%, signaling efficient capital use. However, concerns include a high debt-to-equity ratio of 3.26 and a debt-to-assets ratio of 60.59%, indicating significant leverage. The company does not pay dividends, likely prioritizing reinvestment and growth.
Cadence Design Systems, Inc.
Cadence presents a balanced financial profile with favorable net margin at 22.74% and solid returns on equity (22.58%) and invested capital (13.43%). It maintains a strong current ratio of 2.93 and low debt-to-assets at 28.8%, reflecting prudent leverage management. Cadence also does not distribute dividends, possibly focusing on R&D and acquisitions for growth.
Which one has the best ratios?
Cadence offers a more favorable overall ratio profile, with 57.14% favorable metrics compared to AppLovin’s 50%, and lower financial leverage. While AppLovin posts higher profitability ratios, its elevated debt levels and valuation multiples pose more risks. Cadence’s balanced leverage and coverage ratios present a relatively stronger and more stable financial position.
Strategic Positioning
This section compares the strategic positioning of AppLovin Corporation and Cadence Design Systems, Inc. regarding market position, key segments, and exposure to technological disruption:
AppLovin Corporation
- Larger market cap near 194B with higher beta, indicating more volatile competitive pressure.
- Focuses on mobile app marketing and monetization platforms, driven by advertising and app segments.
- Operates software-based platforms with real-time bidding and analytics, indicating moderate exposure to tech disruption.
Cadence Design Systems, Inc.
- Market cap around 87B with lower beta, suggesting steadier competitive dynamics.
- Concentrated on software, hardware, and services for IC design across multiple industries.
- Provides advanced IC design tools and verification platforms, exposed to ongoing semiconductor innovation.
AppLovin Corporation vs Cadence Design Systems, Inc. Positioning
AppLovin demonstrates a diversified approach with app marketing and monetization software, while Cadence concentrates on integrated circuit design solutions. AppLovin’s market is broader but more volatile, whereas Cadence serves specialized tech sectors with steady growth drivers.
Which has the best competitive advantage?
AppLovin holds a very favorable moat with strong value creation and growing ROIC, indicating durable competitive advantage. Cadence shows slightly favorable moat but faces declining profitability, suggesting a less robust competitive position.
Stock Comparison
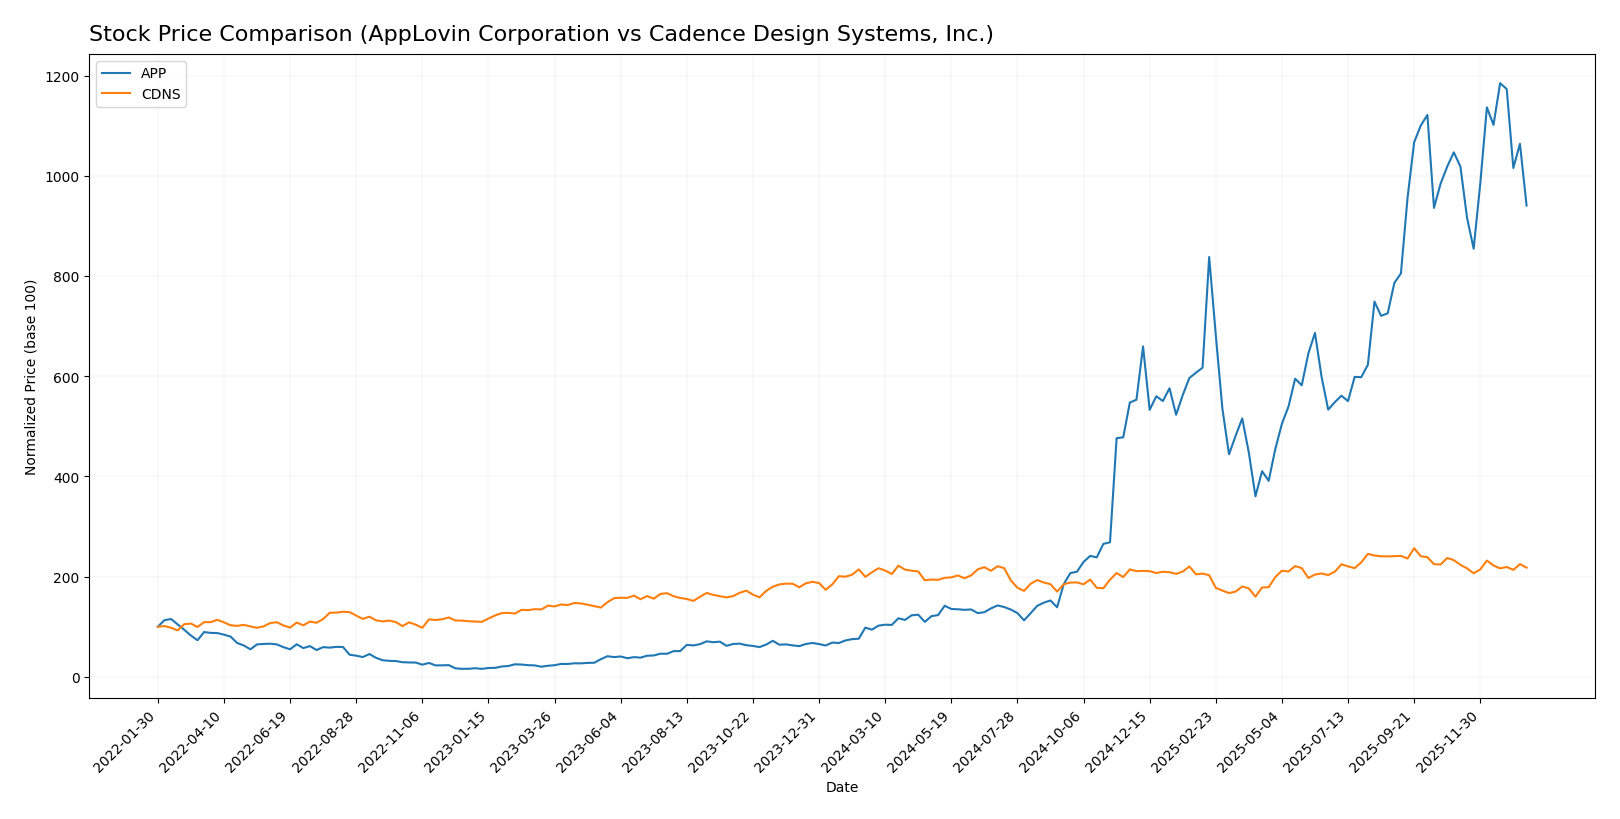
Stock price movements over the past year reveal significant bullish trends for both AppLovin Corporation and Cadence Design Systems, with varying degrees of acceleration and recent downward pressure in trading dynamics.
Trend Analysis
AppLovin Corporation (APP) exhibited a strong bullish trend over the past 12 months with an 897.85% price increase, though this growth has decelerated. The stock reached a high of 721.37 and a low of 57.39, showing notable volatility with a 201.11 standard deviation.
Cadence Design Systems, Inc. (CDNS) also showed a bullish trend with a 4.42% price increase over the year, but with deceleration. Its price ranged between 232.88 and 373.35, and volatility was lower, as indicated by a 29.12 standard deviation.
Comparing both, APP delivered the highest market performance with a substantially larger price increase, while CDNS showed more moderate gains and lower volatility during the same period.
Target Prices
The current analyst consensus on target prices for AppLovin Corporation and Cadence Design Systems, Inc. indicates potential upside from their current trading levels.
| Company | Target High | Target Low | Consensus |
|---|---|---|---|
| AppLovin Corporation | 860 | 630 | 756.33 |
| Cadence Design Systems, Inc. | 418 | 275 | 381 |
Analysts expect AppLovin’s stock to rise significantly from its current price of 573.51, with a consensus target at 756.33, indicating optimism. Cadence’s consensus target of 381 also suggests moderate upside potential compared to its current price of 317.80.
Analyst Opinions Comparison
This section compares analysts’ ratings and grades for AppLovin Corporation and Cadence Design Systems, Inc.:
Rating Comparison
APP Rating
- Rating: B, considered Very Favorable overall by analysts.
- Discounted Cash Flow Score: Moderate at 3, indicating average valuation.
- ROE Score: Very Favorable at 5, showing strong profitability from equity.
- ROA Score: Very Favorable at 5, reflecting excellent asset utilization.
- Debt To Equity Score: Very Unfavorable at 1, signaling high financial risk.
- Overall Score: Moderate at 3, representing an average overall financial health.
CDNS Rating
- Rating: B, also considered Very Favorable overall by analysts.
- Discounted Cash Flow Score: Moderate at 3, indicating average valuation.
- ROE Score: Favorable at 4, indicating good profitability from equity.
- ROA Score: Very Favorable at 5, reflecting excellent asset utilization.
- Debt To Equity Score: Moderate at 2, indicating lower financial risk than APP.
- Overall Score: Moderate at 3, representing an average overall financial health.
Which one is the best rated?
Both APP and CDNS share the same overall rating of B and an overall score of 3, indicating moderate financial health. APP excels in ROE but has a weaker debt position, while CDNS has a better debt-to-equity score but slightly lower ROE.
Scores Comparison
Here is a comparison of the Altman Z-Score and Piotroski Score for AppLovin Corporation and Cadence Design Systems, Inc.:
APP Scores
- Altman Z-Score: 30.7, indicating a safe zone status.
- Piotroski Score: 7, classified as strong financial health.
CDNS Scores
- Altman Z-Score: 14.5, also within the safe zone range.
- Piotroski Score: 7, classified as strong financial health.
Which company has the best scores?
Both APP and CDNS have Altman Z-Scores well within the safe zone, indicating low bankruptcy risk. Their Piotroski Scores are equal at 7, reflecting similarly strong financial health according to the provided data.
Grades Comparison
Here is a comparison of the most recent grades assigned to AppLovin Corporation and Cadence Design Systems, Inc.:
AppLovin Corporation Grades
The following table summarizes recent grades from established financial institutions for AppLovin Corporation:
| Grading Company | Action | New Grade | Date |
|---|---|---|---|
| Morgan Stanley | Maintain | Overweight | 2026-01-13 |
| Wells Fargo | Maintain | Overweight | 2026-01-08 |
| Jefferies | Maintain | Buy | 2025-12-11 |
| Benchmark | Maintain | Buy | 2025-12-11 |
| Citigroup | Maintain | Buy | 2025-11-12 |
| Wells Fargo | Maintain | Overweight | 2025-11-07 |
| Goldman Sachs | Maintain | Neutral | 2025-11-07 |
| JP Morgan | Maintain | Neutral | 2025-11-06 |
| Wedbush | Maintain | Outperform | 2025-11-06 |
| Piper Sandler | Maintain | Overweight | 2025-11-06 |
AppLovin’s grades predominantly indicate confidence with multiple “Buy” and “Overweight” ratings, complemented by a few “Neutral” assessments.
Cadence Design Systems, Inc. Grades
The table below presents recent grades from recognized grading firms for Cadence Design Systems, Inc.:
| Grading Company | Action | New Grade | Date |
|---|---|---|---|
| Needham | Maintain | Buy | 2025-12-22 |
| Wells Fargo | Maintain | Overweight | 2025-10-28 |
| Baird | Maintain | Outperform | 2025-10-28 |
| Needham | Maintain | Buy | 2025-10-28 |
| JP Morgan | Maintain | Overweight | 2025-10-28 |
| Oppenheimer | Maintain | Underperform | 2025-10-28 |
| Rosenblatt | Maintain | Neutral | 2025-10-28 |
| Rosenblatt | Maintain | Neutral | 2025-10-22 |
| Needham | Maintain | Buy | 2025-07-29 |
| Loop Capital | Maintain | Buy | 2025-07-29 |
Cadence Design’s ratings are generally positive with many “Buy,” “Overweight,” and “Outperform” grades, though it also includes an “Underperform” rating and several “Neutral” ratings.
Which company has the best grades?
Both AppLovin and Cadence Design Systems hold predominantly positive grades with consensus “Buy” ratings. AppLovin’s grades show consistent “Buy” and “Overweight” ratings without any “Underperform,” while Cadence Design includes a notable “Underperform” from one firm. This suggests AppLovin’s grades reflect a slightly more uniformly positive outlook, which may influence investor confidence differently in portfolio considerations.
Strengths and Weaknesses
Below is a comparative overview of the strengths and weaknesses of AppLovin Corporation (APP) and Cadence Design Systems, Inc. (CDNS) based on recent financial and market data.
| Criterion | AppLovin Corporation (APP) | Cadence Design Systems, Inc. (CDNS) |
|---|---|---|
| Diversification | Moderate: Revenue mainly from Advertising ($3.22B) and Apps ($1.49B) segments, limited by concentration in digital platforms. | High: Diverse revenue streams from Product & Maintenance ($4.21B) and Technology Services ($0.43B). |
| Profitability | High: Net margin 33.55%, ROE 145%, ROIC 38.7%, but high debt (Debt/Assets 60.6%). | Moderate: Net margin 22.74%, ROE 22.58%, ROIC 13.43%, with lower leverage (Debt/Assets 28.8%). |
| Innovation | Strong: Very favorable economic moat with rapidly growing ROIC (+1173%), indicating robust competitive advantages. | Moderate: Slightly favorable moat with declining ROIC (-30%), signaling challenges in sustaining profitability growth. |
| Global presence | Growing: Increasing profitability suggests expanding market influence, mainly in digital advertising technology. | Established: Solid global footprint in electronic design automation, steady revenue growth over years. |
| Market Share | Niche but growing: Dominant in mobile advertising and apps with rapid revenue improvement. | Stable: Leading position in electronic design automation with consistent product and service revenue. |
Key takeaways: AppLovin shows strong profitability and innovation but carries higher financial risk due to leverage. Cadence offers more diversification and financial stability with moderate profitability, though its declining ROIC trend warrants caution. Investors should weigh growth potential against risk tolerance.
Risk Analysis
Below is a comparative table outlining key risks for AppLovin Corporation (APP) and Cadence Design Systems, Inc. (CDNS) based on the most recent 2024 data.
| Metric | AppLovin Corporation (APP) | Cadence Design Systems, Inc. (CDNS) |
|---|---|---|
| Market Risk | High beta (2.5), volatile price range (200.5-745.61) | Moderate beta (1.02), stable price range (221.56-376.45) |
| Debt level | High debt-to-equity (3.26), debt to assets 60.59% (unfavorable) | Moderate debt-to-equity (0.55), debt to assets 28.8% (favorable) |
| Regulatory Risk | Moderate; operates in US tech sector, privacy regulations impact | Moderate; serves global semiconductor design, subject to export controls |
| Operational Risk | Medium; innovation dependence, fast-moving mobile ad market | Medium; complex product development, reliance on tech ecosystem stability |
| Environmental Risk | Low; software-focused with minimal direct environmental impact | Low; primarily software, limited physical footprint |
| Geopolitical Risk | Moderate; US-based but global client exposure | Moderate; semiconductor supply chain sensitive to geopolitical tensions |
In synthesis, AppLovin’s most significant risks stem from a high market volatility and heavy leverage, which raise financial vulnerability despite strong profitability. Cadence Design shows lower financial risk with strong balance sheet metrics but faces challenges from industry-specific geopolitical uncertainties. Both companies require cautious monitoring of market conditions and regulatory developments to manage downside risks effectively.
Which Stock to Choose?
AppLovin Corporation (APP) exhibits strong income growth with a 224.53% revenue increase over 2020-2024 and a highly favorable net margin of 33.55%. Its financial ratios are slightly favorable, highlighted by exceptional ROE at 144.96% and ROIC at 38.7%, despite elevated debt levels and a WACC of 15.45%. APP’s very favorable rating and very favorable moat evaluation reflect durable competitive advantages and value creation.
Cadence Design Systems, Inc. (CDNS) shows steady income growth of 72.99% over the same period with a net margin of 22.74%. Its financial ratios are favorable overall, featuring moderate leverage, a debt-to-assets ratio of 28.8%, and good profitability metrics including a 22.58% ROE and 13.43% ROIC. CDNS holds a very favorable rating and a slightly favorable moat status, indicating value creation but with a declining profitability trend.
Investors focused on aggressive growth might find APP’s strong income expansion and very favorable moat appealing, while those prioritizing financial stability and consistent profitability may view CDNS’s favorable ratios and moderate leverage as more suitable. The choice could depend on one’s risk tolerance and investment strategy, given both companies’ very favorable ratings but differing financial profiles.
Disclaimer: Investment carries a risk of loss of initial capital. The past performance is not a reliable indicator of future results. Be sure to understand risks before making an investment decision.
Go Further
I encourage you to read the complete analyses of AppLovin Corporation and Cadence Design Systems, Inc. to enhance your investment decisions: