In the fast-evolving software industry, AppLovin Corporation (APP) and Autodesk, Inc. (ADSK) stand out as influential players with distinct innovation strategies. AppLovin focuses on mobile app marketing and monetization, while Autodesk specializes in 3D design and engineering software. Despite their different niches, both companies compete for technology-driven growth and market leadership. This article will explore which stock presents the most compelling investment opportunity for your portfolio in 2026.

Table of contents
Companies Overview
I will begin the comparison between AppLovin Corporation and Autodesk, Inc. by providing an overview of these two companies and their main differences.
AppLovin Corporation Overview
AppLovin Corporation focuses on building a software platform that assists mobile app developers in marketing and monetizing their applications globally. Their key products include AppDiscovery, Adjust, and MAX, which provide marketing, analytics, and in-app bidding solutions. Founded in 2011, AppLovin is headquartered in Palo Alto, California, and operates in the Software – Application industry.
Autodesk, Inc. Overview
Autodesk, Inc. offers 3D design, engineering, and entertainment software worldwide, targeting professionals in architecture, manufacturing, and media. Its product suite includes AutoCAD, Fusion 360, BIM 360, and Maya, among others, supporting diverse sectors such as civil engineering and media production. Established in 1982, Autodesk is based in San Rafael, California, with a substantial global presence.
Key similarities and differences
Both companies operate in the Software – Application industry, providing specialized software solutions targeting professional users. AppLovin emphasizes mobile app marketing and monetization platforms, while Autodesk focuses on 3D design and engineering software for multiple industries. Autodesk has a significantly larger workforce and market capitalization, reflecting its broader product scope and customer base compared to AppLovin’s niche mobile app ecosystem.
Income Statement Comparison
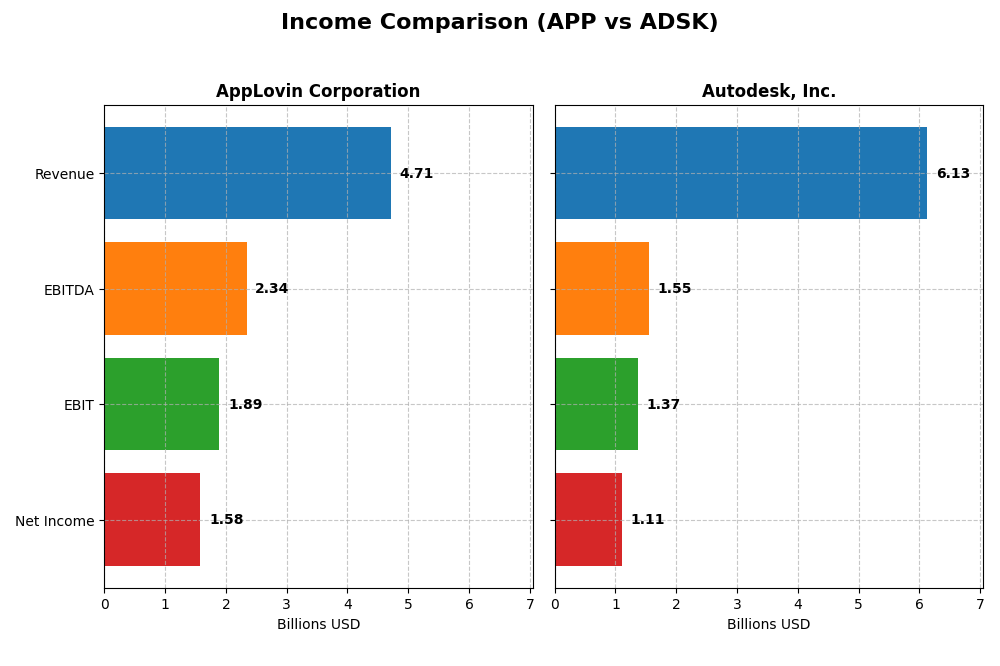
The table below presents a side-by-side comparison of the latest fiscal year income statement metrics for AppLovin Corporation and Autodesk, Inc., highlighting key financial indicators.
| Metric | AppLovin Corporation (APP) | Autodesk, Inc. (ADSK) |
|---|---|---|
| Market Cap | 194.1B | 56.3B |
| Revenue | 4.71B | 6.13B |
| EBITDA | 2.34B | 1.55B |
| EBIT | 1.89B | 1.37B |
| Net Income | 1.58B | 1.11B |
| EPS | 4.68 | 5.17 |
| Fiscal Year | 2024 | 2025 |
Income Statement Interpretations
AppLovin Corporation
AppLovin’s revenue surged from $1.45B in 2020 to $4.71B in 2024, accompanied by a dramatic net income turnaround from a $125M loss to $1.58B profit. Gross and EBIT margins improved steadily, reaching 75.2% and 40.2%, respectively, in 2024. The latest year saw exceptional growth with revenue up 43.4% and net margin more than doubling, reflecting strong operational leverage and profitability gains.
Autodesk, Inc.
Autodesk’s revenue increased from $3.79B in 2021 to $6.13B in 2025, with net income fluctuating but rising to $1.11B in 2025. Gross margin remained high at 90.6%, while EBIT margin was lower at 22.3%. The 2025 results showed solid revenue growth of 12.7% and moderate net margin improvement, though net income growth over the entire period was negative, signaling some pressure on profitability.
Which one has the stronger fundamentals?
AppLovin exhibits stronger fundamentals with substantial revenue and net income growth and marked margin expansion, supported by a favorable 92.9% positive income statement evaluation. Autodesk, despite solid revenue and gross margin, faces declining net income and margin over the longer term, reflected in its 21.4% unfavorable income statement factors. AppLovin’s rapid earnings momentum contrasts with Autodesk’s steadier but less profitable growth.
Financial Ratios Comparison
The table below presents a snapshot of key financial ratios for AppLovin Corporation and Autodesk, Inc. based on their most recent fiscal year data, enabling a side-by-side comparison of their financial performance and position.
| Ratios | AppLovin Corporation (2024) | Autodesk, Inc. (2025) |
|---|---|---|
| ROE | 144.96% | 42.43% |
| ROIC | 38.70% | 18.01% |
| P/E | 69.06 | 60.20 |
| P/B | 100.11 | 25.54 |
| Current Ratio | 2.19 | 0.68 |
| Quick Ratio | 2.19 | 0.68 |
| D/E (Debt-to-Equity) | 3.26 | 0.98 |
| Debt-to-Assets | 60.59% | 23.62% |
| Interest Coverage | 5.89 | 0.00 |
| Asset Turnover | 0.80 | 0.57 |
| Fixed Asset Turnover | 23.71 | 21.44 |
| Payout ratio | 0 | 0 |
| Dividend yield | 0 | 0 |
Interpretation of the Ratios
AppLovin Corporation
AppLovin shows strong profitability with a high net margin of 33.55% and exceptional returns on equity (144.96%) and invested capital (38.7%), though its high price-to-earnings (69.06) and price-to-book (100.11) ratios raise valuation concerns. The company maintains a healthy liquidity position with a current ratio of 2.19 but carries substantial leverage (debt-to-equity 3.26). It does not pay dividends, likely focusing on reinvestment and growth.
Autodesk, Inc.
Autodesk presents solid profitability ratios, including an 18.14% net margin and a 42.43% return on equity, supported by favorable leverage (debt-to-assets 23.62%) and strong interest coverage. However, liquidity ratios are weak, with a current ratio of 0.68, suggesting short-term financial constraints. Like AppLovin, Autodesk pays no dividends, possibly prioritizing R&D and acquisitions to fuel growth.
Which one has the best ratios?
AppLovin exhibits a slightly more favorable overall ratio profile, balancing robust profitability and liquidity despite higher leverage and valuation multiples. Autodesk shows balanced profitability and lower debt risk but weaker liquidity. Both companies do not distribute dividends, reflecting growth-oriented strategies; thus, the best ratio depends on investors’ preference for liquidity versus leverage.
Strategic Positioning
This section compares the strategic positioning of AppLovin Corporation and Autodesk, Inc. including Market position, Key segments, and disruption:
AppLovin Corporation
- Large market cap of $194B with high beta, facing tech competition in software applications.
- Focuses on mobile app marketing and monetization platforms with advertising and apps segments.
- Exposure to disruption through real-time bidding and analytics platforms in mobile advertising.
Autodesk, Inc.
- Market cap $56B, lower beta, established in 3D design and engineering software markets.
- Diversified across architecture, manufacturing, media, and AutoCAD software families.
- Faces disruption risks from cloud-based construction management and emerging 3D CAD technologies.
AppLovin Corporation vs Autodesk, Inc. Positioning
AppLovin is concentrated on mobile advertising and app monetization, providing specialized software platforms, while Autodesk has a diversified portfolio spanning multiple design and engineering sectors. AppLovin leverages auction-based marketing tech, Autodesk relies on cloud and CAD innovations.
Which has the best competitive advantage?
Both companies show very favorable moats with growing ROIC above WACC, indicating durable competitive advantages and efficient capital use, but AppLovin’s higher ROIC growth suggests a stronger value creation momentum.
Stock Comparison
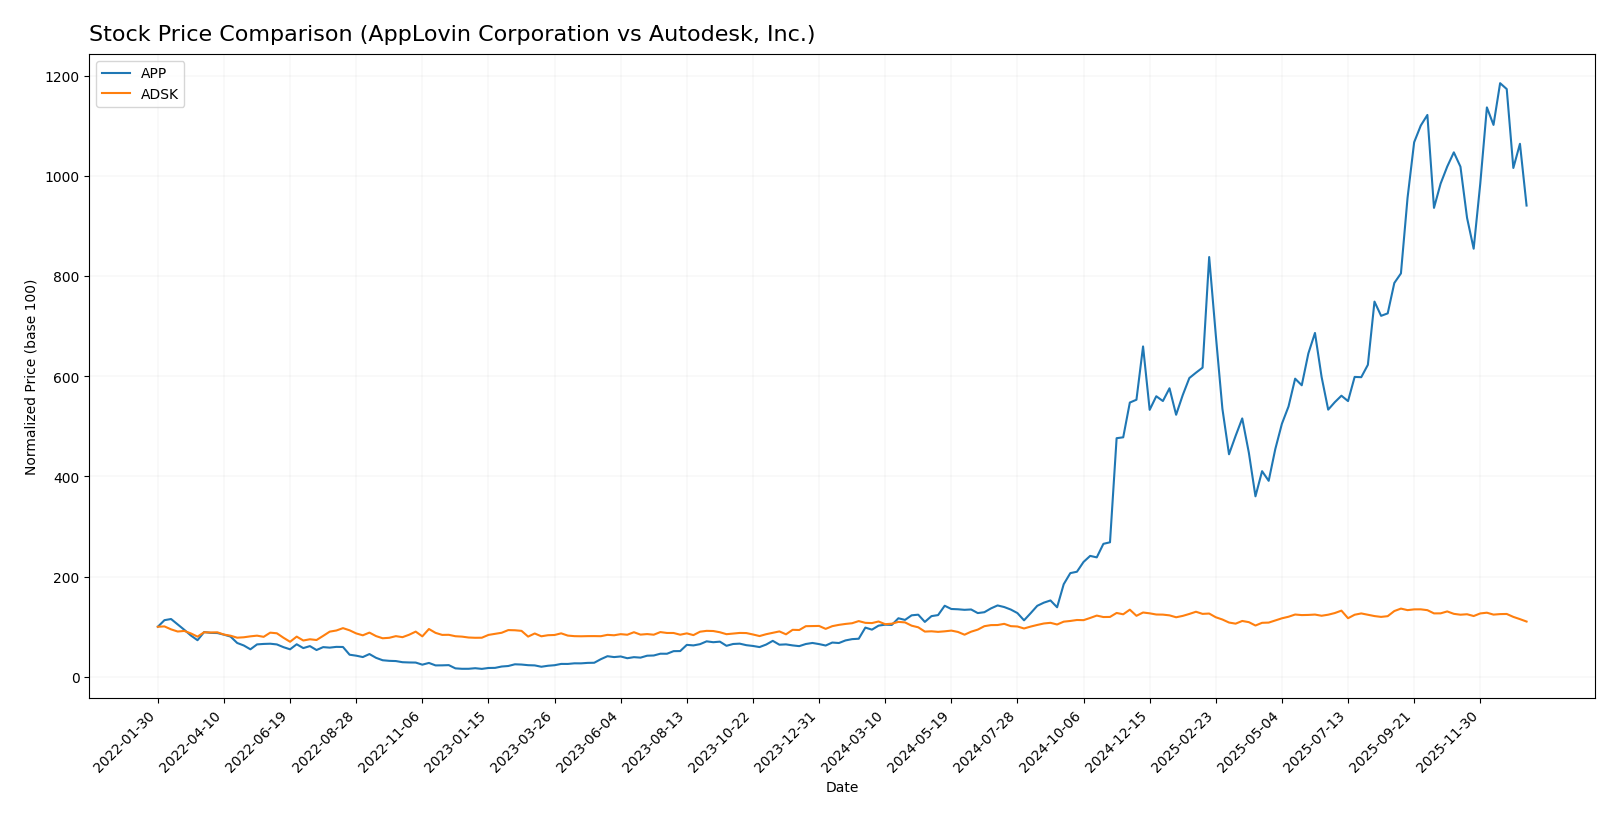
The stock price movements of AppLovin Corporation (APP) and Autodesk, Inc. (ADSK) over the past year reveal strong bullish trends with notable price surges and recent periods of declining momentum.
Trend Analysis
AppLovin Corporation (APP) showed a robust bullish trend with an 897.85% price increase over the past 12 months, despite recent deceleration and a -10.15% drop from November 2025 to January 2026. Volatility was high with a 201.11 standard deviation.
Autodesk, Inc. (ADSK) experienced a moderate bullish trend, with a 2.83% price gain over the past year and decelerating momentum. Recent months saw a sharper decline of -12.23%, accompanied by lower volatility at 29.88 standard deviation.
Comparing both stocks, APP delivered substantially higher market performance with an 897.85% gain versus ADSK’s 2.83%, though both faced recent short-term downward pressure.
Target Prices
The current analyst consensus presents optimistic target prices for both AppLovin Corporation and Autodesk, Inc.
| Company | Target High | Target Low | Consensus |
|---|---|---|---|
| AppLovin Corporation | 860 | 630 | 756.33 |
| Autodesk, Inc. | 400 | 343 | 373 |
Analysts expect AppLovin’s stock to rise significantly above its current price of 573.86 USD, while Autodesk’s consensus target of 373 USD also suggests potential upside from its current 264.4 USD price.
Analyst Opinions Comparison
This section compares analysts’ ratings and grades for AppLovin Corporation and Autodesk, Inc.:
Rating Comparison
AppLovin Corporation Rating
- Rating: B, classified as Very Favorable
- Discounted Cash Flow Score: 3, Moderate valuation
- ROE Score: 5, Very Favorable efficiency in equity use
- ROA Score: 5, Very Favorable asset utilization
- Debt To Equity Score: 1, Very Unfavorable financial risk
- Overall Score: 3, Moderate overall financial standing
Autodesk, Inc. Rating
- Rating: B-, classified as Very Favorable
- Discounted Cash Flow Score: 3, Moderate valuation
- ROE Score: 5, Very Favorable efficiency in equity use
- ROA Score: 4, Favorable asset utilization
- Debt To Equity Score: 1, Very Unfavorable financial risk
- Overall Score: 3, Moderate overall financial standing
Which one is the best rated?
Based strictly on provided data, AppLovin holds a slightly higher rating (B vs. B-) and stronger ROA score (5 vs. 4), while both share equal scores in DCF, ROE, debt-to-equity, and overall scores.
Scores Comparison
Here is a comparison of the financial scores for AppLovin Corporation and Autodesk, Inc.:
APP Scores
- Altman Z-Score: 30.7, indicating a safe zone with low bankruptcy risk.
- Piotroski Score: 7, classified as strong financial health.
ADSK Scores
- Altman Z-Score: 5.05, also in the safe zone, showing financial stability.
- Piotroski Score: 8, categorized as very strong financial health.
Which company has the best scores?
Both companies are in the safe zone according to their Altman Z-Scores, but Autodesk has a higher Piotroski Score (8 vs. 7), indicating slightly stronger financial health by this measure.
Grades Comparison
Here is the grades comparison for AppLovin Corporation and Autodesk, Inc.:
AppLovin Corporation Grades
The following table summarizes recent grades from leading financial institutions for AppLovin Corporation:
| Grading Company | Action | New Grade | Date |
|---|---|---|---|
| Morgan Stanley | Maintain | Overweight | 2026-01-13 |
| Wells Fargo | Maintain | Overweight | 2026-01-08 |
| Jefferies | Maintain | Buy | 2025-12-11 |
| Benchmark | Maintain | Buy | 2025-12-11 |
| Citigroup | Maintain | Buy | 2025-11-12 |
| Wells Fargo | Maintain | Overweight | 2025-11-07 |
| Goldman Sachs | Maintain | Neutral | 2025-11-07 |
| JP Morgan | Maintain | Neutral | 2025-11-06 |
| Wedbush | Maintain | Outperform | 2025-11-06 |
| Piper Sandler | Maintain | Overweight | 2025-11-06 |
AppLovin’s grades mostly reflect a positive outlook with multiple Buy and Overweight ratings maintained, alongside some Neutral opinions.
Autodesk, Inc. Grades
Below is a summary of recent grades from notable financial institutions for Autodesk, Inc.:
| Grading Company | Action | New Grade | Date |
|---|---|---|---|
| Barclays | Maintain | Overweight | 2025-11-26 |
| Wells Fargo | Maintain | Overweight | 2025-11-26 |
| Deutsche Bank | Upgrade | Buy | 2025-11-26 |
| B of A Securities | Maintain | Neutral | 2025-11-26 |
| Rosenblatt | Maintain | Buy | 2025-11-26 |
| Macquarie | Maintain | Outperform | 2025-11-26 |
| BMO Capital | Maintain | Market Perform | 2025-11-26 |
| Baird | Maintain | Outperform | 2025-11-26 |
| Rosenblatt | Maintain | Buy | 2025-11-24 |
| Baird | Maintain | Outperform | 2025-11-18 |
Autodesk’s grades indicate a strong consensus with several Buy and Outperform ratings, and only a few Neutral or Market Perform assessments.
Which company has the best grades?
Both companies have predominantly positive grades classified as Buy, Overweight, and Outperform. Autodesk has a larger number of Buy and Outperform ratings from diverse analysts, potentially signaling broader confidence. This may influence investors seeking well-supported growth opportunities and risk diversification.
Strengths and Weaknesses
Below is a comparative overview of key strengths and weaknesses of AppLovin Corporation (APP) and Autodesk, Inc. (ADSK) based on the latest financial and operational data.
| Criterion | AppLovin Corporation (APP) | Autodesk, Inc. (ADSK) |
|---|---|---|
| Diversification | Moderate; revenue mainly from Advertising ($3.22B) and Apps ($1.49B) segments | High; diversified across Architecture, AutoCAD, Manufacturing, and Media segments with $2.94B in Architecture alone |
| Profitability | Strong profitability: net margin 33.55%, ROIC 38.7%, ROE 144.96% | Solid profitability: net margin 18.14%, ROIC 18.01%, ROE 42.43% |
| Innovation | High innovation reflected in rapidly growing ROIC (+1173%) and strong software platform evolution | Consistent innovation with steady ROIC growth (+15.4%) and product expansion in design software |
| Global presence | Growing global footprint primarily in mobile advertising and apps | Established global leader in CAD and 3D design software with broad market adoption |
| Market Share | Significant share in mobile advertising and app monetization markets | Leading share in architecture and engineering software, with expanding manufacturing and media segments |
Key takeaways: AppLovin shows exceptional profitability and rapid ROIC growth driven by strong advertising and app segments, but with less diversification. Autodesk benefits from a well-diversified revenue base and steady innovation, supporting durable competitive advantages, though its profitability metrics are more moderate. Both companies demonstrate strong moats but cater to distinct market niches.
Risk Analysis
Below is a comparative risk overview of AppLovin Corporation (APP) and Autodesk, Inc. (ADSK) based on the most recent data available for 2025-2026:
| Metric | AppLovin Corporation (APP) | Autodesk, Inc. (ADSK) |
|---|---|---|
| Market Risk | High beta (2.50) indicating elevated volatility | Moderate beta (1.47) with lower volatility |
| Debt level | High leverage: Debt-to-equity 3.26; Debt-to-assets 60.6% (unfavorable) | Moderate leverage: Debt-to-equity 0.98; Debt-to-assets 23.6% (neutral/favorable) |
| Regulatory Risk | Moderate, tech sector with data privacy considerations | Moderate, software industry compliance and IP protection |
| Operational Risk | Moderate, reliant on mobile advertising market dynamics | Moderate, exposure to product development cycles and cloud services |
| Environmental Risk | Low to moderate, primarily software-based with limited direct environmental impact | Low to moderate, software services with some focus on sustainable design tools |
| Geopolitical Risk | Moderate, global app markets sensitive to international trade policies | Moderate, global customer base with exposure to geopolitical tensions impacting supply chains |
Synthesis: AppLovin faces more significant market and financial risks due to its high volatility and leverage, which could amplify losses during downturns. Autodesk, while more stable financially, has operational risks tied to innovation and market competition. Both companies navigate moderate regulatory and geopolitical risks inherent in the tech sector. Investors should weigh AppLovin’s growth potential against its higher financial risk, while Autodesk offers steadier performance with a solid financial footing.
Which Stock to Choose?
AppLovin Corporation (APP) shows a robust income evolution with a 224.53% revenue growth over 2020-2024, excellent profitability including a 33.55% net margin, and a very favorable ROE of 144.96%. Despite a high debt-to-equity ratio of 3.26, APP’s rating is very favorable with a strong economic moat indicated by a ROIC well above WACC and a durable competitive advantage.
Autodesk, Inc. (ADSK) has steady income growth of 61.74% over 2021-2025, with good profitability metrics such as an 18.14% net margin and a favorable ROE of 42.43%. Its debt levels are more moderate with a debt-to-assets ratio of 23.62%, and it maintains a very favorable rating and a durable economic moat, though its overall financial ratios evaluation is neutral.
Investors focused on rapid growth might find APP’s significantly higher income growth and profitability metrics appealing, while those prioritizing financial stability and moderate leverage could view ADSK’s balanced metrics and solid economic moat as more favorable. The choice could depend on the investor’s risk tolerance and investment strategy.
Disclaimer: Investment carries a risk of loss of initial capital. The past performance is not a reliable indicator of future results. Be sure to understand risks before making an investment decision.
Go Further
I encourage you to read the complete analyses of AppLovin Corporation and Autodesk, Inc. to enhance your investment decisions: