In the fast-evolving software application industry, AppLovin Corporation (APP) and Atlassian Corporation (TEAM) stand out as key players with distinct innovation strategies and market focuses. AppLovin excels in mobile app marketing and monetization platforms, while Atlassian leads in collaborative project management and developer tools. This article will dissect their strengths and risks to help you decide which company presents the most compelling investment opportunity in 2026.
Table of contents
Companies Overview
I will begin the comparison between AppLovin Corporation and Atlassian Corporation by providing an overview of these two companies and their main differences.
AppLovin Overview
AppLovin Corporation focuses on building a software platform for mobile app developers to improve marketing and monetization globally. Its offerings include AppDiscovery for marketing, Adjust for analytics, and MAX for in-app bidding, targeting advertisers, publishers, and internet platforms. Founded in 2011 and headquartered in Palo Alto, California, AppLovin operates in the technology sector with a market cap of 193B USD.
Atlassian Overview
Atlassian Corporation designs and maintains software products that facilitate project management, collaboration, and software development globally. Its portfolio includes Jira, Confluence, Trello, and other tools aimed at connecting teams and improving workflow. Founded in 2002 and based in Sydney, Australia, Atlassian serves enterprise and developer clients with a market cap of 31.7B USD and employs over 12K people.
Key similarities and differences
Both companies operate in the software application industry and serve global markets with technology solutions. AppLovin centers on mobile app marketing and monetization platforms, while Atlassian offers enterprise software for project management and collaboration. AppLovin has a significantly higher market capitalization and smaller workforce compared to Atlassian, reflecting differences in scale and business focus.
Income Statement Comparison
The table below compares the key income statement metrics for AppLovin Corporation and Atlassian Corporation based on their most recent fiscal years.

| Metric | AppLovin Corporation (APP) | Atlassian Corporation (TEAM) |
|---|---|---|
| Market Cap | 193B | 31.7B |
| Revenue | 4.71B | 5.22B |
| EBITDA | 2.34B | 24M |
| EBIT | 1.89B | -68.3M |
| Net Income | 1.58B | -257M |
| EPS | 4.68 | -0.98 |
| Fiscal Year | 2024 | 2025 |
Income Statement Interpretations
AppLovin Corporation
AppLovin’s revenue grew significantly from 2020 to 2024, rising from $1.45B to $4.71B, with net income swinging from a loss of $125M in 2020 to a strong profit of $1.58B in 2024. Margins improved notably, with a gross margin of 75.22% and net margin at 33.55% in 2024. The latest year showed robust growth in revenue (+43%) and net income (+209%), indicating accelerating profitability.
Atlassian Corporation
Atlassian’s revenue increased steadily from $2.09B in mid-2021 to $5.22B in mid-2025, while net income remained negative over the period, with a net loss of $257M in 2025. Gross margins are high at 82.84%, but EBIT and net margins remain negative, reflecting ongoing operating losses. The recent year saw revenue growth of 20% but a decline in EBIT by 33%, signaling margin pressures despite higher top-line performance.
Which one has the stronger fundamentals?
AppLovin demonstrates stronger fundamentals with consistent profitability and margin expansion, supported by substantial revenue and net income growth. Atlassian, although growing revenue impressively, continues to experience operating losses and negative net margins. AppLovin’s favorable margin and income growth metrics contrast with Atlassian’s mixed performance, highlighting a clearer upward earnings trajectory for AppLovin.
Financial Ratios Comparison
The table below presents a factual comparison of key financial ratios for AppLovin Corporation (APP) and Atlassian Corporation (TEAM) using their most recent available data.
| Ratios | AppLovin Corporation (APP) 2024 | Atlassian Corporation (TEAM) 2025 HY |
|---|---|---|
| ROE | 144.96% | -19.08% |
| ROIC | 38.70% | -4.48% |
| P/E | 69.06 | -207.13 |
| P/B | 100.11 | 39.51 |
| Current Ratio | 2.19 | 1.22 |
| Quick Ratio | 2.19 | 1.22 |
| D/E (Debt-to-Equity) | 3.26 | 0.92 |
| Debt-to-Assets | 60.59% | 20.51% |
| Interest Coverage | 5.89 | -4.27 |
| Asset Turnover | 0.80 | 0.86 |
| Fixed Asset Turnover | 23.71 | 19.02 |
| Payout Ratio | 0 | 0 |
| Dividend Yield | 0 | 0 |
Interpretation of the Ratios
AppLovin Corporation
AppLovin shows a mixed ratio profile with favorable net margin (33.55%), ROE (144.96%), and ROIC (38.7%), indicating strong profitability and capital efficiency. However, high debt-related ratios (debt to equity 3.26, debt to assets 60.59%) and valuation multiples (PE 69.06, PB 100.11) raise concerns. The company does not pay dividends, likely focusing on growth and reinvestment.
Atlassian Corporation
Atlassian presents several unfavorable profitability ratios, including a negative net margin (-4.92%), ROE (-19.08%), and ROIC (-4.48%), reflecting operational challenges. Its leverage is moderate with debt to equity close to 1 and debt to assets at 20.51%. Like AppLovin, Atlassian does not pay dividends, possibly prioritizing R&D and expansion over shareholder payouts.
Which one has the best ratios?
AppLovin’s ratios are slightly favorable, driven by strong profitability and returns despite leverage and valuation concerns. Atlassian’s ratios lean slightly unfavorable due to consistent losses and negative returns, despite better leverage metrics. Thus, AppLovin currently exhibits a more favorable overall ratio profile compared to Atlassian.
Strategic Positioning
This section compares the strategic positioning of AppLovin Corporation and Atlassian Corporation, focusing on market position, key segments, and exposure to technological disruption:
AppLovin Corporation
- Strong market position in mobile app marketing software with high competitive pressure.
- Key segments include advertising platform and mobile apps driving revenue growth.
- Exposure to disruption through app monetization and marketing technology innovations.
Atlassian Corporation
- Established player in project management software facing moderate competitive pressure.
- Diverse software portfolio including project management, collaboration, and security tools.
- Exposure to disruption in enterprise software and collaboration tools amid evolving business needs.
AppLovin Corporation vs Atlassian Corporation Positioning
AppLovin focuses on a concentrated market of mobile app marketing and monetization, benefiting from rapid innovation but facing intense competition. Atlassian has a diversified software portfolio serving multiple enterprise functions, providing broader revenue streams but with complex market dynamics.
Which has the best competitive advantage?
AppLovin shows a very favorable MOAT with growing profitability and efficient capital use, indicating a durable competitive advantage. Atlassian has a very unfavorable MOAT, shedding value with declining profitability.
Stock Comparison
The past year showed a pronounced divergence in trading dynamics between AppLovin Corporation and Atlassian Corporation, with AppLovin experiencing a strong overall price surge while Atlassian faced a significant decline.
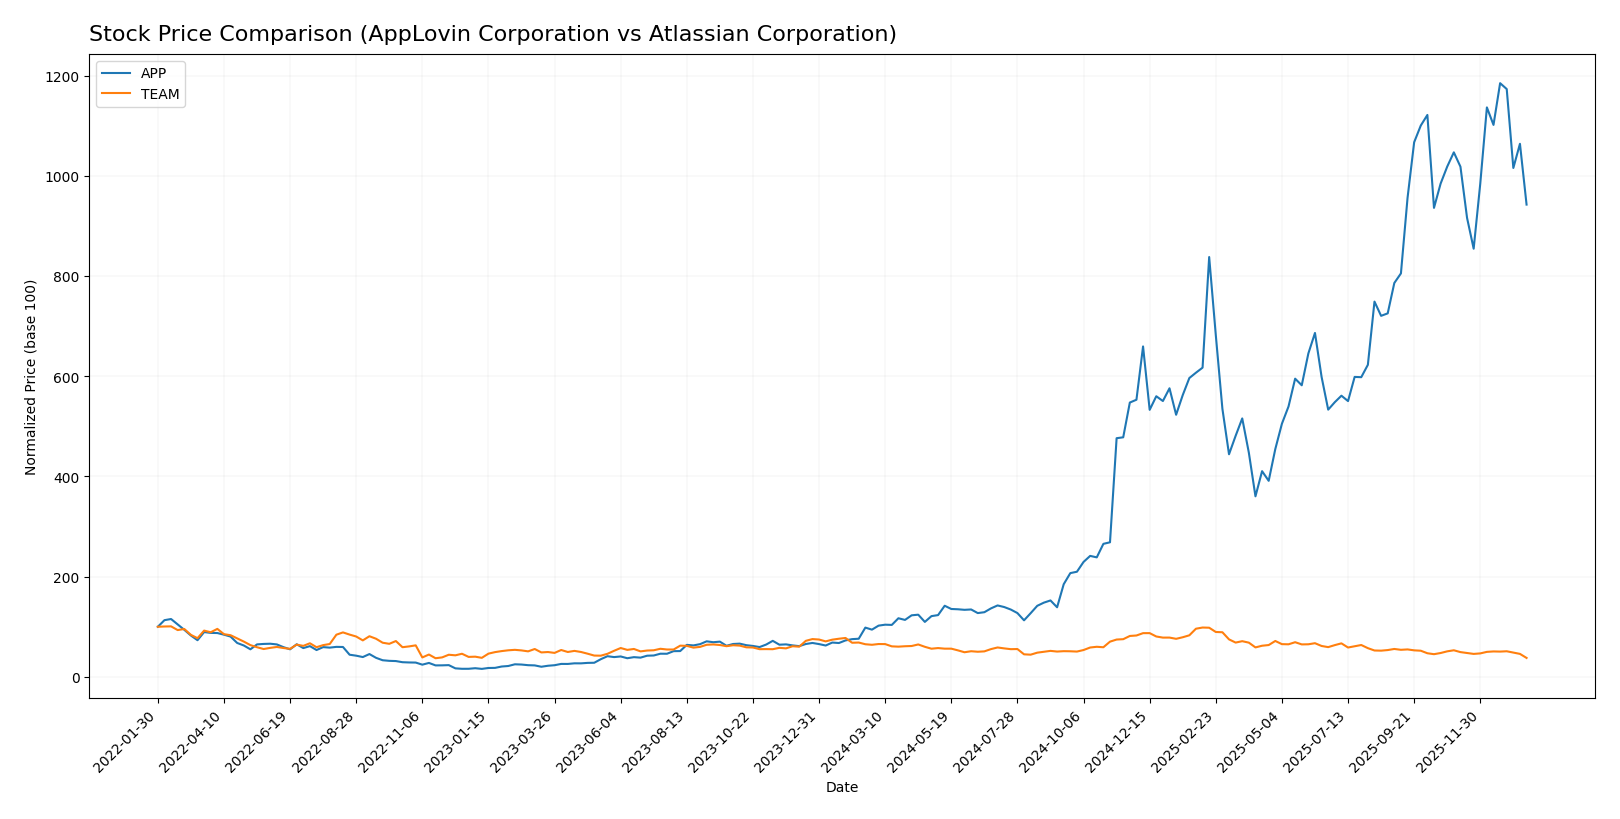
Trend Analysis
AppLovin Corporation’s stock exhibited a bullish trend over the past 12 months with an 899.9% price increase, though momentum decelerated. Price volatility was high (std dev 201.13), ranging from 57.39 to 721.37.
Atlassian Corporation’s stock followed a bearish trend with a 40.98% decline over the same period, also showing decelerating loss. Volatility was moderate (std dev 41.18), with prices between 120.66 and 314.28.
Comparing both, AppLovin’s stock delivered substantially higher market performance than Atlassian, reflecting strong growth versus a notable contraction.
Target Prices
Analysts present a clear consensus on target prices for both AppLovin Corporation and Atlassian Corporation.
| Company | Target High | Target Low | Consensus |
|---|---|---|---|
| AppLovin Corporation | 860 | 630 | 756.33 |
| Atlassian Corporation | 290 | 185 | 234.14 |
The consensus target prices for AppLovin and Atlassian suggest significant upside potential compared to their current prices of 571.61 and 120.82, respectively, indicating positive analyst expectations.
Analyst Opinions Comparison
This section compares analysts’ ratings and grades for AppLovin Corporation and Atlassian Corporation:
Rating Comparison
APP Rating
- Rating: B, assessed as Very Favorable overall.
- Discounted Cash Flow Score: 3, indicating a Moderate valuation assessment.
- ROE Score: 5, showing very efficient profit generation from equity.
- ROA Score: 5, demonstrating very effective asset utilization.
- Debt To Equity Score: 1, indicating a Very Unfavorable financial risk level.
- Overall Score: 3, assessed as Moderate overall financial standing.
TEAM Rating
- Rating: C, also assessed as Very Favorable overall.
- Discounted Cash Flow Score: 5, indicating a Very Favorable valuation.
- ROE Score: 1, reflecting very unfavorable profit generation efficiency.
- ROA Score: 1, demonstrating very unfavorable asset utilization.
- Debt To Equity Score: 1, also indicating a Very Unfavorable financial risk.
- Overall Score: 2, assessed as Moderate overall financial standing.
Which one is the best rated?
Based strictly on the provided data, APP holds a better overall rating (B vs. C) and stronger profitability metrics (ROE and ROA scores of 5 versus 1), despite both having very unfavorable debt-to-equity scores. TEAM has a higher discounted cash flow score but lower overall performance scores.
Scores Comparison
Here is a comparison of the Altman Z-Score and Piotroski Score for the two companies:
APP Scores
- Altman Z-Score: 30.7, indicating a safe zone with very low bankruptcy risk.
- Piotroski Score: 7, classified as strong financial health.
TEAM Scores
- Altman Z-Score: 4.7, in the safe zone with low bankruptcy risk.
- Piotroski Score: 5, indicating average financial strength.
Which company has the best scores?
APP has a significantly higher Altman Z-Score and a stronger Piotroski Score than TEAM. Based strictly on these scores, APP demonstrates better financial health and lower bankruptcy risk.
Grades Comparison
Here is a detailed comparison of the latest grades assigned to AppLovin Corporation and Atlassian Corporation:
AppLovin Corporation Grades
The table below summarizes recent grades from major financial institutions for AppLovin Corporation.
| Grading Company | Action | New Grade | Date |
|---|---|---|---|
| Morgan Stanley | Maintain | Overweight | 2026-01-13 |
| Wells Fargo | Maintain | Overweight | 2026-01-08 |
| Jefferies | Maintain | Buy | 2025-12-11 |
| Benchmark | Maintain | Buy | 2025-12-11 |
| Citigroup | Maintain | Buy | 2025-11-12 |
| Wells Fargo | Maintain | Overweight | 2025-11-07 |
| Goldman Sachs | Maintain | Neutral | 2025-11-07 |
| JP Morgan | Maintain | Neutral | 2025-11-06 |
| Wedbush | Maintain | Outperform | 2025-11-06 |
| Piper Sandler | Maintain | Overweight | 2025-11-06 |
AppLovin’s grades show a consistent positive trend with most firms maintaining Buy or Overweight ratings and no downgrades recently.
Atlassian Corporation Grades
Below is a summary of recent grades from reputable analysts for Atlassian Corporation.
| Grading Company | Action | New Grade | Date |
|---|---|---|---|
| BTIG | Maintain | Buy | 2026-01-13 |
| Piper Sandler | Maintain | Overweight | 2026-01-05 |
| Bernstein | Maintain | Outperform | 2025-11-18 |
| Macquarie | Maintain | Outperform | 2025-11-03 |
| Mizuho | Maintain | Outperform | 2025-10-31 |
| Bernstein | Maintain | Outperform | 2025-10-31 |
| TD Cowen | Maintain | Hold | 2025-10-27 |
| BMO Capital | Maintain | Outperform | 2025-10-24 |
| UBS | Maintain | Neutral | 2025-10-24 |
| Keybanc | Maintain | Overweight | 2025-10-23 |
Atlassian’s grading profile is broadly positive, with many Outperform and Buy ratings, complemented by a few Hold and Neutral stances.
Which company has the best grades?
Both companies have a consensus “Buy” rating, but Atlassian shows a stronger concentration of Outperform ratings compared to AppLovin’s emphasis on Buy and Overweight. This suggests Atlassian may be viewed as having slightly higher growth expectations, which investors might consider when evaluating potential portfolio impact.
Strengths and Weaknesses
Below is a comparative overview of the strengths and weaknesses of AppLovin Corporation (APP) and Atlassian Corporation (TEAM) based on recent financial and operational data.
| Criterion | AppLovin Corporation (APP) | Atlassian Corporation (TEAM) |
|---|---|---|
| Diversification | Moderate diversification: Advertising (3.22B), Apps (1.49B) segments | High diversification: License and Service (4.93B), plus smaller segments like Other (285M) |
| Profitability | High profitability: Net margin 33.55%, ROIC 38.7%, ROE 144.96% | Negative profitability: Net margin -4.92%, ROIC -4.48%, ROE -19.08% |
| Innovation | Strong innovation reflected in growing ROIC (+1173%) and very favorable moat status | Innovation concerns: Declining ROIC (-132%) and very unfavorable moat status |
| Global presence | Solid global presence supported by increasing revenues and high asset turnover | Global presence with steady revenue growth but lower asset turnover |
| Market Share | Strong market share in mobile advertising and apps | Leading in collaboration software but losing value and market traction |
In summary, AppLovin shows a robust financial and competitive position with growing profitability and a durable moat, making it a compelling investment option. Conversely, Atlassian is currently struggling with declining profitability and value destruction, warranting caution and further monitoring before investing.
Risk Analysis
Below is a comparative table highlighting the key risk metrics for AppLovin Corporation (APP) and Atlassian Corporation (TEAM) as of the most recent fiscal years:
| Metric | AppLovin Corporation (APP) | Atlassian Corporation (TEAM) |
|---|---|---|
| Market Risk | High (Beta 2.5, volatile price range $200.5-$745.61) | Moderate (Beta 0.89, price range $120.42-$326) |
| Debt level | High (Debt-to-Equity 3.26, Debt-to-Assets 60.6%) | Moderate (Debt-to-Equity 0.92, Debt-to-Assets 20.5%) |
| Regulatory Risk | Moderate (US tech sector exposure) | Moderate (Global SaaS exposure, including Australia) |
| Operational Risk | Moderate (Platform reliance on mobile app ecosystem) | Moderate (Diverse software portfolio; complexity in integration) |
| Environmental Risk | Low (Technology sector, limited direct impact) | Low (Software sector, limited direct impact) |
| Geopolitical Risk | Moderate (US-based with international operations) | Moderate (Australian HQ with global operations) |
In summary, AppLovin faces the most significant risks from market volatility and a high debt load, which could impact financial flexibility. Atlassian’s key risks stem from moderate debt and operational complexity but benefits from a more stable market profile. Both companies operate in sectors with relatively low environmental risk but must navigate geopolitical uncertainties given their international footprints. Investors should weigh these factors carefully, prioritizing risk tolerance and diversification.
Which Stock to Choose?
AppLovin Corporation (APP) shows a strong income evolution with a 224.53% revenue growth over 2020-2024 and a favorable net margin of 33.55%. Its ROE stands at a high 144.96%, supported by a slightly favorable overall financial ratios evaluation, despite some debt concerns and a solid “B” rating.
Atlassian Corporation (TEAM) displays steady revenue growth of 149.64% over 2021-2025 but suffers from an unfavorable net margin of -4.92% and negative profitability ratios. Its financial ratios are slightly unfavorable overall, with moderate debt levels and a “C” rating reflecting current challenges.
Given APP’s very favorable moat with growing ROIC exceeding WACC and stronger financial ratios, it might appeal more to growth-oriented investors. TEAM’s profile could be seen as more suited to those with tolerance for operational risks and seeking potential turnaround opportunities.
Disclaimer: Investment carries a risk of loss of initial capital. The past performance is not a reliable indicator of future results. Be sure to understand risks before making an investment decision.
Go Further
I encourage you to read the complete analyses of AppLovin Corporation and Atlassian Corporation to enhance your investment decisions: