AppLovin Corporation and Asana, Inc. are two prominent players in the software application industry, each driving innovation in distinct but overlapping markets—mobile app marketing and work management platforms. Both companies leverage technology to enhance productivity and user engagement, making them compelling choices for investors interested in tech growth. In this article, I will analyze their strengths and risks to help you decide which stock could be the more attractive addition to your portfolio.
Table of contents
Companies Overview
I will begin the comparison between AppLovin Corporation and Asana, Inc. by providing an overview of these two companies and their main differences.
AppLovin Overview
AppLovin Corporation develops a software platform aimed at mobile app developers to improve marketing and monetization globally. Its solutions include marketing software, analytics, and in-app bidding tools designed to optimize advertising inventory value through real-time auctions. Founded in 2011 and based in Palo Alto, California, AppLovin operates within the software application industry and targets advertisers and publishers.
Asana Overview
Asana, Inc. offers a work management platform that supports individuals and teams in organizing daily tasks and strategic initiatives. Its platform facilitates project management across industries such as technology, education, and healthcare. Incorporated in 2008 and headquartered in San Francisco, California, Asana operates in the software application sector, focusing on enhancing collaboration and workflow orchestration worldwide.
Key similarities and differences
Both AppLovin and Asana operate in the technology sector, specifically within software applications, serving clients internationally. While AppLovin focuses on marketing and monetization tools for mobile apps, Asana provides task and project management solutions for diverse industries. AppLovin’s business model centers on advertising technology, whereas Asana’s revolves around productivity software, highlighting distinct approaches within the broader software market.
Income Statement Comparison
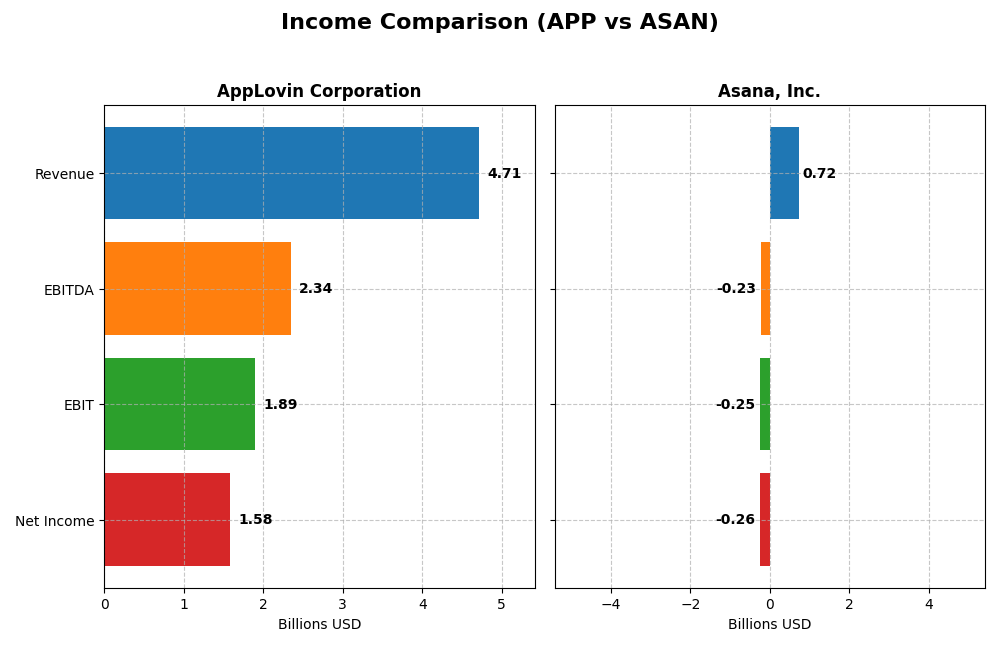
This table provides a side-by-side comparison of key income statement metrics for AppLovin Corporation and Asana, Inc. based on their most recent fiscal year financials.
| Metric | AppLovin Corporation | Asana, Inc. |
|---|---|---|
| Market Cap | 193B | 2.64B |
| Revenue | 4.71B | 724M |
| EBITDA | 2.34B | -230M |
| EBIT | 1.89B | -247M |
| Net Income | 1.58B | -256M |
| EPS | 4.68 | -1.11 |
| Fiscal Year | 2024 | 2025 |
Income Statement Interpretations
AppLovin Corporation
AppLovin’s revenue and net income have shown strong growth from 2020 to 2024, with revenue increasing from 1.45B to 4.71B and net income rising from a loss of 125M to a profit of 1.58B. Margins improved notably, with a gross margin of 75.22% and net margin of 33.55% in 2024. The latest year reflected accelerated growth, especially in EBIT and EPS, indicating robust profitability enhancement.
Asana, Inc.
Asana’s revenue grew steadily from 227M in 2021 to 724M in 2025, though net income remained negative, with a loss of 256M in 2025. Gross margin is strong at 89.34%, but EBIT and net margins remain unfavorable at -34.13% and -35.3%, respectively. The most recent year showed moderate revenue and gross profit growth, with slight improvements in net margin and EPS growth, but persistent operating losses.
Which one has the stronger fundamentals?
AppLovin demonstrates stronger fundamentals with significant positive net income growth, high and improving margins, and solid profitability metrics. Asana, despite favorable revenue expansion and gross margin, continues to post net losses and negative operating margins. AppLovin’s consistent margin improvements and profitability contrast with Asana’s ongoing challenges in controlling operating expenses relative to revenue.
Financial Ratios Comparison
Below is a comparison of key financial ratios for AppLovin Corporation (APP) and Asana, Inc. (ASAN) based on the most recent full fiscal year data available.
| Ratios | AppLovin Corporation (APP) 2024 | Asana, Inc. (ASAN) 2025 |
|---|---|---|
| ROE | 144.96% | -112.31% |
| ROIC | 38.70% | -53.03% |
| P/E | 69.06 | -19.16 |
| P/B | 100.11 | 21.52 |
| Current Ratio | 2.19 | 1.44 |
| Quick Ratio | 2.19 | 1.44 |
| D/E (Debt-to-Equity) | 3.26 | 1.18 |
| Debt-to-Assets | 60.59% | 30.11% |
| Interest Coverage | 5.89 | -72.42 |
| Asset Turnover | 0.80 | 0.81 |
| Fixed Asset Turnover | 23.71 | 2.76 |
| Payout ratio | 0% | 0% |
| Dividend yield | 0% | 0% |
Interpretation of the Ratios
AppLovin Corporation
AppLovin shows a mix of strong and weak ratios, with a favorable net margin of 33.55% and a very high return on equity of 144.96%, indicating effective profitability. However, concerns arise from its high debt-to-equity ratio of 3.26 and elevated debt-to-assets at 60.59%, which pose financial risk. The company does not pay dividends, reflecting a possible focus on reinvestment or growth.
Asana, Inc.
Asana’s ratios are mostly weak, with negative net margin (-35.3%) and return on equity (-112.31%), signaling poor profitability and operational challenges. The firm maintains a moderate current ratio of 1.44, but its interest coverage is negative, indicating difficulty servicing debt. Asana also does not pay dividends, likely due to ongoing losses and prioritizing growth and R&D investments.
Which one has the best ratios?
Based on the evaluations, AppLovin demonstrates a more favorable financial profile with half of its ratios positive, especially profitability metrics, despite some debt concerns. Asana’s ratios are predominantly unfavorable, reflecting weaker profitability and financial health. Thus, AppLovin’s ratios are comparatively stronger, while Asana’s present more risks.
Strategic Positioning
This section compares the strategic positioning of AppLovin Corporation and Asana, Inc., including market position, key segments, and exposure to technological disruption:
AppLovin Corporation
- Large market cap of $193B, operating in a competitive software platform industry with high beta volatility.
- Revenue driven by advertising ($3.2B) and apps ($1.5B), focusing on mobile app marketing and monetization platforms.
- Exposure to technological disruption through real-time bidding and analytics software innovations impacting app monetization.
Asana, Inc.
- Smaller market cap of $2.6B, also in software but with lower market volatility (beta ~0.9).
- Operates a work management platform targeting diverse industries, without detailed segment revenues disclosed.
- Faces disruption risks in collaborative work software, but specific technological impact details are not provided.
AppLovin Corporation vs Asana, Inc. Positioning
AppLovin shows a diversified revenue base with strong emphasis on advertising and app monetization, benefiting from scale. Asana’s focus on work management is more concentrated, serving multiple industries but lacking detailed segment revenue data, which may limit visibility on business drivers.
Which has the best competitive advantage?
AppLovin demonstrates a very favorable moat with growing ROIC well above WACC, indicating durable competitive advantages and efficient capital use. In contrast, Asana shows a very unfavorable moat with declining ROIC, signaling value destruction and weaker competitive positioning.
Stock Comparison
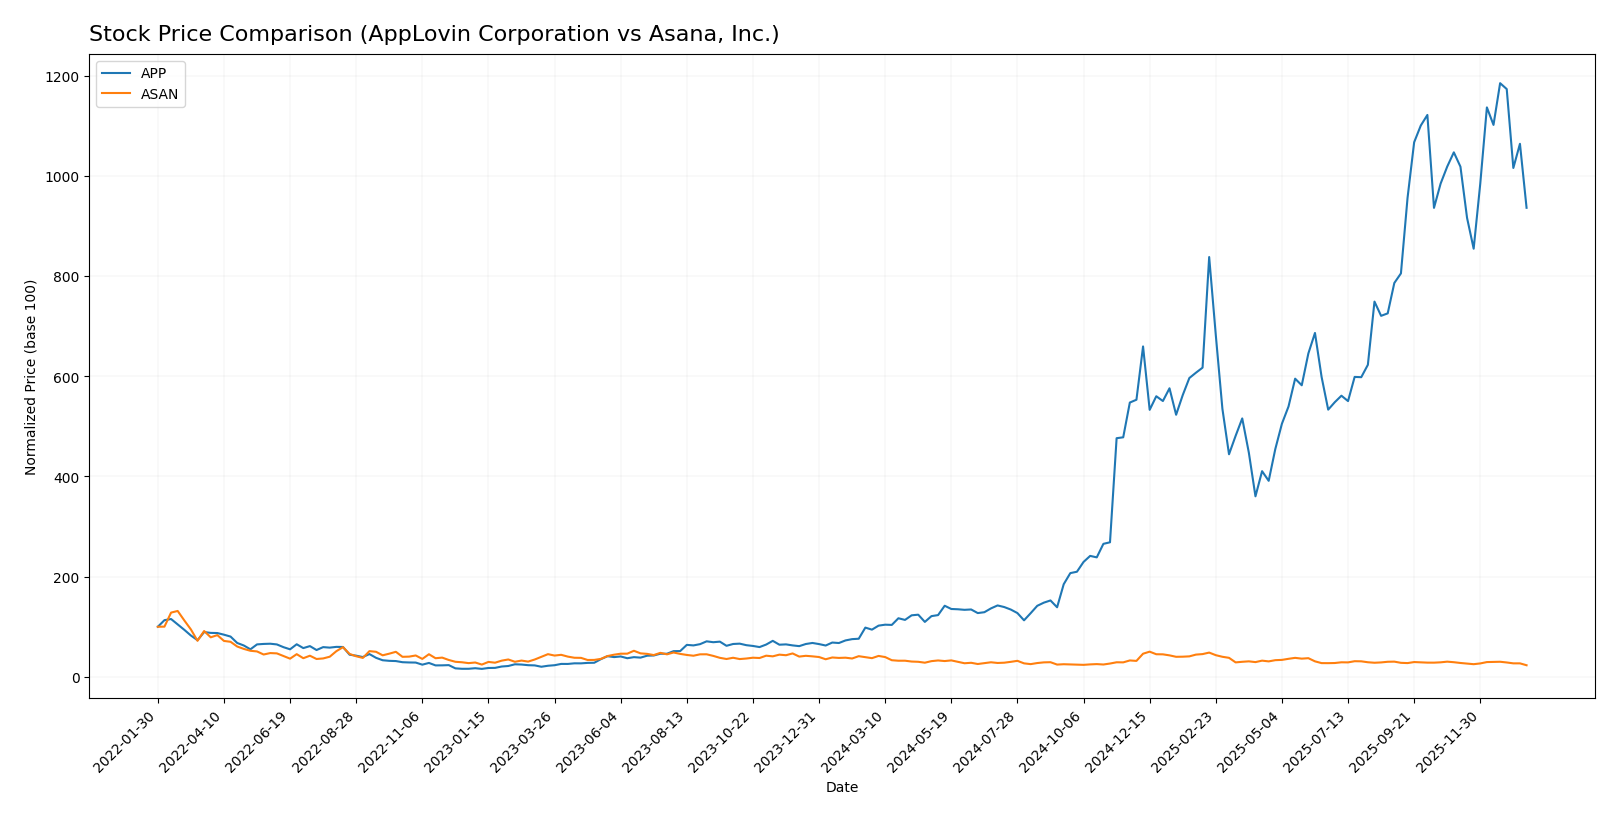
The stock price movements over the past 12 months reveal a sharply bullish trend for AppLovin Corporation contrasted with a bearish performance for Asana, Inc., highlighting divergent trading dynamics and investor sentiment.
Trend Analysis
AppLovin Corporation’s stock shows a strong bullish trend with an 893.1% price increase over the past year, though the trend is decelerating. Its volatility is high, with prices ranging from 57.39 to 721.37.
Asana, Inc.’s stock exhibits a bearish trend with a -37.9% price decline over the same period, also decelerating. The stock’s volatility is low, fluctuating between 11.14 and 24.15.
Comparing the two, AppLovin Corporation delivered substantially higher market performance over the past year, significantly outperforming Asana’s declining stock trend.
Target Prices
Analysts present a clear consensus on target prices for AppLovin Corporation and Asana, Inc., providing valuable guidance for investors.
| Company | Target High | Target Low | Consensus |
|---|---|---|---|
| AppLovin Corporation | 860 | 630 | 756.33 |
| Asana, Inc. | 18 | 14 | 15.75 |
The consensus target prices for both companies exceed their current stock prices, indicating analysts expect moderate to strong upside potential. This suggests cautious optimism in the technology application software sector.
Analyst Opinions Comparison
This section compares analysts’ ratings and grades for AppLovin Corporation and Asana, Inc.:
Rating Comparison
APP Rating
- Rating: B, considered very favorable
- Discounted Cash Flow Score: Moderate (3)
- ROE Score: Very favorable (5)
- ROA Score: Very favorable (5)
- Debt To Equity Score: Very unfavorable (1)
- Overall Score: Moderate (3)
ASAN Rating
- Rating: D+, also noted as very favorable
- Discounted Cash Flow Score: Very unfavorable (1)
- ROE Score: Very unfavorable (1)
- ROA Score: Very unfavorable (1)
- Debt To Equity Score: Very unfavorable (1)
- Overall Score: Very unfavorable (1)
Which one is the best rated?
Based strictly on the data, AppLovin holds higher scores for discounted cash flow, ROE, ROA, and overall financial metrics, despite both having very unfavorable debt-to-equity scores. Asana’s ratings and scores are uniformly lower.
Scores Comparison
The comparison of the Altman Z-Score and Piotroski Score for AppLovin and Asana is presented below:
AppLovin Scores
- Altman Z-Score: 30.7, indicating a safe zone with very low bankruptcy risk.
- Piotroski Score: 7, categorized as strong financial health.
Asana Scores
- Altman Z-Score: -0.27, indicating distress zone with high bankruptcy risk.
- Piotroski Score: 4, categorized as average financial health.
Which company has the best scores?
AppLovin shows a significantly higher Altman Z-Score in the safe zone and a stronger Piotroski Score compared to Asana’s distress zone Altman score and average Piotroski rating. Based on these scores, AppLovin demonstrates better financial strength.
Grades Comparison
Here is a comparison of recent grades assigned by reputable grading companies for AppLovin Corporation and Asana, Inc.:
AppLovin Corporation Grades
The table below summarizes recent grades assigned to AppLovin Corporation by major financial institutions.
| Grading Company | Action | New Grade | Date |
|---|---|---|---|
| Morgan Stanley | maintain | Overweight | 2026-01-13 |
| Wells Fargo | maintain | Overweight | 2026-01-08 |
| Jefferies | maintain | Buy | 2025-12-11 |
| Benchmark | maintain | Buy | 2025-12-11 |
| Citigroup | maintain | Buy | 2025-11-12 |
| Wells Fargo | maintain | Overweight | 2025-11-07 |
| Goldman Sachs | maintain | Neutral | 2025-11-07 |
| JP Morgan | maintain | Neutral | 2025-11-06 |
| Wedbush | maintain | Outperform | 2025-11-06 |
| Piper Sandler | maintain | Overweight | 2025-11-06 |
Overall, AppLovin has received predominantly positive grades, with multiple “Buy,” “Overweight,” and “Outperform” ratings maintained over recent months.
Asana, Inc. Grades
The following table shows recent grades assigned to Asana, Inc. by recognized financial firms.
| Grading Company | Action | New Grade | Date |
|---|---|---|---|
| Citigroup | upgrade | Buy | 2026-01-15 |
| RBC Capital | maintain | Underperform | 2026-01-05 |
| Keybanc | upgrade | Overweight | 2025-12-15 |
| DA Davidson | maintain | Neutral | 2025-12-04 |
| Citigroup | maintain | Neutral | 2025-12-03 |
| RBC Capital | maintain | Underperform | 2025-12-03 |
| UBS | maintain | Neutral | 2025-12-03 |
| Baird | maintain | Neutral | 2025-09-04 |
| Morgan Stanley | maintain | Underweight | 2025-09-04 |
| Piper Sandler | maintain | Overweight | 2025-09-04 |
Asana’s grades show a mixed pattern with some upgrades to “Buy” and “Overweight,” but also several “Neutral” and “Underperform” ratings maintained recently.
Which company has the best grades?
AppLovin Corporation has received consistently stronger grades with multiple “Buy” and “Overweight” ratings compared to Asana, which has a more mixed profile including “Underperform” and “Neutral” opinions. For investors, this suggests a relatively higher analyst confidence in AppLovin’s prospects, potentially reflecting lower perceived risk or better growth outlooks.
Strengths and Weaknesses
The table below compares key strengths and weaknesses of AppLovin Corporation (APP) and Asana, Inc. (ASAN) based on their diversification, profitability, innovation, global presence, and market share.
| Criterion | AppLovin Corporation (APP) | Asana, Inc. (ASAN) |
|---|---|---|
| Diversification | Strong: Revenue split between Advertising (3.22B) and Apps (1.49B), showing multiple income streams | Limited: Primarily focused on project management software, less diversified |
| Profitability | High: Net margin 33.55%, ROIC 38.7%, ROE 144.96%, consistently creating value with growing ROIC | Weak: Negative net margin (-35.3%), ROIC (-53.03%), ROE (-112.31%), shedding value with declining ROIC |
| Innovation | Strong: Demonstrates durable competitive advantage and high fixed asset turnover (23.71) | Moderate: Innovation presence but financials indicate challenges in profitability and growth |
| Global presence | Significant: Large advertising segment suggests broad market reach | Moderate: Focused mainly on SaaS market with limited global expansion evidence |
| Market Share | Solid: High profitability and diversified products support stable market position | Weak: Financial struggles and value destruction hint at limited market share growth |
Key takeaway: AppLovin stands out with strong profitability, diversification, and a durable competitive moat, making it a more resilient investment. In contrast, Asana faces significant profitability challenges and value erosion, signaling higher risk for investors.
Risk Analysis
Below is a comparison table highlighting key risk factors for AppLovin Corporation (APP) and Asana, Inc. (ASAN) based on their latest financial and market data.
| Metric | AppLovin Corporation (APP) | Asana, Inc. (ASAN) |
|---|---|---|
| Market Risk | High beta (2.5) indicates high volatility and sensitivity to market swings. | Lower beta (0.92) suggests moderate market risk exposure. |
| Debt Level | High debt-to-equity ratio (3.26) and debt-to-assets (60.6%) indicate substantial leverage risk. | Moderate debt-to-equity (1.18) and debt-to-assets (30.1%), representing manageable leverage. |
| Regulatory Risk | Moderate, typical for software industry with data privacy regulations impacting operations. | Moderate, similar sector risks with emphasis on data and compliance. |
| Operational Risk | Platform dependence on mobile app ecosystem; competitive industry pressure. | Reliance on SaaS adoption; competitive market with pressure on customer acquisition. |
| Environmental Risk | Low direct exposure; tech sector less impacted by environmental factors. | Low environmental impact from business operations. |
| Geopolitical Risk | Exposure to US and international markets; potential disruption from trade tensions. | Similar international exposure, but smaller market cap implies higher vulnerability. |
In synthesis, AppLovin faces significant market and financial leverage risks due to its high beta and heavy debt load, which could amplify losses in downturns. Asana exhibits moderate market risk but struggles with ongoing operational losses and a distressed credit profile, reflected in its low Altman Z-score. Investors should weigh AppLovin’s volatility and leverage against Asana’s financial instability and execution challenges when managing portfolio risk.
Which Stock to Choose?
AppLovin Corporation (APP) shows a strong income evolution with a 224.53% revenue growth over 2020-2024 and favorable profitability metrics, including a 33.55% net margin and 144.96% ROE. Despite high debt levels and some unfavorable valuation ratios, its overall financial ratios and rating remain slightly favorable with a “B” rating and a very favorable economic moat.
Asana, Inc. (ASAN) exhibits moderate revenue growth of 218.88% overall but suffers from negative profitability, including a -35.3% net margin and negative ROE. Its financial ratios are slightly unfavorable, marked by a “D+” rating and a very unfavorable moat due to declining ROIC and value destruction, combined with weaker solvency and earnings metrics.
Investors focused on sustainable profitability and strong competitive advantages may find APP’s profile more aligned with their goals, while those with a higher risk tolerance seeking growth with less emphasis on current profitability might consider ASAN’s metrics. Each stock’s appeal could vary significantly depending on the investor’s risk appetite and investment strategy.
Disclaimer: Investment carries a risk of loss of initial capital. The past performance is not a reliable indicator of future results. Be sure to understand risks before making an investment decision.
Go Further
I encourage you to read the complete analyses of AppLovin Corporation and Asana, Inc. to enhance your investment decisions: