Applied Materials, Inc. (AMAT) and Tower Semiconductor Ltd. (TSEM) are key players in the semiconductor industry, offering advanced manufacturing solutions and foundry services. Both companies drive innovation in chip production, serving diverse markets from consumer electronics to automotive. Their overlapping focus on cutting-edge technology and market expansion makes them prime candidates for comparison. In this article, I will help you decide which company presents the most compelling investment opportunity in 2026.
Table of contents
Companies Overview
I will begin the comparison between Applied Materials and Tower Semiconductor by providing an overview of these two companies and their main differences.
Applied Materials Overview
Applied Materials, Inc. specializes in manufacturing equipment, services, and software for the semiconductor, display, and related industries. Operating through three segments—Semiconductor Systems, Applied Global Services, and Display and Adjacent Markets—it develops and sells advanced technologies for semiconductor fabrication and display manufacturing. Headquartered in Santa Clara, California, it serves a global market including the US, Asia, and Europe, positioning itself as a major player in semiconductor equipment.
Tower Semiconductor Overview
Tower Semiconductor Ltd. is an independent semiconductor foundry focused on analog intensive mixed-signal semiconductor devices. It offers a variety of customizable process technologies and wafer fabrication services to integrated device manufacturers and fabless companies. The company serves diverse markets such as consumer electronics, automotive, aerospace, and medical devices. Founded in 1993 and based in Migdal Haemek, Israel, Tower operates internationally across the US, Japan, Asia, and Europe.
Key similarities and differences
Both companies operate in the semiconductor sector and serve global markets with advanced technologies. Applied Materials focuses on manufacturing equipment and services for semiconductor and display production, while Tower Semiconductor operates primarily as a foundry providing wafer fabrication and process technologies. Applied Materials has a significantly larger market cap and employee base, reflecting its broader scope and diversified segments compared to Tower’s more specialized foundry model.
Income Statement Comparison
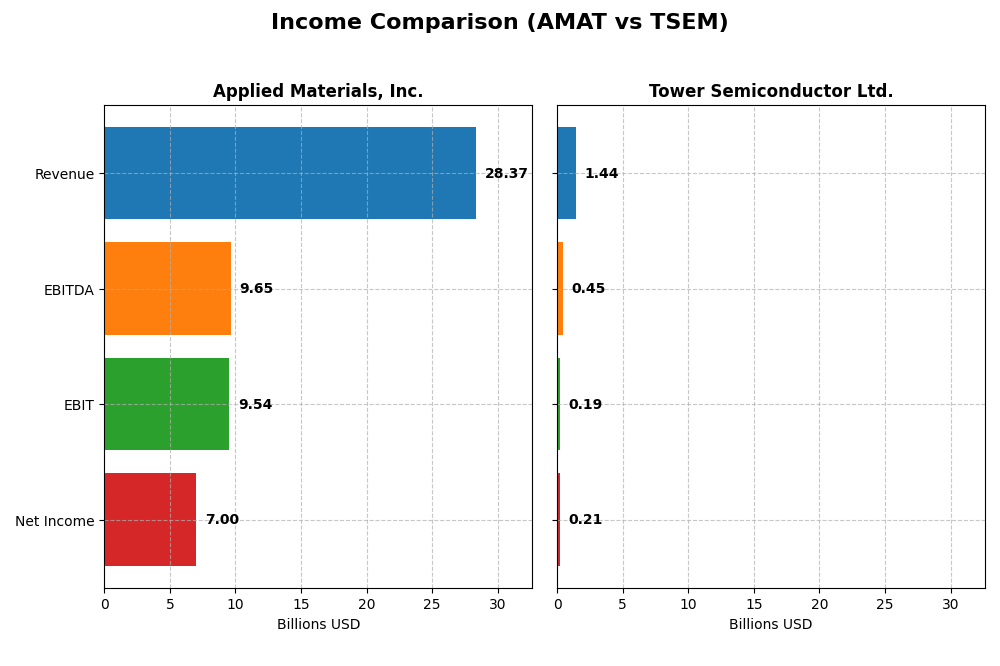
The table below compares key income statement metrics for Applied Materials, Inc. and Tower Semiconductor Ltd. based on their most recent fiscal year data.
| Metric | Applied Materials, Inc. (AMAT) | Tower Semiconductor Ltd. (TSEM) |
|---|---|---|
| Market Cap | 259.3B | 14.5B |
| Revenue | 28.4B | 1.44B |
| EBITDA | 9.65B | 451M |
| EBIT | 9.54B | 185M |
| Net Income | 7.00B | 208M |
| EPS | 8.71 | 1.87 |
| Fiscal Year | 2025 | 2024 |
Income Statement Interpretations
Applied Materials, Inc.
Applied Materials shows consistent revenue growth from $23.1B in 2021 to $28.4B in 2025, with net income rising from $5.9B to $7.0B. Margins remain robust, with a gross margin near 49% and net margin around 25%. In 2025, revenue growth slowed to 4.4%, and net margin declined slightly, yet operating efficiency improved, reflecting solid underlying profitability.
Tower Semiconductor Ltd.
Tower Semiconductor’s revenue increased from $1.27B in 2020 to $1.44B in 2024, with net income growing substantially from $82M to $208M. Margins are lower than Applied Materials but favorable, with a gross margin of 24% and net margin of 14.5% in 2024. However, the latest year saw a 0.9% revenue growth and a sharp net income decline, indicating challenges in maintaining profitability momentum.
Which one has the stronger fundamentals?
Applied Materials demonstrates stronger fundamentals through higher and more stable margins, combined with steady revenue and net income growth. Tower Semiconductor shows impressive net income growth over the longer term but faces recent margin compression and earnings volatility. Both companies have favorable income statement evaluations, yet Applied Materials displays a more consistent and resilient financial profile.
Financial Ratios Comparison
The table below presents key financial ratios for Applied Materials, Inc. (AMAT) and Tower Semiconductor Ltd. (TSEM) based on their most recent fiscal year data, providing a snapshot of their profitability, liquidity, leverage, and valuation metrics.
| Ratios | Applied Materials, Inc. (AMAT) FY 2025 | Tower Semiconductor Ltd. (TSEM) FY 2024 |
|---|---|---|
| ROE | 34.3% | 7.8% |
| ROIC | 21.96% | 6.41% |
| P/E | 26.58 | 27.54 |
| P/B | 9.11 | 2.16 |
| Current Ratio | 2.61 | 6.18 |
| Quick Ratio | 1.87 | 5.23 |
| D/E (Debt-to-Equity) | 0.35 | 0.07 |
| Debt-to-Assets | 19.4% | 5.9% |
| Interest Coverage | 30.8 | 32.6 |
| Asset Turnover | 0.78 | 0.47 |
| Fixed Asset Turnover | 5.54 | 1.11 |
| Payout Ratio | 19.8% | 0% |
| Dividend Yield | 0.74% | 0% |
Interpretation of the Ratios
Applied Materials, Inc.
Applied Materials exhibits strong profitability with a net margin of 24.67%, ROE at 34.28%, and ROIC of 21.96%, all favorable. Liquidity and leverage ratios are solid, though valuation multiples like PE at 26.58 and PB at 9.11 are less attractive. The company pays dividends with a 0.74% yield, but the payout is considered low and somewhat unfavorable in coverage and yield.
Tower Semiconductor Ltd.
Tower Semiconductor shows a favorable net margin of 14.47% but weaker profitability metrics such as a 7.83% ROE and a neutral 6.41% ROIC. Liquidity ratios are mixed, with a high current ratio flagged unfavorable but a good quick ratio. The company does not pay dividends, likely focusing on reinvestment and growth, reflecting its high capex to revenue ratio and prioritization of R&D.
Which one has the best ratios?
Applied Materials holds a more favorable overall ratio profile, with 64.29% favorable metrics versus 42.86% for Tower Semiconductor. Its stronger returns and balanced leverage outweigh some valuation concerns. Tower Semiconductor’s mixed ratios and lack of dividends suggest a more cautious view, making Applied Materials the company with the best ratio standing based on this data.
Strategic Positioning
This section compares the strategic positioning of Applied Materials, Inc. and Tower Semiconductor Ltd., including market position, key segments, and exposure to technological disruption:
Applied Materials, Inc.
- Leading global player in semiconductor equipment with high competitive pressure.
- Diverse segments: Semiconductor Systems, Global Services, Display; strong revenue drivers in fab equipment and services.
- Moderate exposure with advanced semiconductor manufacturing technologies and services.
Tower Semiconductor Ltd.
- Smaller independent foundry facing competitive challenges in analog mixed-signal markets.
- Focused on analog intensive mixed-signal devices and wafer fabrication for various industries.
- Exposure to technological disruption through customizable process technologies in niche markets.
Applied Materials, Inc. vs Tower Semiconductor Ltd. Positioning
Applied Materials pursues a diversified strategy across equipment, services, and displays, benefiting from scale but facing intense competition. Tower is more concentrated on analog mixed-signal foundry services, allowing niche specialization but with a narrower market scope.
Which has the best competitive advantage?
Applied Materials shows a slightly favorable moat by creating value despite declining profitability. Tower Semiconductor’s moat is slightly unfavorable, shedding value but improving profitability, indicating Applied Materials currently holds a stronger competitive advantage.
Stock Comparison
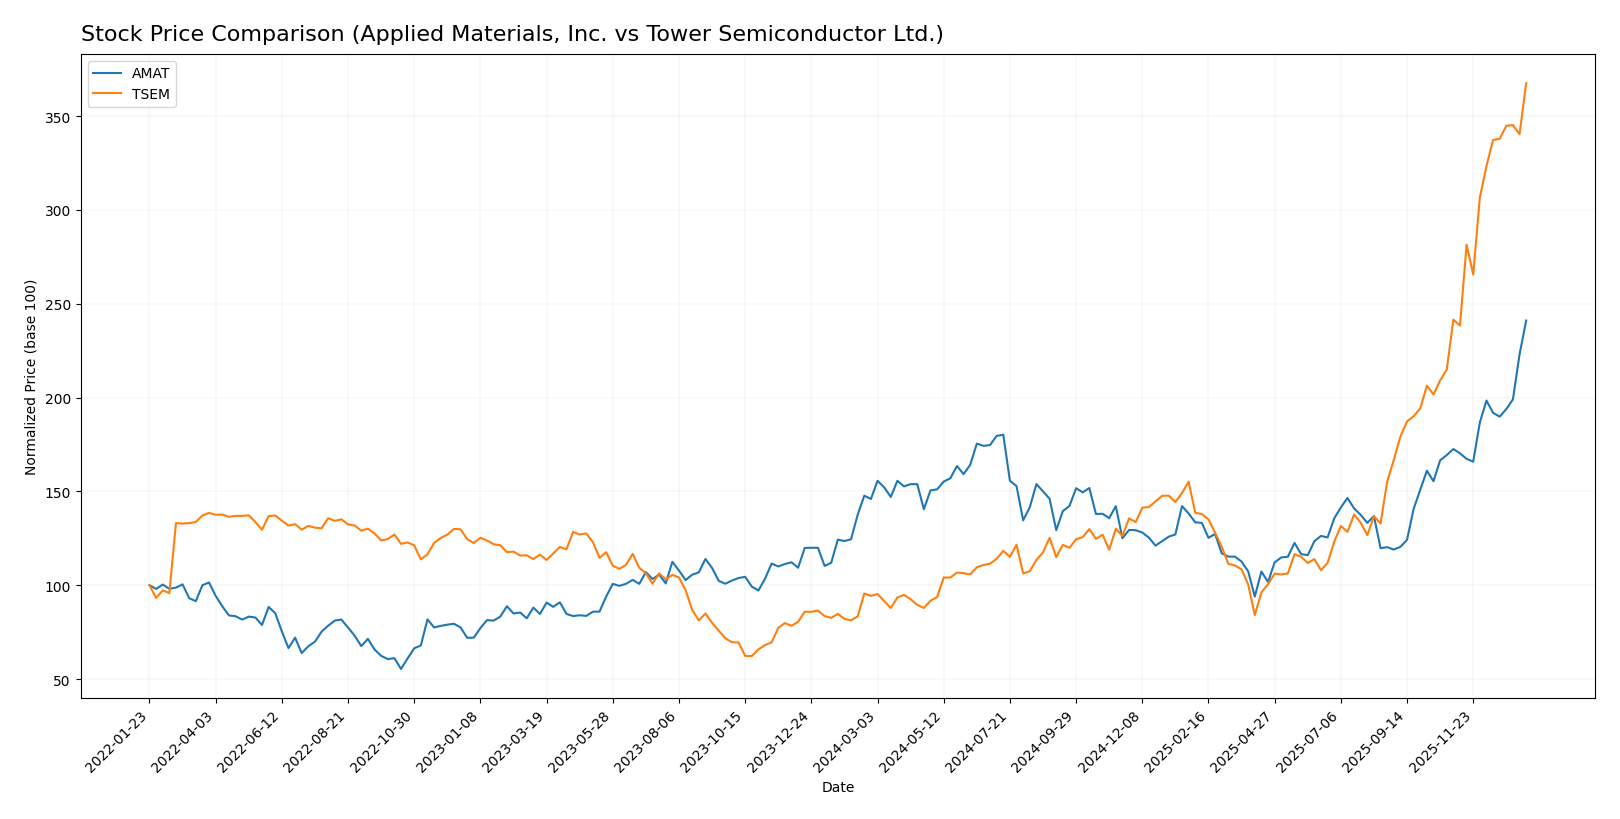
The stock price chart over the past 12 months reveals significant bullish momentum for both Applied Materials, Inc. (AMAT) and Tower Semiconductor Ltd. (TSEM), with notable accelerations in their upward trends and distinct trading volume dynamics.
Trend Analysis
Applied Materials, Inc. (AMAT) experienced a 65.15% price increase over the past year, indicating a bullish trend with accelerating momentum and a high price volatility measured by a 34.66 standard deviation. The stock reached a peak at 325.6 and a low of 126.95.
Tower Semiconductor Ltd. (TSEM) showed a stronger bullish trend, with a 289.57% price gain over the same period and accelerating upward momentum. Its price volatility is lower than AMAT’s, with a standard deviation of 23.85, and the stock traded between 29.65 and 129.61.
Comparing the two, TSEM delivered the highest market performance with a substantially larger price increase and stronger buyer dominance, outperforming AMAT in both price appreciation and recent trading activity.
Target Prices
Analysts present a clear consensus on target prices for Applied Materials, Inc. and Tower Semiconductor Ltd.
| Company | Target High | Target Low | Consensus |
|---|---|---|---|
| Applied Materials, Inc. | 400 | 273 | 323.43 |
| Tower Semiconductor Ltd. | 125 | 66 | 96 |
The target consensus for Applied Materials is slightly below its current price of 325.52 USD, suggesting limited upside, while Tower Semiconductor’s consensus target of 96 USD is well below its current price of 129.39 USD, indicating potential overvaluation or profit-taking risk.
Analyst Opinions Comparison
This section compares analysts’ ratings and grades for Applied Materials, Inc. (AMAT) and Tower Semiconductor Ltd. (TSEM):
Rating Comparison
AMAT Rating
- Rating: B+ with a very favorable status.
- Discounted Cash Flow Score: Moderate at 3, indicating average valuation.
- ROE Score: Very favorable at 5, showing strong profit generation from equity.
- ROA Score: Very favorable at 5, reflecting effective asset utilization.
- Debt To Equity Score: Moderate at 2, showing moderate financial risk.
- Overall Score: Moderate at 3, summarizing the company’s financial standing.
TSEM Rating
- Rating: B+ with a very favorable status.
- Discounted Cash Flow Score: Moderate at 3, indicating average valuation.
- ROE Score: Moderate at 3, showing average profit generation from equity.
- ROA Score: Favorable at 4, reflecting good asset utilization.
- Debt To Equity Score: Favorable at 4, indicating lower financial risk.
- Overall Score: Moderate at 3, summarizing the company’s financial standing.
Which one is the best rated?
Both AMAT and TSEM share the same overall rating of B+ and an overall score of 3. AMAT excels in ROE and ROA scores, while TSEM shows better debt-to-equity scores, indicating differing strengths in financial metrics but similar overall analyst evaluations.
Scores Comparison
Here is a comparison of the Altman Z-Score and Piotroski Score for Applied Materials, Inc. and Tower Semiconductor Ltd.:
AMAT Scores
- Altman Z-Score: 13.45, indicating a safe zone.
- Piotroski Score: 7, reflecting strong financial health.
TSEM Scores
- Altman Z-Score: 20.26, indicating a safe zone.
- Piotroski Score: 7, reflecting strong financial health.
Which company has the best scores?
Both AMAT and TSEM are in the safe zone for Altman Z-Score and have a strong Piotroski Score of 7. TSEM has a higher Altman Z-Score, suggesting slightly greater financial stability based on this metric.
Grades Comparison
Here is a detailed comparison of the recent grades assigned to Applied Materials, Inc. and Tower Semiconductor Ltd.:
Applied Materials, Inc. Grades
This table summarizes recent grades from recognized grading companies for Applied Materials:
| Grading Company | Action | New Grade | Date |
|---|---|---|---|
| B of A Securities | Maintain | Buy | 2026-01-13 |
| Susquehanna | Upgrade | Positive | 2026-01-12 |
| Cantor Fitzgerald | Maintain | Overweight | 2026-01-08 |
| B. Riley Securities | Maintain | Buy | 2025-12-18 |
| Mizuho | Maintain | Neutral | 2025-12-17 |
| Wells Fargo | Maintain | Overweight | 2025-12-15 |
| Jefferies | Maintain | Buy | 2025-12-15 |
| Keybanc | Maintain | Overweight | 2025-12-02 |
| UBS | Upgrade | Buy | 2025-11-25 |
| B. Riley Securities | Maintain | Buy | 2025-11-14 |
Overall, Applied Materials shows a consistently positive grading trend with multiple firms maintaining or upgrading to Buy and Overweight ratings.
Tower Semiconductor Ltd. Grades
This table presents recent grades from reputable grading companies for Tower Semiconductor:
| Grading Company | Action | New Grade | Date |
|---|---|---|---|
| Benchmark | Maintain | Buy | 2026-01-09 |
| Wedbush | Downgrade | Neutral | 2025-12-31 |
| Benchmark | Maintain | Buy | 2025-11-11 |
| Susquehanna | Maintain | Positive | 2025-11-11 |
| Wedbush | Maintain | Outperform | 2025-11-11 |
| Barclays | Maintain | Equal Weight | 2025-11-11 |
| Benchmark | Maintain | Buy | 2025-09-08 |
| Susquehanna | Maintain | Positive | 2025-08-05 |
| Benchmark | Maintain | Buy | 2025-08-05 |
| Benchmark | Maintain | Buy | 2025-08-04 |
Tower Semiconductor’s grades reveal a mixed but generally positive pattern, with some downgrades balanced by multiple Buy and Positive ratings.
Which company has the best grades?
Applied Materials holds a stronger consensus with more frequent Buy and Overweight ratings from major firms, suggesting a broadly positive outlook. Tower Semiconductor shows more variability with some Neutral and Equal Weight ratings, indicating relatively cautious sentiment. Investors may interpret these differences as variations in perceived risk and growth potential between the two companies.
Strengths and Weaknesses
Below is a comparison of Applied Materials, Inc. (AMAT) and Tower Semiconductor Ltd. (TSEM) based on key financial and strategic criteria as of 2026.
| Criterion | Applied Materials, Inc. (AMAT) | Tower Semiconductor Ltd. (TSEM) |
|---|---|---|
| Diversification | Highly diversified with three strong segments: Semiconductor Systems (~$19.9B in 2024), Applied Global Services (~$6.2B), and Display & Adjacent Markets (~$0.9B). | Less diversified; primarily focused on semiconductor manufacturing with limited segment data available. |
| Profitability | High profitability: Net margin 24.7%, ROE 34.3%, ROIC 22.0%, all favorable. | Moderate profitability: Net margin 14.5% favorable, but ROE weak at 7.8%, ROIC neutral at 6.4%. |
| Innovation | Strong innovation history supporting semiconductor systems growth, but ROIC trend is declining (-28%), indicating some profitability pressure. | Innovation improving with growing ROIC (+44.6%), yet overall value creation negative (ROIC below WACC). |
| Global presence | Global leader with broad international operations and service capabilities. | Smaller global footprint, more regional focus, limiting scale benefits. |
| Market Share | Leading market share in semiconductor equipment sector, driven by strong segment sales growth. | Smaller market share in niche semiconductor foundry space, constrained by competitive pressure. |
Key takeaways: AMAT shows strong diversification and robust profitability despite a declining ROIC trend, signaling cautious optimism. TSEM exhibits improving profitability metrics but remains a value destroyer with weaker market positioning and less diversification. Investors should weigh AMAT’s scale and innovation leadership against TSEM’s growth potential and risk profile.
Risk Analysis
Below is a comparison of key risks for Applied Materials, Inc. (AMAT) and Tower Semiconductor Ltd. (TSEM) based on the most recent data from 2025 and 2024 respectively:
| Metric | Applied Materials, Inc. (AMAT) | Tower Semiconductor Ltd. (TSEM) |
|---|---|---|
| Market Risk | High beta (1.671) indicates higher volatility and sensitivity to market swings. | Moderate beta (0.876) suggests lower market volatility exposure. |
| Debt level | Moderate debt-to-equity (0.35), debt-to-assets 19.4%, favorable interest coverage (35.46). | Low debt-to-equity (0.07), debt-to-assets 5.87%, strong interest coverage (31.57). |
| Regulatory Risk | Exposure to multiple regions including US, China, Korea; potential trade tensions and export controls. | Operates globally with Israel HQ; sensitive to geopolitical tensions in the Middle East and export regulations. |
| Operational Risk | Complex manufacturing processes with high dependence on technological innovation; 36K employees. | Smaller scale (5.6K employees), risks in maintaining advanced foundry capabilities and customer diversification. |
| Environmental Risk | Semiconductor manufacturing involves hazardous materials; increasing regulatory scrutiny on emissions and waste. | Similar environmental footprint but smaller scale; compliance costs still significant. |
| Geopolitical Risk | Significant exposure to Asia-Pacific trade dynamics and US-China tensions. | Higher geopolitical risk due to Israel location and regional instability. |
In synthesis, AMAT faces higher market and geopolitical risks due to its global scale and high beta, but maintains a strong financial position with manageable debt and operational expertise. TSEM benefits from low leverage but carries moderate market risk and elevated geopolitical exposure given its Israel base. Investors should weigh AMAT’s market volatility against TSEM’s regional geopolitical sensitivities. Both companies remain financially stable with strong scores mitigating bankruptcy risk.
Which Stock to Choose?
Applied Materials, Inc. (AMAT) shows favorable income evolution with a 23.0% revenue growth over 2021-2025 and strong profitability metrics, including a 24.67% net margin and a 34.28% ROE. Its debt levels are well-managed, supported by a favorable debt-to-equity ratio and a strong current ratio of 2.61. The overall rating is very favorable with a B+ grade, though some valuation multiples appear stretched.
Tower Semiconductor Ltd. (TSEM) reports positive income growth over the long term, with net income increasing by 152.56% since 2020, but recent yearly figures indicate less robust performance. It maintains low debt ratios and a very strong liquidity position, but profitability metrics like a 7.83% ROE are weaker. The rating is also B+ and very favorable, yet some valuation aspects remain neutral or unfavorable.
Considering ratings and financials, AMAT’s higher profitability and stronger income statement may appeal to investors focused on quality and stable returns, while TSEM’s improving profitability and strong liquidity could be attractive for those with a tolerance for variability seeking growth potential. Each stock’s profile suggests suitability depending on investor risk preference and strategy.
Disclaimer: Investment carries a risk of loss of initial capital. The past performance is not a reliable indicator of future results. Be sure to understand risks before making an investment decision.
Go Further
I encourage you to read the complete analyses of Applied Materials, Inc. and Tower Semiconductor Ltd. to enhance your investment decisions: