Home > Comparison > Technology > AMAT vs TXN
The strategic rivalry between Applied Materials, Inc. and Texas Instruments Incorporated shapes the semiconductor industry’s competitive landscape. Applied Materials operates as a capital-intensive manufacturer of semiconductor fabrication equipment, while Texas Instruments focuses on high-margin analog and embedded processing products. This analysis pits equipment innovation against product specialization, aiming to identify which company presents a superior risk-adjusted opportunity for a diversified technology portfolio.
Table of contents
Companies Overview
Applied Materials and Texas Instruments stand as pillars of the semiconductor industry, shaping global technology trends.
Applied Materials, Inc.: Semiconductor Equipment Innovator
Applied Materials dominates the semiconductor manufacturing equipment market. Its core revenue derives from selling advanced fabrication tools and services used in chip production. In 2026, the company focused strategically on expanding its semiconductor systems and global services to optimize fab performance across Asia and the U.S.
Texas Instruments Incorporated: Analog and Embedded Chip Leader
Texas Instruments excels in designing and manufacturing semiconductors, specializing in analog and embedded processing. Its primary revenue comes from power management and microcontroller products for diverse markets including industrial and automotive. The company’s 2026 strategy emphasized broadening its analog segment and embedded processor adoption globally.
Strategic Collision: Similarities & Divergences
Both firms operate within semiconductors but diverge sharply in business models—Applied Materials emphasizes manufacturing equipment, while Texas Instruments focuses on chip design and direct sales. Their competition centers on technological innovation, with Applied Materials targeting fabs and Texas Instruments aiming at end-product integration. This contrast defines their distinct investment profiles: equipment capital intensity versus product-driven market penetration.
Income Statement Comparison
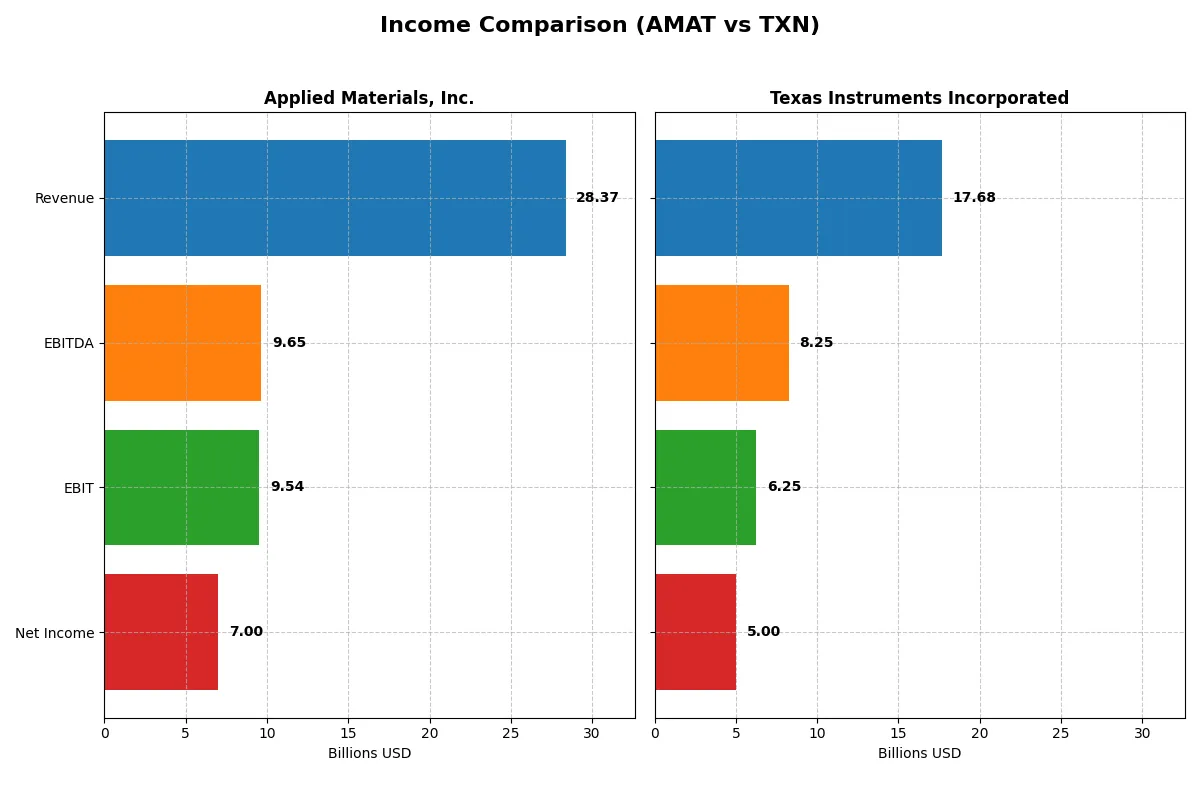
The following data dissects the core profitability and scalability of both corporate engines to reveal who dominates the bottom line:
| Metric | Applied Materials, Inc. (AMAT) | Texas Instruments Incorporated (TXN) |
|---|---|---|
| Revenue | 28.4B | 17.7B |
| Cost of Revenue | 14.6B | 7.6B |
| Operating Expenses | 5.52B | 4.06B |
| Gross Profit | 13.8B | 10.1B |
| EBITDA | 9.65B | 8.25B |
| EBIT | 9.54B | 6.25B |
| Interest Expense | 269M | 543M |
| Net Income | 7.00B | 5.00B |
| EPS | 8.71 | 5.45 |
| Fiscal Year | 2025 | 2025 |
Income Statement Analysis: The Bottom-Line Duel
This income statement comparison reveals how Applied Materials and Texas Instruments convert revenue into profit, exposing their underlying operational efficiency.
Applied Materials, Inc. Analysis
Applied Materials’ revenue grew steadily from $23B in 2021 to $28.4B in 2025. Net income rose from $5.9B to $7B, reflecting solid profitability. Gross margins hold favorably at 48.7%, while net margins remain strong near 24.7%. In 2025, EBIT growth of 13.6% signals operational momentum despite a slight dip in net margin.
Texas Instruments Incorporated Analysis
Texas Instruments’ revenue peaked at $20B in 2022 but declined to $17.7B in 2025. Net income also fell sharply from $7.7B to $5B over five years. Gross margin at 57% and net margin at 28.3% outperform AMAT, but revenue and net income contraction raise caution. The latest year shows a 13% top-line recovery but a 7.8% net margin decline.
Margin Strength vs. Revenue Growth Resilience
Applied Materials exhibits steady revenue and net income growth with improving operational efficiency. Texas Instruments boasts superior margins but struggles with shrinking revenue and net income over the period. For investors, AMAT’s growth trajectory suggests a more resilient earnings engine, while TXN’s margin profile favors those focused on profitability in a mature cycle.
Financial Ratios Comparison
These vital ratios act as a diagnostic tool to expose the underlying fiscal health, valuation premiums, and capital efficiency of these two semiconductor equipment leaders:
| Ratios | Applied Materials, Inc. (AMAT) | Texas Instruments Incorporated (TXN) |
|---|---|---|
| ROE | 34.3% | 30.7% |
| ROIC | 21.9% | 16.5% |
| P/E | 26.6 | 31.5 |
| P/B | 9.11 | 9.69 |
| Current Ratio | 2.61 | 4.35 |
| Quick Ratio | 1.87 | 2.83 |
| D/E | 0.35 | 0.86 |
| Debt-to-Assets | 19.4% | 40.6% |
| Interest Coverage | 30.8 | 11.1 |
| Asset Turnover | 0.78 | 0.51 |
| Fixed Asset Turnover | 5.54 | 1.44 |
| Payout Ratio | 19.8% | 100.0% |
| Dividend Yield | 0.74% | 3.17% |
| Fiscal Year | 2025 | 2025 |
Efficiency & Valuation Duel: The Vital Signs
Financial ratios act as a company’s DNA, uncovering hidden risks and exposing its operational efficiency in complex market environments.
Applied Materials, Inc.
Applied Materials displays robust profitability with a 34.3% ROE and a strong 24.7% net margin, signaling operational excellence. Its valuation appears stretched, with a 26.6 P/E and a high 9.11 P/B ratio. The company maintains a conservative capital structure and a modest 0.74% dividend yield, opting to reinvest heavily in R&D for growth.
Texas Instruments Incorporated
Texas Instruments posts solid returns with a 30.7% ROE and a superior 28.3% net margin, yet trades at a premium P/E of 31.5 and a lofty 9.69 P/B ratio. The firm’s higher dividend yield of 3.17% rewards shareholders directly, supported by a healthy quick ratio despite a heavier debt load and a slightly lower ROIC at 16.5%.
Valuation Stretch vs. Operational Strength
Applied Materials balances superior returns on equity and invested capital against a high valuation but benefits from strong liquidity and reinvestment focus. Texas Instruments offers higher dividend income and a favorable net margin but carries more leverage and a premium multiple. Investors prioritizing growth may prefer Applied Materials, while income-focused profiles might lean toward Texas Instruments.
Which one offers the Superior Shareholder Reward?
I see Applied Materials (AMAT) offers a modest dividend yield near 0.78% with a sustainable payout ratio around 17%. It pairs this with steady buybacks, supporting total returns without overleveraging. Texas Instruments (TXN) delivers a much higher yield of about 3.17%, but its payout ratio nears 100%, signaling limited room for dividend growth and weak free cash flow coverage. TXN’s buybacks are less efficient, constrained by heavy capex and debt levels. Historically, I’ve observed that AMAT’s balanced distribution and strong free cash flow sustainability position it as the superior total return candidate in 2026.
Comparative Score Analysis: The Strategic Profile
The radar chart reveals the fundamental DNA and trade-offs of Applied Materials, Inc. and Texas Instruments Incorporated, highlighting their financial strengths and weaknesses:
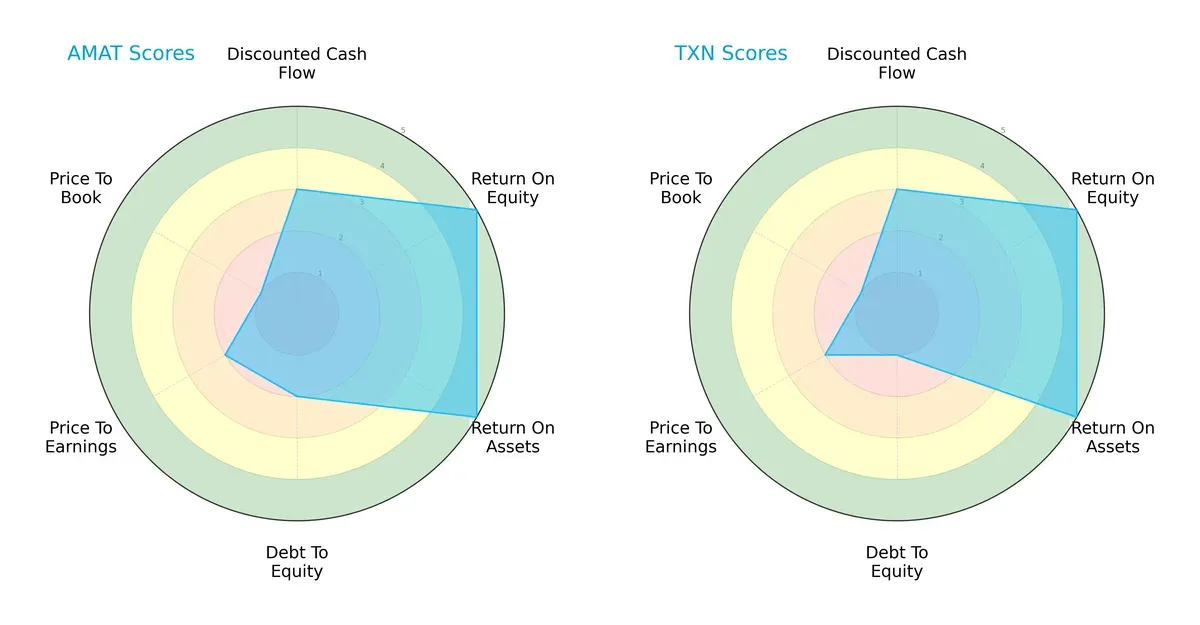
Both firms deliver strong profitability, boasting identical ROE and ROA scores of 5, signaling excellent capital and asset efficiency. They share moderate DCF scores of 3, indicating similar valuation expectations. However, Texas Instruments holds a safer debt profile with a Debt/Equity score of 1 versus Applied Materials’ 2, reflecting a more conservative capital structure. Both companies face valuation challenges, with low Price-to-Book scores (1) and modest Price-to-Earnings scores (2). Applied Materials appears slightly less balanced due to its higher leverage risk but compensates with robust operational returns.
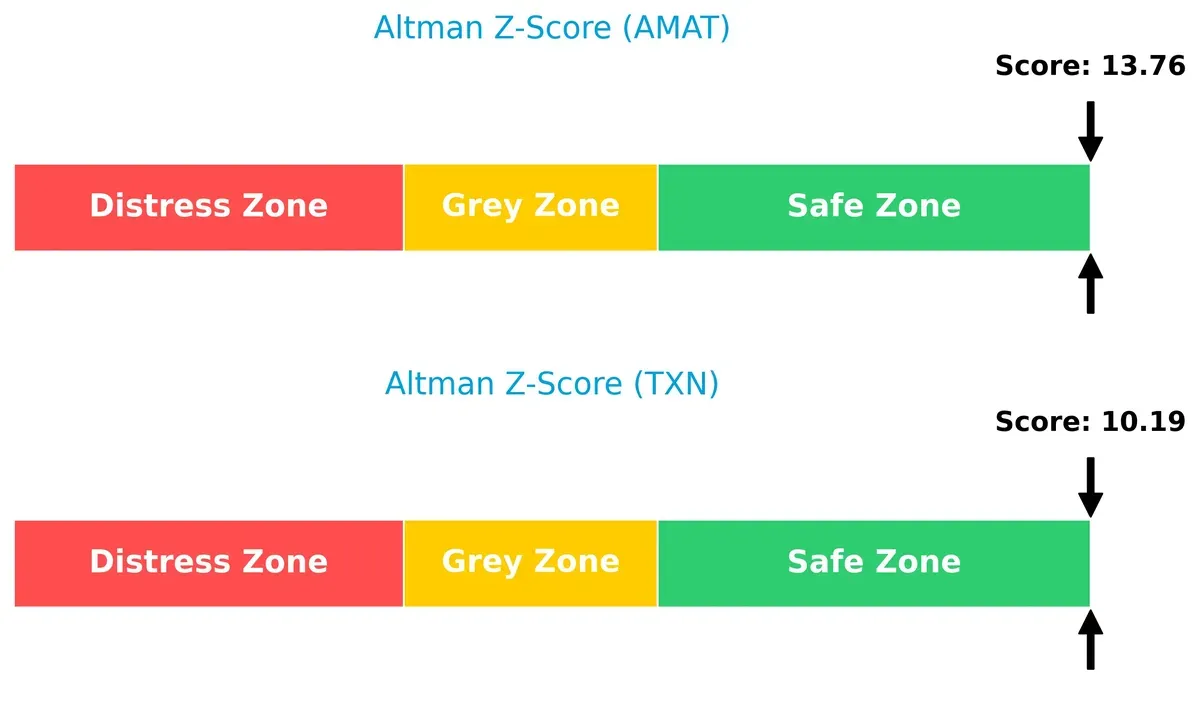
Bankruptcy Risk: Solvency Showdown
The Altman Z-Scores place both Applied Materials (13.76) and Texas Instruments (10.19) deep in the safe zone, affirming strong financial stability and low bankruptcy risk amid current market cycles:
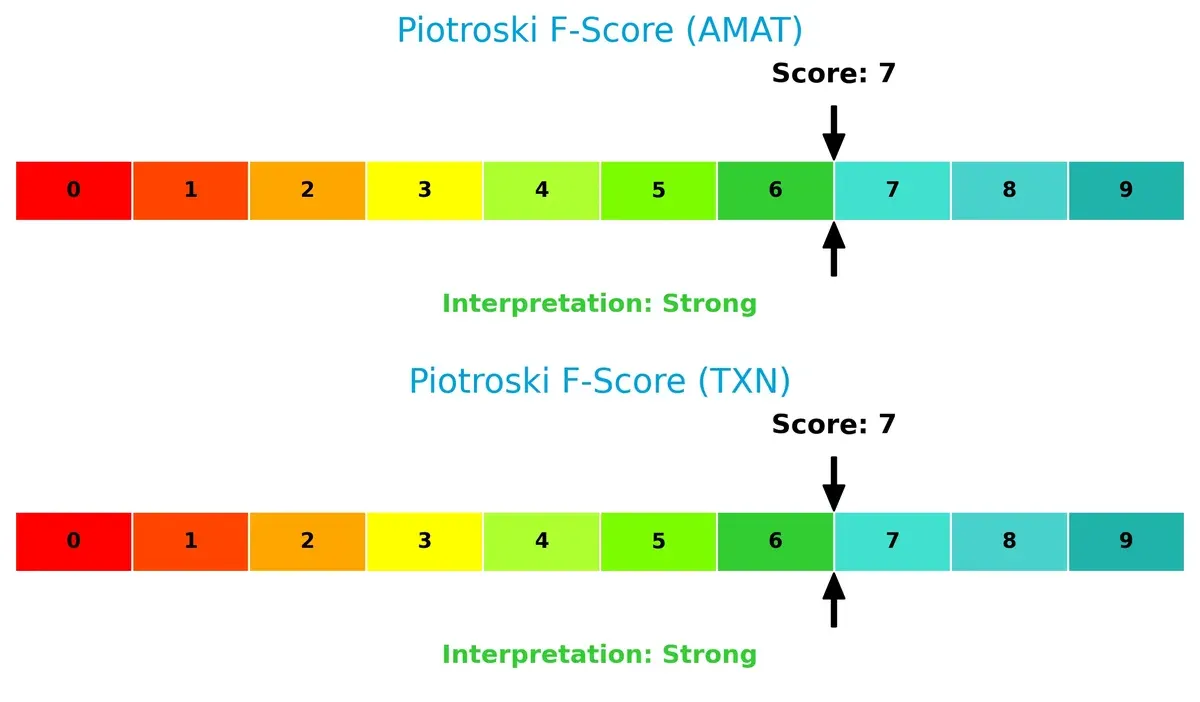
Financial Health: Quality of Operations
Both companies share a Piotroski F-Score of 7, indicating strong financial health. Neither shows red flags, but neither reaches peak strength, suggesting room for operational improvements:
How are the two companies positioned?
This section dissects the operational DNA of AMAT and TXN by comparing their revenue distribution and internal dynamics. The goal is to confront their economic moats to reveal which model offers superior resilience and sustainability today.
Revenue Segmentation: The Strategic Mix
This visual comparison dissects how Applied Materials and Texas Instruments diversify their income streams and where their primary sector bets lie:
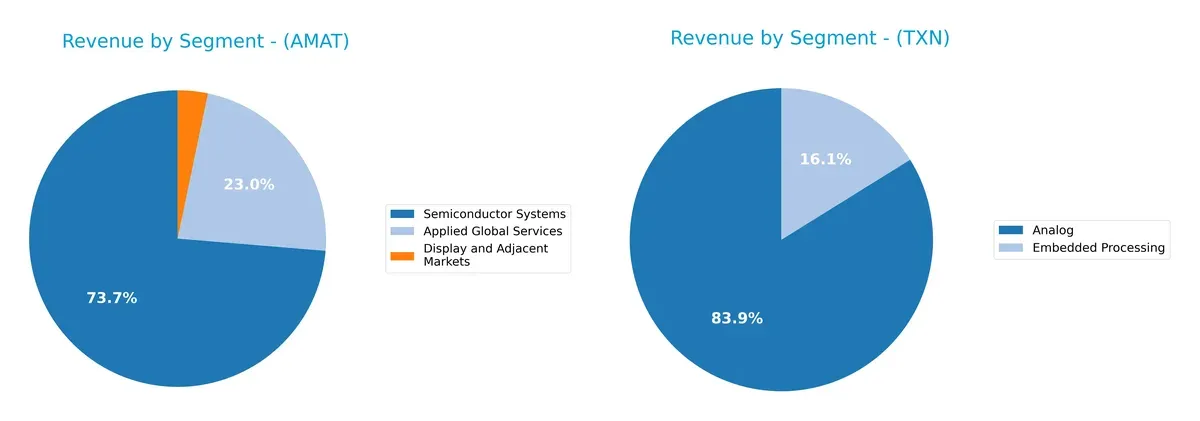
Applied Materials pivots heavily on its Semiconductor Systems segment at $19.9B in 2024, anchoring its revenue with a dominant technological moat. Applied Global Services adds $6.2B, providing diversification but with less scale. Conversely, Texas Instruments relies mainly on its Analog segment at $14B, with Embedded Processing contributing $2.7B. TI’s narrower base signals concentration risk but benefits from infrastructure dominance in analog chips. AMAT’s broader mix reduces vulnerability to single-market shifts.
Strengths and Weaknesses Comparison
This table compares the strengths and weaknesses of Applied Materials and Texas Instruments based on key financial and market metrics:
Applied Materials Strengths
- Strong profitability with 24.7% net margin and 34.3% ROE
- Robust liquidity ratios: current ratio 2.61, quick ratio 1.87
- Low debt-to-assets at 19.4% and high interest coverage of 35.5x
- High fixed asset turnover at 5.54 indicates efficient capital use
- Broad global presence with significant revenues from China and Korea
Texas Instruments Strengths
- Highest net margin at 28.3% and solid ROE of 30.7%
- Low WACC at 8.13%, enhancing capital efficiency
- Favorable quick ratio at 2.83 and dividend yield of 3.17%
- Diversified revenue streams with Analog and Embedded Processing
- Strong U.S. market presence with $6.76B revenue and balanced Asia exposure
Applied Materials Weaknesses
- Elevated WACC at 11.37%, potentially increasing capital costs
- High P/E of 26.6 and P/B of 9.11 suggest premium valuation
- Moderate asset turnover at 0.78 limits asset utilization
- Low dividend yield of 0.74% may deter income-focused investors
Texas Instruments Weaknesses
- Unfavorable current ratio at 4.35 may indicate inefficient asset use
- Higher debt-to-equity ratio (0.86) and debt-to-assets (40.6%) raise leverage concerns
- Less efficient fixed asset turnover at 1.44
- Premium valuation indicated by P/E of 31.5 and P/B of 9.69
Applied Materials excels in liquidity and capital efficiency, supported by a diversified global footprint. Texas Instruments shows superior profitability and attractive dividend yield but carries higher leverage and valuation risks. These factors shape their distinct strategic profiles in the semiconductor sector.
The Moat Duel: Analyzing Competitive Defensibility
A structural moat is the only true shield guarding long-term profits from relentless competitive erosion. Here’s how Applied Materials and Texas Instruments stack up:
Applied Materials, Inc.: Technological Innovation & Scale Moat
Applied Materials leverages cutting-edge manufacturing equipment and integrated services, reflected in solid 33.6% EBIT margins and consistent value creation (ROIC > WACC by 10.6%). Its expansive global footprint, especially in China and Korea, and ongoing investments in adjacent markets deepen this moat. However, a declining ROIC trend signals caution for sustaining profitability in 2026.
Texas Instruments Incorporated: Cost Leadership & Diversified Analog Moat
Texas Instruments dominates with a high 57% gross margin and efficient capital use (ROIC > WACC by 8.4%), driven by its analog and embedded processing segments. Unlike Applied Materials, TI’s moat centers on cost advantage and product diversification, enabling margin resilience. Yet, its sharper ROIC decline warns of margin pressure amid evolving semiconductor cycles and market shifts in 2026.
Technology Titans’ Moat Clash: Innovation Scale vs. Cost Leadership
Both firms create value above cost of capital but face declining ROICs. Applied Materials’ technology-driven scale moat is broader, while Texas Instruments excels in cost efficiency and product breadth. I see Applied Materials better positioned to defend market share through innovation and expanding global reach.
Which stock offers better returns?
Over the past 12 months, both Applied Materials and Texas Instruments showed strong upward price movements, with Applied Materials exhibiting higher volatility and accelerating gains.
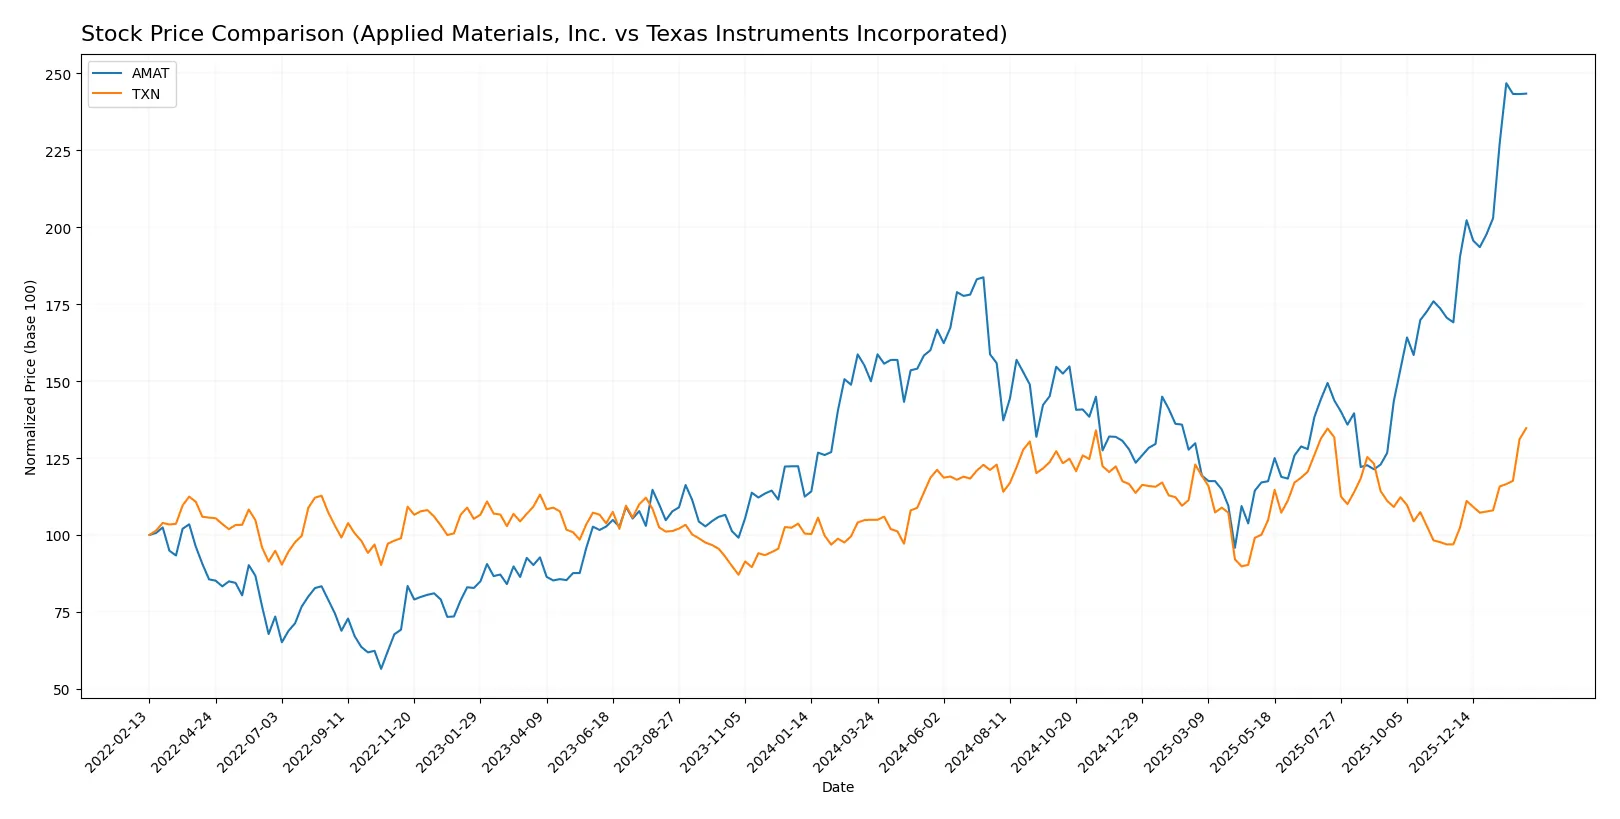
Trend Comparison
Applied Materials gained 62.35% over the past year, marking a bullish trend with accelerating momentum and a high volatility of 40.87%. It reached a peak price of 327.01.
Texas Instruments rose 28.36% in the same period, also bullish with acceleration, but lower volatility at 16.2%. Its highest price reached 221.44 during the year.
Applied Materials outperformed Texas Instruments with a stronger price increase and higher volatility, delivering superior market performance over the past year.
Target Prices
The consensus target prices reflect analysts’ balanced optimism on Applied Materials and Texas Instruments.
| Company | Target Low | Target High | Consensus |
|---|---|---|---|
| Applied Materials, Inc. | 290 | 405 | 360.56 |
| Texas Instruments Incorporated | 160 | 260 | 204.64 |
Applied Materials trades below its consensus target of 360.56, suggesting upside potential versus its current price of 322.51. Texas Instruments also trades above its consensus target of 204.64, indicating more cautious market expectations around its 221.44 price.

Don’t Let Luck Decide Your Entry Point
Optimize your entry points with our advanced ProRealTime indicators. You’ll get efficient buy signals with precise price targets for maximum performance. Start outperforming now!
How do institutions grade them?
Applied Materials, Inc. Grades
The following table summarizes recent grades issued by notable investment banks for Applied Materials:
| Grading Company | Action | New Grade | Date |
|---|---|---|---|
| Citigroup | Maintain | Buy | 2026-02-04 |
| Morgan Stanley | Maintain | Overweight | 2026-02-02 |
| Mizuho | Upgrade | Outperform | 2026-01-28 |
| Deutsche Bank | Upgrade | Buy | 2026-01-23 |
| Needham | Maintain | Buy | 2026-01-20 |
| Keybanc | Maintain | Overweight | 2026-01-16 |
| Wells Fargo | Maintain | Overweight | 2026-01-15 |
| Barclays | Upgrade | Overweight | 2026-01-15 |
| Stifel | Maintain | Buy | 2026-01-14 |
| B of A Securities | Maintain | Buy | 2026-01-13 |
Texas Instruments Incorporated Grades
Below is the recent grading summary from recognized financial institutions for Texas Instruments:
| Grading Company | Action | New Grade | Date |
|---|---|---|---|
| Rosenblatt | Maintain | Buy | 2026-02-05 |
| Rosenblatt | Maintain | Buy | 2026-01-28 |
| Goldman Sachs | Maintain | Sell | 2026-01-28 |
| Deutsche Bank | Maintain | Hold | 2026-01-28 |
| Keybanc | Maintain | Overweight | 2026-01-28 |
| Stifel | Maintain | Hold | 2026-01-28 |
| Benchmark | Maintain | Buy | 2026-01-28 |
| Jefferies | Maintain | Hold | 2026-01-28 |
| B of A Securities | Upgrade | Neutral | 2026-01-28 |
| Wells Fargo | Maintain | Equal Weight | 2026-01-28 |
Which company has the best grades?
Applied Materials consistently receives strong buy and overweight ratings, including multiple upgrades. Texas Instruments shows mixed ratings with notable holds and a sell from Goldman Sachs. Investors may perceive Applied Materials as having more robust institutional confidence.
Risks specific to each company
The following categories identify the critical pressure points and systemic threats facing both Applied Materials, Inc. and Texas Instruments Incorporated in the 2026 market environment:
1. Market & Competition
Applied Materials, Inc.
- Faces intense rivalry in semiconductor equipment with rapid tech cycles; must innovate continuously to maintain moats.
Texas Instruments Incorporated
- Competes in analog and embedded processing markets with pressure to diversify and sustain pricing power.
2. Capital Structure & Debt
Applied Materials, Inc.
- Maintains low debt-to-equity (0.35) and strong interest coverage (35.46), signaling prudent capital structure.
Texas Instruments Incorporated
- Higher leverage (debt-to-equity 0.86) increases financial risk despite adequate interest coverage (11.52).
3. Stock Volatility
Applied Materials, Inc.
- Beta of 1.677 suggests higher stock price volatility, reflecting sensitivity to semiconductor cycles.
Texas Instruments Incorporated
- Beta near 1.0 indicates stable stock performance relative to market benchmarks.
4. Regulatory & Legal
Applied Materials, Inc.
- Operates globally, exposing it to complex trade regulations and export controls, especially in Asia-Pacific.
Texas Instruments Incorporated
- Also global, but with a diversified product base possibly reducing regulatory concentration risk.
5. Supply Chain & Operations
Applied Materials, Inc.
- Relies on advanced manufacturing equipment supply chains that are vulnerable to component shortages.
Texas Instruments Incorporated
- Faces similar supply chain risks, but its analog focus may offer more operational resilience.
6. ESG & Climate Transition
Applied Materials, Inc.
- Must manage energy-intensive manufacturing and sustainability demands amid rising ESG scrutiny.
Texas Instruments Incorporated
- Has opportunity to leverage energy-efficient analog products to align with climate transition trends.
7. Geopolitical Exposure
Applied Materials, Inc.
- Significant exposure to geopolitical tensions in China and Taiwan impacting supply and sales.
Texas Instruments Incorporated
- Similar exposure, though diversified end markets may mitigate concentrated geopolitical risk.
Which company shows a better risk-adjusted profile?
Applied Materials faces the highest risk from market volatility and geopolitical tensions in its global footprint. Texas Instruments’ biggest risk lies in its elevated leverage and capital structure vulnerability. Despite AMAT’s higher stock volatility, its robust capital management and stronger interest coverage provide a more balanced risk profile. TXN’s higher debt-to-equity ratio and moderate interest coverage raise red flags for financial stability. Recent ratio data underscores AMAT’s superior liquidity and lower leverage, justifying greater confidence in its risk-adjusted standing.
Final Verdict: Which stock to choose?
Applied Materials stands out as a powerhouse of operational efficiency and capital returns. Its ability to generate robust ROIC well above WACC signals strong value creation, despite a recent dip in profitability. This makes it a fit for investors seeking aggressive growth with a tolerance for cyclical swings.
Texas Instruments offers a strategic moat through its recurring revenue model and strong gross margins. Its safety profile, marked by a high current ratio and stable cash flows, contrasts with Applied’s more volatile profile. TXN suits portfolios favoring growth at a reasonable price with a preference for financial stability.
If you prioritize high capital efficiency and potential for aggressive growth, Applied Materials outshines due to superior value creation and operational leverage. However, if you seek steadier returns with a defensive tilt, Texas Instruments offers better stability and a more resilient balance sheet, despite a slower growth trajectory.
Disclaimer: Investment carries a risk of loss of initial capital. The past performance is not a reliable indicator of future results. Be sure to understand risks before making an investment decision.
Go Further
I encourage you to read the complete analyses of Applied Materials, Inc. and Texas Instruments Incorporated to enhance your investment decisions: