Home > Comparison > Technology > AMAT vs TER
The strategic rivalry between Applied Materials, Inc. and Teradyne, Inc. shapes the semiconductor industry’s evolution. Applied Materials operates as a capital-intensive equipment manufacturer, supplying fabrication tools and services. Teradyne, by contrast, focuses on high-precision automatic test equipment and industrial automation with a lighter asset base. This analysis pits manufacturing scale against specialized innovation to identify which model offers superior risk-adjusted returns for diversified portfolios navigating technology sector volatility.
Table of contents
Companies Overview
Applied Materials and Teradyne both play pivotal roles in the semiconductor equipment sector, shaping chip manufacturing and testing.
Applied Materials, Inc.: Semiconductor Manufacturing Equipment Leader
Applied Materials dominates the semiconductor equipment market with manufacturing systems crucial for chip fabrication. Its revenue stems from advanced deposition, etching, and inspection technologies. In 2026, Applied Materials focuses strategically on expanding its Semiconductor Systems segment alongside global services to optimize fab productivity and support diverse display technologies.
Teradyne, Inc.: Automatic Test Equipment Specialist
Teradyne leads in automatic test equipment used for semiconductor wafer and device package validation. It generates revenue through test platforms serving automotive, industrial, and wireless sectors. Teradyne’s 2026 strategy emphasizes innovation in automated testing and industrial robotics, targeting the growing complexity of chip validation and manufacturing automation.
Strategic Collision: Similarities & Divergences
Both companies operate in the semiconductor equipment industry but diverge in focus: Applied Materials invests in fabrication machinery, while Teradyne specializes in testing and automation. Their primary battleground lies in supporting semiconductor makers’ drive for efficiency and precision. Investors will find distinct profiles: Applied Materials offers scale with integrated solutions; Teradyne provides niche expertise in validation and automation technologies.
Income Statement Comparison
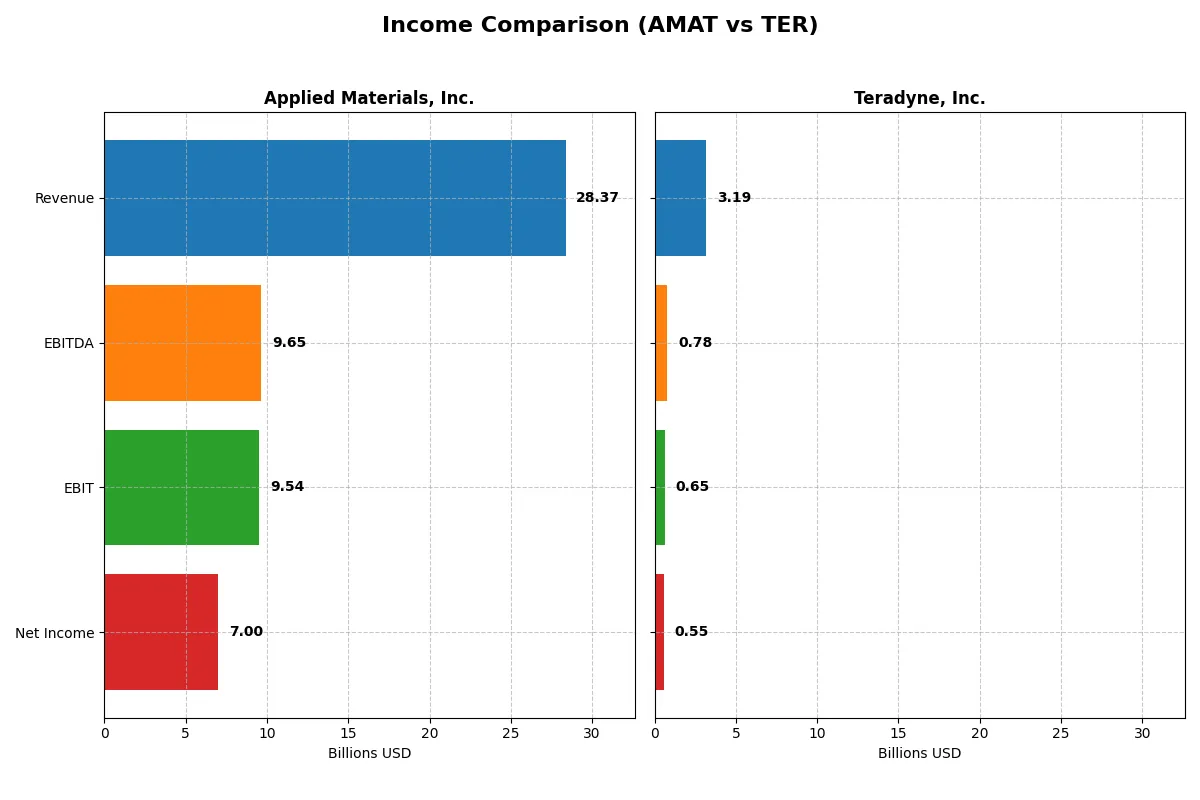
The following data dissects the core profitability and scalability of both corporate engines to reveal who dominates the bottom line:
| Metric | Applied Materials, Inc. (AMAT) | Teradyne, Inc. (TER) |
|---|---|---|
| Revenue | 28.4B | 3.19B |
| Cost of Revenue | 14.6B | 1.32B |
| Operating Expenses | 5.52B | 1.17B |
| Gross Profit | 13.8B | 1.87B |
| EBITDA | 9.65B | 780M |
| EBIT | 9.54B | 653M |
| Interest Expense | 269M | 8M |
| Net Income | 7.00B | 554M |
| EPS | 8.71 | 3.49 |
| Fiscal Year | 2025 | 2025 |
Income Statement Analysis: The Bottom-Line Duel
This income statement comparison exposes which company runs a more efficient and profitable business engine through recent financial performance.
Applied Materials, Inc. Analysis
Applied Materials grew revenue steadily from $23B in 2021 to $28.4B in 2025, with net income climbing from $5.9B to $7B. Its gross margin holds strong near 49%, and net margin remains healthy at 24.7%. In 2025, EBIT surged 13.6% year-over-year, reflecting operational momentum despite a slight dip in net margin. The company’s R&D and SG&A expenses scale proportionally, preserving efficiency.
Teradyne, Inc. Analysis
Teradyne’s revenue peaked at $3.7B in 2021 before declining to $3.2B in 2025, with net income falling sharply from $1B to $554M. It maintains a robust gross margin above 58%, but net margin shrank to 17.4%. Despite a 13.1% revenue growth in 2025, the company’s long-term net income and EPS trends reveal contraction. Operating expenses grew moderately, slightly impacting EBIT margin, which stands at 20.5%.
Steady Growth vs. Cyclical Pressure
Applied Materials delivers superior scale and consistent net income growth, supported by strong margins and operational efficiency. Teradyne, while boasting a higher gross margin, struggles with declining revenue and net income over five years. For investors prioritizing sustainable earnings and margin resilience, Applied Materials presents a more attractive profile in this competitive sector.
Financial Ratios Comparison
These vital ratios act as a diagnostic tool to expose underlying fiscal health, valuation premiums, and capital efficiency for Applied Materials (AMAT) and Teradyne (TER):
| Ratios | Applied Materials (AMAT) | Teradyne (TER) |
|---|---|---|
| ROE | 34.3% | — |
| ROIC | 21.9% | — |
| P/E | 26.6x | 54.6x |
| P/B | 9.11x | — |
| Current Ratio | 2.61 | 0 |
| Quick Ratio | 1.87 | 0 |
| D/E (Debt-to-Equity) | 0.35 | 0 |
| Debt-to-Assets | 19.4% | 0 |
| Interest Coverage | 30.8x | 86.4x |
| Asset Turnover | 0.78 | 0 |
| Fixed Asset Turnover | 5.54 | 0 |
| Payout Ratio | 19.8% | 13.8% |
| Dividend Yield | 0.74% | 0.25% |
| Fiscal Year | 2025 | 2025 |
Efficiency & Valuation Duel: The Vital Signs
Ratios act as a company’s DNA, revealing hidden risks and operational excellence that raw numbers alone cannot expose.
Applied Materials, Inc.
Applied Materials posts a strong 34.3% ROE and a robust 24.7% net margin, highlighting excellent profitability. Its P/E ratio of 26.6 suggests the stock trades at a premium versus the sector. The company balances shareholder returns with a modest 0.74% dividend yield, reinvesting heavily in R&D, fueling long-term growth.
Teradyne, Inc.
Teradyne shows a favorable 17.4% net margin but lacks reported ROE and ROIC data, raising caution on operational efficiency. Its P/E ratio stretches to 54.6, signaling an expensive valuation. The dividend yield is low at 0.25%, with unclear reinvestment or buyback strategies, reflecting higher risk for investors seeking steady returns.
Premium Valuation vs. Operational Safety
Applied Materials offers a better balance of profitability and valuation discipline, supported by solid capital allocation and stable liquidity. Teradyne’s high valuation with missing profitability metrics poses greater risk. Investors prioritizing operational safety and proven returns may prefer Applied Materials, while those seeking growth might consider Teradyne’s uncertain profile.
Which one offers the Superior Shareholder Reward?
I see Applied Materials (AMAT) pays a 0.78% dividend yield with a modest 19.8% payout ratio, sustaining distributions with robust 72% free cash flow coverage. Teradyne (TER) offers a lower 0.25% yield and 13.8% payout ratio but allocates more to buybacks, enhancing total return. Historically, AMAT combines steady dividends and buybacks for durable shareholder value. TER’s reinvestment pace and aggressive buybacks target growth but carry valuation risk with a 54.6 P/E vs. AMAT’s 26.6. I conclude AMAT’s balanced distribution and buyback discipline deliver a more sustainable and attractive total return profile for 2026 investors.
Comparative Score Analysis: The Strategic Profile
The radar chart reveals the fundamental DNA and trade-offs of Applied Materials and Teradyne, highlighting their financial strengths and valuation nuances:
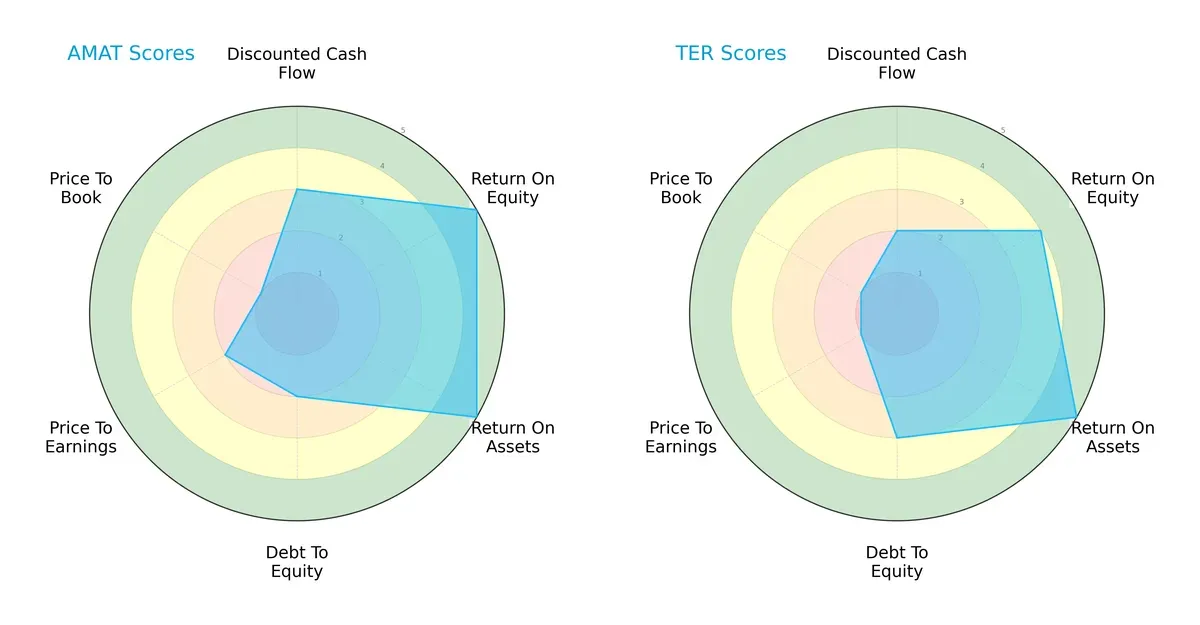
Applied Materials excels in profitability with top ROE and ROA scores (5 each), but its valuation metrics lag, showing weakness in P/B (1) and moderate P/E (2). Teradyne posts solid asset efficiency (ROA 5) and slightly better balance sheet strength (Debt/Equity 3 vs. 2). However, Teradyne’s valuation scores are weaker (P/E and P/B at 1). Overall, Applied Materials shows a more balanced profile driven by operational efficiency, while Teradyne leans on its conservative leverage position.
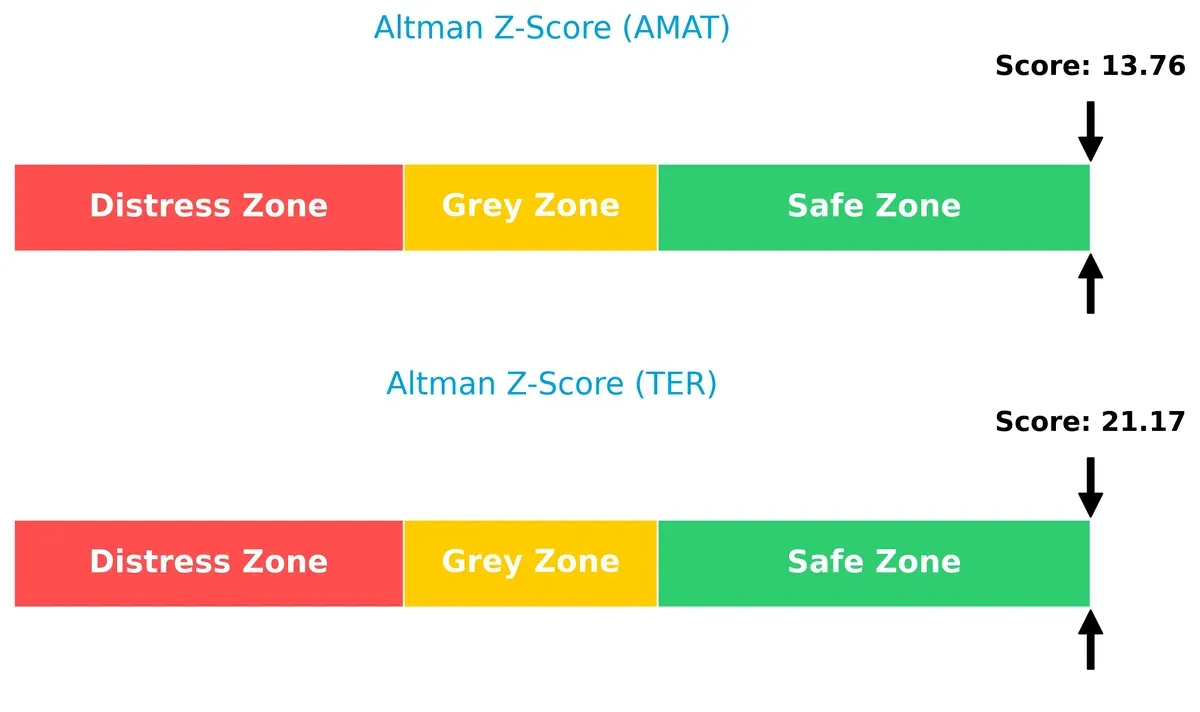
Bankruptcy Risk: Solvency Showdown
Applied Materials and Teradyne both reside comfortably in the safe zone, but Teradyne’s Altman Z-Score of 21.2 far exceeds Applied Materials’ 13.8, signaling superior long-term solvency under current economic conditions:
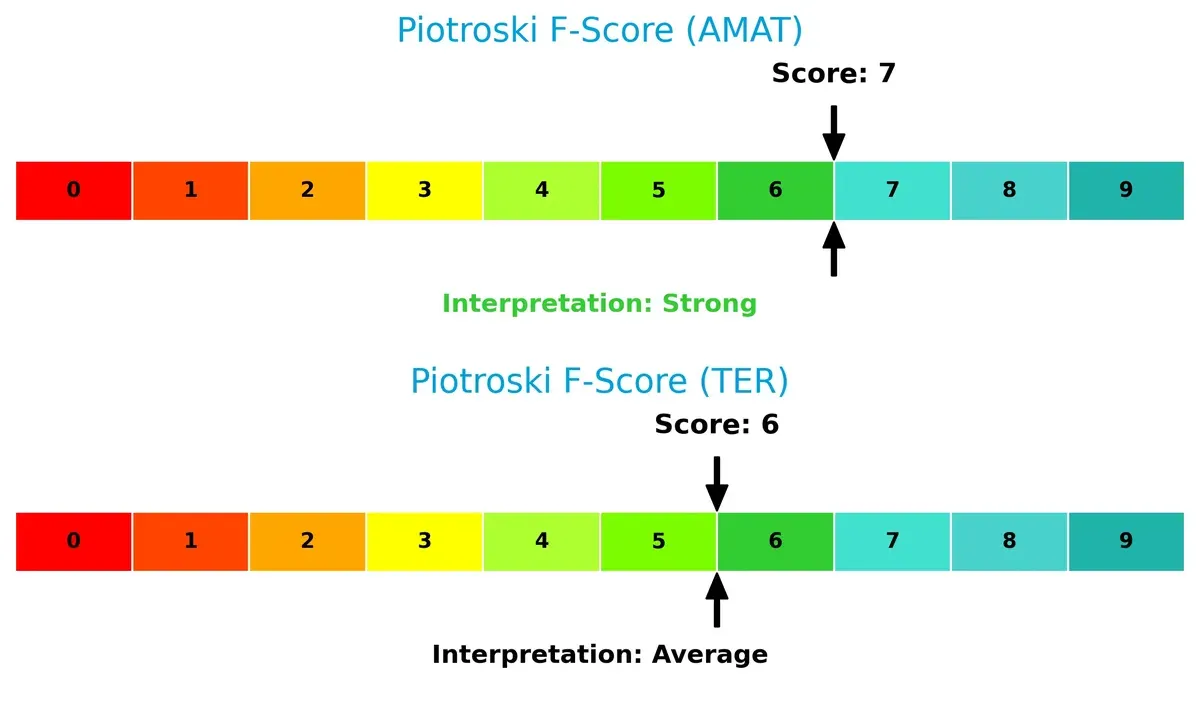
Financial Health: Quality of Operations
Applied Materials scores a strong 7 on the Piotroski scale, suggesting robust internal financial health. Teradyne’s 6 indicates solid but comparatively weaker fundamentals—no immediate red flags but less operational strength than Applied Materials:
How are the two companies positioned?
This section dissects Applied Materials and Teradyne’s operational DNA by comparing revenue distribution and internal dynamics. The goal: confront their economic moats to reveal which model delivers the most resilient, sustainable advantage today.
Revenue Segmentation: The Strategic Mix
This visual comparison dissects how Applied Materials and Teradyne diversify their income streams and reveals where their primary sector bets lie:
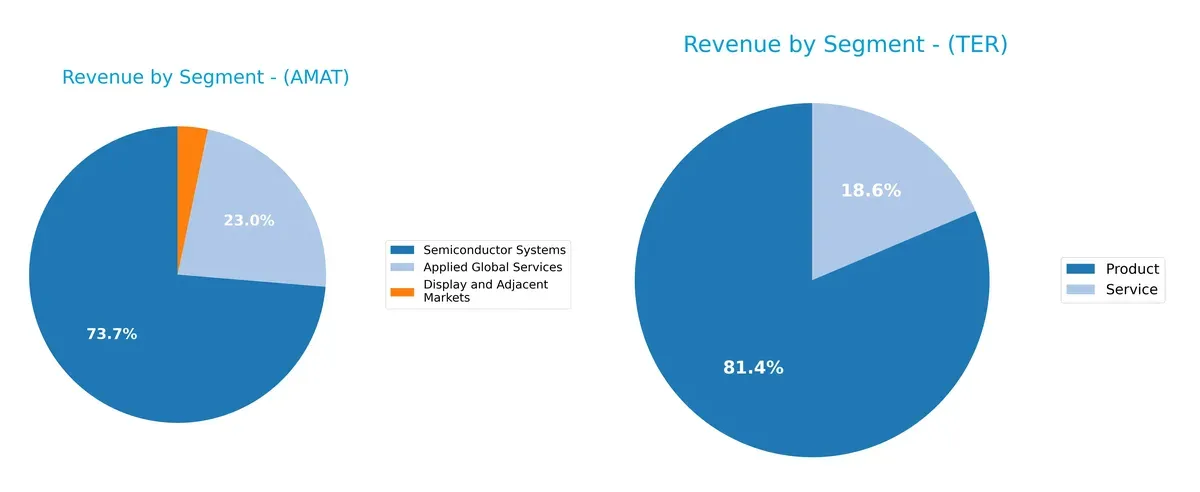
Applied Materials anchors its revenue in Semiconductor Systems at $19.9B, dwarfs other segments like Applied Global Services ($6.2B) and Display ($885M). Teradyne presents a more balanced split, with Products at $2.3B and Services at $525M. AMAT’s concentration in semiconductors signals infrastructure dominance but adds concentration risk. Teradyne’s mix suggests steady ecosystem lock-in through diversified offerings.
Strengths and Weaknesses Comparison
This table compares the strengths and weaknesses of Applied Materials, Inc. and Teradyne, Inc.:
Applied Materials Strengths
- Diverse revenue streams across Semiconductor Systems, Global Services, and Display markets
- Strong profitability with 24.67% net margin
- Robust global presence, notably in China, Korea, and Taiwan
- Favorable financial ratios including ROE of 34.28% and interest coverage of 35.46
Teradyne Strengths
- Focused product and service revenue base with over $2.2B in products
- Favorable debt metrics with zero debt to assets
- High interest coverage ratio at 81.43 indicates strong ability to service debt
- Global presence across Asia and Americas, with diversified regional sales
Applied Materials Weaknesses
- Elevated valuation multiples with PE of 26.58 and PB of 9.11 considered unfavorable
- Weighted average cost of capital at 11.43% is high relative to ROIC
- Dividend yield low at 0.74%
- Asset turnover neutral at 0.78, indicating moderate asset efficiency
Teradyne Weaknesses
- Lack of profitability metrics with zero ROE and ROIC
- No data available for WACC, current and quick ratios are zero, raising liquidity concerns
- High PE ratio of 54.64 deemed unfavorable
- Asset and fixed asset turnover are zero, pointing to operational inefficiencies
Applied Materials demonstrates a broad market footprint and solid profitability, but valuation and capital costs are notable concerns. Teradyne’s debt management is strong, yet profitability and liquidity metrics reveal significant weaknesses, suggesting operational challenges.
The Moat Duel: Analyzing Competitive Defensibility
A structural moat is the only thing protecting long-term profits from the erosion of competition. Let’s dissect the core moats of Applied Materials and Teradyne:
Applied Materials, Inc.: Innovation-Driven Switching Costs
Applied Materials’ moat stems from high switching costs embedded in its complex semiconductor manufacturing equipment. This drives stable margins (33.6% EBIT) and a strong 10.5% ROIC above WACC. However, its declining ROIC signals mounting competitive pressures by 2026.
Teradyne, Inc.: Specialized Test Equipment Niche
Teradyne’s moat relies on specialized, high-precision test platforms that create customer lock-in, contrasting Applied’s broader equipment scope. Despite favorable margin expansion, Teradyne’s deteriorating ROIC trend warns of shrinking profitability and intensifying competition ahead.
Capital Efficiency vs. Niche Expertise: Who Holds the Moat Edge?
Applied Materials commands a wider moat with sustained value creation through capital efficiency and switching costs. Teradyne’s moat feels narrower and more vulnerable given its steep ROIC decline. Applied is better positioned to defend market share in this evolving semiconductor landscape.
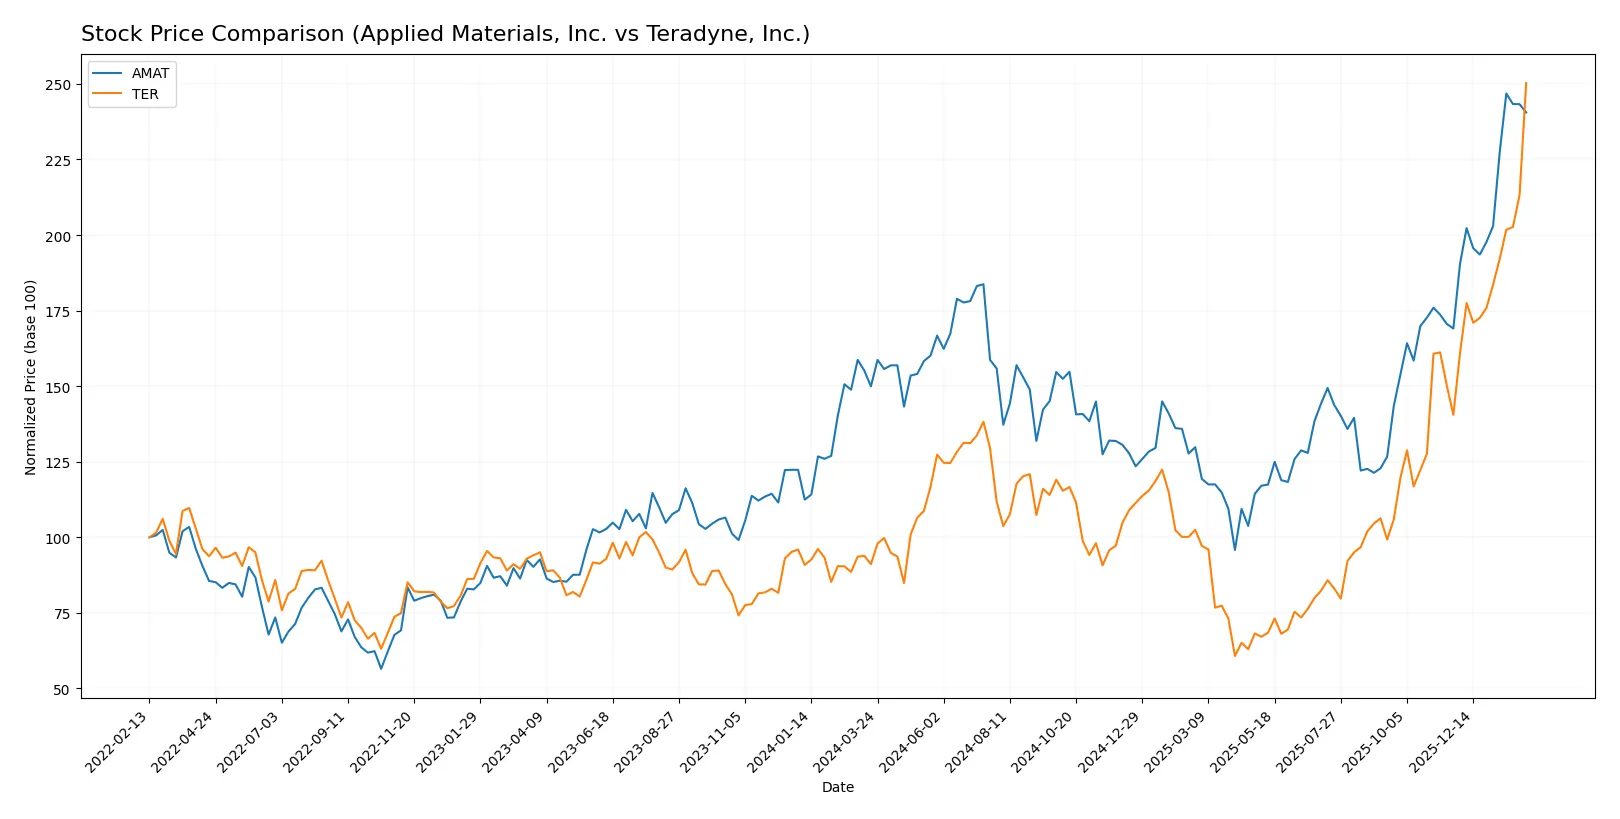
Which stock offers better returns?
Over the past 12 months, both Applied Materials, Inc. and Teradyne, Inc. experienced strong price appreciation, with Teradyne showing notably higher gains and buyer dominance in recent trading periods.
Trend Comparison
Applied Materials, Inc. shows a 60.42% price increase over the past year, marking a bullish trend with accelerating momentum and a high volatility level of 40.75. The stock reached a peak of 327.01.
Teradyne, Inc. recorded a 174.58% price surge over the same period, also bullish with accelerating gains and volatility of 39.72. Its highest price hit 282.98, reflecting strong upward momentum.
Teradyne’s stock outperformed Applied Materials with significantly higher returns and stronger buyer dominance, delivering the best market performance in the last year.
Target Prices
Analysts project solid upside potential for Applied Materials and Teradyne based on current consensus targets.
| Company | Target Low | Target High | Consensus |
|---|---|---|---|
| Applied Materials, Inc. | 290 | 405 | 360.56 |
| Teradyne, Inc. | 175 | 300 | 251.17 |
The target consensus for Applied Materials stands about 13% above its current price of $318.67, signaling moderate upside. Teradyne’s consensus target is slightly below its current price of $282.98, suggesting near-term volatility or consolidation.

Don’t Let Luck Decide Your Entry Point
Optimize your entry points with our advanced ProRealTime indicators. You’ll get efficient buy signals with precise price targets for maximum performance. Start outperforming now!
How do institutions grade them?
Applied Materials, Inc. Grades
The following table summarizes recent grades from well-known institutions for Applied Materials, Inc.:
| Grading Company | Action | New Grade | Date |
|---|---|---|---|
| Morgan Stanley | Maintain | Overweight | 2026-02-02 |
| Mizuho | Upgrade | Outperform | 2026-01-28 |
| Deutsche Bank | Upgrade | Buy | 2026-01-23 |
| Needham | Maintain | Buy | 2026-01-20 |
| Keybanc | Maintain | Overweight | 2026-01-16 |
| Barclays | Upgrade | Overweight | 2026-01-15 |
| Wells Fargo | Maintain | Overweight | 2026-01-15 |
| Stifel | Maintain | Buy | 2026-01-14 |
| B of A Securities | Maintain | Buy | 2026-01-13 |
| Susquehanna | Upgrade | Positive | 2026-01-12 |
Teradyne, Inc. Grades
The latest grades for Teradyne, Inc. from reputable grading firms are listed below:
| Grading Company | Action | New Grade | Date |
|---|---|---|---|
| Evercore ISI Group | Maintain | Outperform | 2026-02-03 |
| Cantor Fitzgerald | Maintain | Overweight | 2026-02-02 |
| Stifel | Maintain | Buy | 2026-01-30 |
| UBS | Maintain | Buy | 2026-01-26 |
| B of A Securities | Maintain | Buy | 2026-01-22 |
| Stifel | Maintain | Buy | 2026-01-14 |
| B of A Securities | Maintain | Buy | 2026-01-13 |
| Goldman Sachs | Upgrade | Buy | 2025-12-16 |
| Stifel | Upgrade | Buy | 2025-12-02 |
| Citigroup | Maintain | Buy | 2025-11-12 |
Which company has the best grades?
Both companies enjoy strong institutional support with predominantly Buy and Overweight ratings. Teradyne’s grades show consistent Buy and Outperform stances from major firms, slightly edging Applied Materials in grade stability. This could attract investors seeking steady analyst confidence.
Risks specific to each company
The following categories identify critical pressure points and systemic threats facing Applied Materials, Inc. (AMAT) and Teradyne, Inc. (TER) in the challenging 2026 market environment:
1. Market & Competition
Applied Materials, Inc. (AMAT)
- Operates in highly competitive semiconductor equipment markets with diversified segments, maintaining strong market presence.
Teradyne, Inc. (TER)
- Faces intense competition in automatic test equipment and automation, with narrower product focus and smaller scale.
2. Capital Structure & Debt
Applied Materials, Inc. (AMAT)
- Low debt-to-equity (0.35), debt-to-assets at 19.4%, and strong interest coverage (35.46) indicate solid financial stability.
Teradyne, Inc. (TER)
- Virtually no reported debt; very strong interest coverage (81.43) but limited financial leverage may constrain growth flexibility.
3. Stock Volatility
Applied Materials, Inc. (AMAT)
- Beta of 1.68 suggests higher volatility than the market but manageable given size and diversification.
Teradyne, Inc. (TER)
- Higher beta at 1.82 indicates elevated stock price swings, increasing risk for investors.
4. Regulatory & Legal
Applied Materials, Inc. (AMAT)
- Global operations expose AMAT to complex semiconductor export controls and IP regulations.
Teradyne, Inc. (TER)
- TER faces regulatory scrutiny mainly in test equipment certifications and export compliance, less globally diversified.
5. Supply Chain & Operations
Applied Materials, Inc. (AMAT)
- Extensive global supply chains vulnerable to geopolitical tensions but benefits from scale and service segments.
Teradyne, Inc. (TER)
- Smaller operational footprint may limit supply chain resilience amid semiconductor sector disruptions.
6. ESG & Climate Transition
Applied Materials, Inc. (AMAT)
- Invests in sustainable manufacturing technologies; faces pressure to reduce carbon footprint across global fabs.
Teradyne, Inc. (TER)
- ESG efforts less publicized; automation focus could aid energy efficiency but disclosure remains limited.
7. Geopolitical Exposure
Applied Materials, Inc. (AMAT)
- Significant exposure to China, Taiwan, Korea, and other Asia-Pacific markets, increasing geopolitical risk.
Teradyne, Inc. (TER)
- US-based with international sales but less direct exposure to high-risk regions than AMAT.
Which company shows a better risk-adjusted profile?
AMAT’s most impactful risk is its geopolitical exposure in Asia-Pacific, which could disrupt its complex supply chain. TER’s primary risk is its high stock volatility coupled with limited financial leverage. Despite these challenges, AMAT’s strong capital structure and diversified operations grant it a more balanced risk-adjusted profile. TER’s elevated beta and narrow product focus increase its vulnerability despite a safe-zone Altman Z-score. Recently, AMAT’s robust interest coverage paired with a diversified segment mix justifies my confidence in its risk management capabilities.
Final Verdict: Which stock to choose?
Applied Materials excels as a cash-generating powerhouse with a demonstrated ability to create shareholder value through superior capital efficiency. Its slight decline in return on invested capital is a point of vigilance, signaling the need to monitor its competitive edge closely. This stock suits aggressive growth portfolios seeking resilient tech manufacturing leaders.
Teradyne’s strategic moat lies in its specialization and recurring revenue streams from test equipment, offering a niche market defensibility. It presents a safer profile than AMAT, with strong liquidity and solid cash flow stability. Teradyne could complement growth-at-a-reasonable-price (GARP) portfolios focused on steady operational cash generation.
If you prioritize robust capital allocation and value creation, Applied Materials is the compelling choice due to its proven excess returns and market leadership. However, if you seek more stability with a narrower moat and consistent cash flows, Teradyne offers better downside protection despite a thinner growth runway. Both require attentive risk management given their cyclical semiconductor exposure.
Disclaimer: Investment carries a risk of loss of initial capital. The past performance is not a reliable indicator of future results. Be sure to understand risks before making an investment decision.
Go Further
I encourage you to read the complete analyses of Applied Materials, Inc. and Teradyne, Inc. to enhance your investment decisions: