The semiconductor industry remains a cornerstone of technological advancement, powering devices from smartphones to high-performance computers. Taiwan Semiconductor Manufacturing Company Limited (TSM) and Applied Materials, Inc. (AMAT) are two industry leaders with significant market overlap, yet distinct innovation strategies—TSM focuses on wafer fabrication, while AMAT specializes in manufacturing equipment and services. This article will help you decide which company holds the most promise for your investment portfolio.

Table of contents
Companies Overview
I will begin the comparison between Taiwan Semiconductor Manufacturing Company Limited (TSM) and Applied Materials, Inc. (AMAT) by providing an overview of these two companies and their main differences.
Taiwan Semiconductor Manufacturing Company Limited Overview
TSM is a leading semiconductor manufacturer headquartered in Hsinchu City, Taiwan. Founded in 1987, it specializes in manufacturing, packaging, testing, and selling integrated circuits and semiconductor devices globally. The company supports various wafer fabrication processes and serves markets including high performance computing, smartphones, IoT, automotive, and digital consumer electronics.
Applied Materials, Inc. Overview
AMAT, headquartered in Santa Clara, California, is a provider of manufacturing equipment, services, and software for the semiconductor and display industries. Established in 1967, it operates through three segments: Semiconductor Systems, Applied Global Services, and Display and Adjacent Markets, supplying equipment and technologies to optimize semiconductor chip fabrication and display production worldwide.
Key similarities and differences
Both TSM and AMAT operate in the semiconductor industry and serve global markets, but their business models differ significantly. TSM focuses on semiconductor manufacturing and wafer fabrication, while AMAT specializes in manufacturing equipment and services that support semiconductor and display production. TSM is primarily a producer of semiconductor devices, whereas AMAT provides the tools and technologies for manufacturing these devices.
Income Statement Comparison
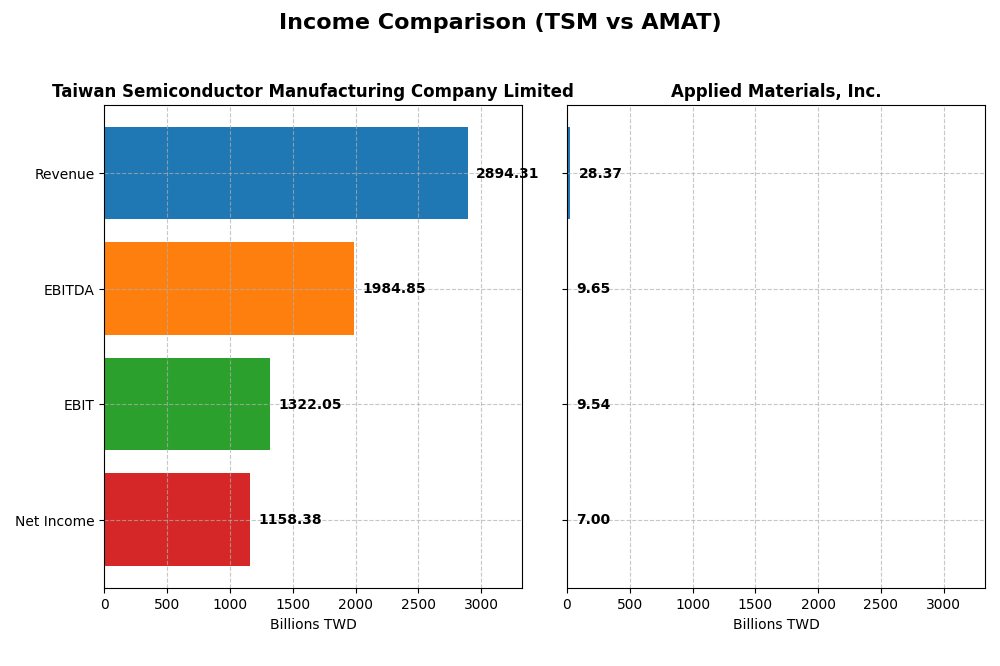
This table compares the latest fiscal year income statement metrics for Taiwan Semiconductor Manufacturing Company Limited and Applied Materials, Inc., providing a factual snapshot of their financial performance.
| Metric | Taiwan Semiconductor Manufacturing Company Limited (TSM) | Applied Materials, Inc. (AMAT) |
|---|---|---|
| Market Cap | 1.70T TWD | 240B USD |
| Revenue | 2.89T TWD | 28.37B USD |
| EBITDA | 1.98T TWD | 9.65B USD |
| EBIT | 1.32T TWD | 9.54B USD |
| Net Income | 1.16T TWD | 7.00B USD |
| EPS | 223.4 TWD | 8.71 USD |
| Fiscal Year | 2024 | 2025 |
Income Statement Interpretations
Taiwan Semiconductor Manufacturing Company Limited
TSMC’s revenue and net income showed strong growth from 2020 to 2024, with revenue rising 116% and net income up 127%. Margins remained robust and stable, with a gross margin at 56.12% and a net margin at 40.02%, both assessed as favorable. The 2024 fiscal year saw a 34% revenue increase and a slight net margin improvement, indicating solid operational efficiency and sustained profitability.
Applied Materials, Inc.
Applied Materials experienced moderate revenue growth of 23% over 2021-2025, with net income increasing by nearly 19%. Margins were favorable but lower than TSMC’s, with a gross margin of 48.67% and net margin of 24.67%. The most recent year showed a 4.4% revenue rise but a 6.6% decline in net margin, reflecting some pressure on profitability despite a 13.6% EBIT growth.
Which one has the stronger fundamentals?
TSMC demonstrates stronger fundamentals, with higher and more consistent margin levels alongside impressive growth rates in revenue and net income. Applied Materials shows favorable growth but with margin erosion and mixed profitability signals. TSMC’s overall income statement evaluation is more favorable, with fewer neutral or unfavorable indicators compared to Applied Materials, suggesting greater financial resilience.
Financial Ratios Comparison
This table presents a side-by-side comparison of the most recent key financial ratios for Taiwan Semiconductor Manufacturing Company Limited (TSM) and Applied Materials, Inc. (AMAT) as of their latest fiscal years.
| Ratios | Taiwan Semiconductor Manufacturing Company Limited (TSM) 2024 | Applied Materials, Inc. (AMAT) 2025 |
|---|---|---|
| ROE | 27.3% | 34.3% |
| ROIC | 20.0% | 21.9% |
| P/E | 29.0 | 26.6 |
| P/B | 7.92 | 9.11 |
| Current Ratio | 2.36 | 2.61 |
| Quick Ratio | 2.14 | 1.87 |
| D/E (Debt-to-Equity) | 0.25 | 0.35 |
| Debt-to-Assets | 15.6% | 19.4% |
| Interest Coverage | 126 | 31 |
| Asset Turnover | 0.43 | 0.78 |
| Fixed Asset Turnover | 0.88 | 5.54 |
| Payout Ratio | 31.3% | 19.8% |
| Dividend Yield | 1.08% | 0.74% |
Interpretation of the Ratios
Taiwan Semiconductor Manufacturing Company Limited
TSM shows strong profitability with a net margin of 40.02% and a solid return on equity at 27.29%, indicating efficient use of shareholder funds. However, valuation multiples like PE at 29.04 and PB at 7.92 appear high, which may concern value-oriented investors. The dividend yield is moderate at 1.08%, reflecting stable shareholder returns with a balanced payout approach.
Applied Materials, Inc.
AMAT exhibits favorable profitability metrics, including a 24.67% net margin and a robust 34.28% ROE, alongside an impressive fixed asset turnover of 5.54. Yet, the cost of capital is somewhat elevated at 11.37%, and the dividend yield is low at 0.74%, possibly signaling limited income return. Despite a strong current ratio at 2.61, valuation multiples remain elevated, with a PE of 26.58.
Which one has the best ratios?
Both companies present a favorable global ratio profile, but AMAT holds a higher percentage of favorable ratios at 64.29% compared to TSM’s 57.14%. AMAT’s stronger asset turnover and return on equity contrast with TSM’s superior net margin and lower leverage. Each has valuation and dividend yield drawbacks, making the assessment of the best ratios dependent on investor priorities.
Strategic Positioning
This section compares the strategic positioning of TSM and AMAT, including Market position, Key segments, and Exposure to technological disruption:
Taiwan Semiconductor Manufacturing Company Limited
- Leading global semiconductor foundry with strong competitive pressure from other chip manufacturers.
- Focuses on wafer fabrication and integrated circuit manufacturing serving high performance computing, smartphones, IoT, automotive, and consumer electronics.
- Invests in advanced wafer fabrication technology with exposure to evolving semiconductor manufacturing processes.
Applied Materials, Inc.
- Significant player in semiconductor equipment manufacturing facing competition from other tech equipment providers.
- Operates in semiconductor systems, global services, and display markets, providing equipment and software for chip and display production.
- Faces technological disruption through rapid innovation in semiconductor equipment, display technologies, and factory automation software.
TSM vs AMAT Positioning
TSM maintains a concentrated market position focused on wafer fabrication and integrated circuits, supporting diverse end markets. AMAT has a more diversified segment approach including equipment, services, and display technologies, exposing it to broader industry trends and risks.
Which has the best competitive advantage?
Both companies create value with ROIC exceeding WACC but show declining profitability trends. Their economic moats are slightly favorable, indicating moderate competitive advantages without clear superiority.
Stock Comparison
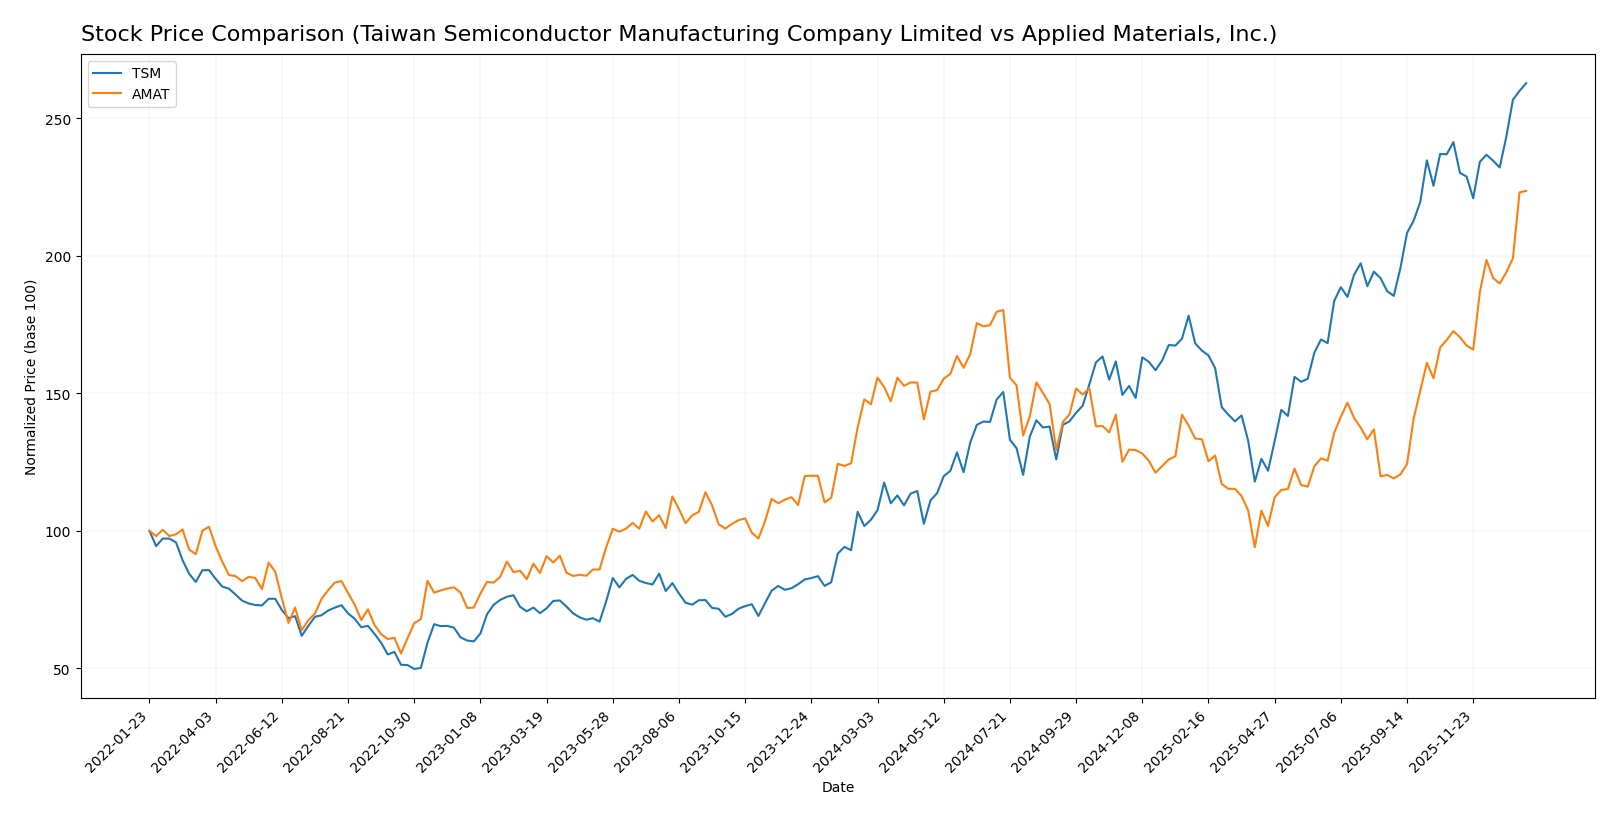
The stock price dynamics over the past 12 months reveal significant upward momentum for both Taiwan Semiconductor Manufacturing Company Limited (TSM) and Applied Materials, Inc. (AMAT), with TSM showing stronger acceleration and a wider price range.
Trend Analysis
Taiwan Semiconductor Manufacturing Company Limited’s stock exhibited a bullish trend over the past year with a 152.54% price increase, accelerating upward from a low of 127.7 to a high of 327.11, supported by a high volatility level (std deviation 51.25).
Applied Materials, Inc. also recorded a bullish trend with a 53.12% price increase and acceleration, ranging from 126.95 to 301.89, accompanied by moderate volatility (std deviation 33.84).
Comparing both stocks, Taiwan Semiconductor Manufacturing Company Limited delivered the highest market performance with a substantially larger price gain and acceleration than Applied Materials, Inc.
Target Prices
Analysts present a positive consensus for these semiconductor companies, indicating potential upside from current stock prices.
| Company | Target High | Target Low | Consensus |
|---|---|---|---|
| Taiwan Semiconductor Manufacturing Company Limited | 400 | 330 | 361.25 |
| Applied Materials, Inc. | 400 | 250 | 315.57 |
The target consensus for Taiwan Semiconductor is about 10% above its current price of 327.11 USD, while Applied Materials shows a modest upside from 301.89 USD to a 315.57 USD consensus target. This suggests cautious optimism among analysts.
Analyst Opinions Comparison
This section compares analysts’ ratings and grades for Taiwan Semiconductor Manufacturing Company Limited (TSM) and Applied Materials, Inc. (AMAT):
Rating Comparison
TSM Rating
- Rating: A-, considered very favorable by analysts.
- Discounted Cash Flow Score: 5, indicating very favorable valuation based on cash flow projections.
- ROE Score: 5, showing very efficient profit generation from shareholders’ equity.
- ROA Score: 5, reflecting very effective asset utilization to generate earnings.
- Debt To Equity Score: 3, indicating moderate financial risk with some reliance on debt.
- Overall Score: 4, reflecting a favorable overall financial standing.
AMAT Rating
- Rating: B+, also considered very favorable overall.
- Discounted Cash Flow Score: 3, a moderate valuation score based on cash flow.
- ROE Score: 5, equally very efficient in generating profit from equity.
- ROA Score: 5, also very effective in asset utilization.
- Debt To Equity Score: 2, slightly better with lower financial risk.
- Overall Score: 3, showing a moderate overall financial standing.
Which one is the best rated?
Based strictly on the provided data, TSM is better rated overall with a higher rating (A- vs. B+), superior discounted cash flow score, and a better overall score. AMAT shows strengths in debt management but scores lower on valuation and overall rating.
Scores Comparison
Here is a comparison of the key financial scores for TSM and AMAT:
TSM Scores
- Altman Z-Score: 2.94, in the grey zone indicating moderate bankruptcy risk.
- Piotroski Score: 8, classified as very strong financial health.
AMAT Scores
- Altman Z-Score: 13.45, in the safe zone, showing very low bankruptcy risk.
- Piotroski Score: 7, indicating strong financial health.
Which company has the best scores?
AMAT shows a significantly higher Altman Z-Score, placing it firmly in the safe zone, while TSM is in the grey zone. TSM has a slightly higher Piotroski Score, indicating very strong financial health compared to AMAT’s strong rating.
Grades Comparison
Here is a comparison of the latest grades assigned to Taiwan Semiconductor Manufacturing Company Limited and Applied Materials, Inc.:
Taiwan Semiconductor Manufacturing Company Limited Grades
The following table shows recent grades from reputable grading companies for TSM:
| Grading Company | Action | New Grade | Date |
|---|---|---|---|
| Bernstein | Maintain | Outperform | 2025-12-08 |
| Needham | Maintain | Buy | 2025-10-27 |
| Barclays | Maintain | Overweight | 2025-10-17 |
| Needham | Maintain | Buy | 2025-10-16 |
| Susquehanna | Maintain | Positive | 2025-10-10 |
| Barclays | Maintain | Overweight | 2025-10-09 |
| Barclays | Maintain | Overweight | 2025-09-16 |
| Needham | Maintain | Buy | 2025-07-17 |
| Susquehanna | Maintain | Positive | 2025-07-14 |
| Needham | Maintain | Buy | 2025-07-01 |
Grades for Taiwan Semiconductor Manufacturing Company Limited consistently indicate a positive outlook, with predominant “Buy,” “Outperform,” and “Overweight” ratings maintained over several months.
Applied Materials, Inc. Grades
The following table shows recent grades from reputable grading companies for AMAT:
| Grading Company | Action | New Grade | Date |
|---|---|---|---|
| B of A Securities | Maintain | Buy | 2026-01-13 |
| Susquehanna | Upgrade | Positive | 2026-01-12 |
| Cantor Fitzgerald | Maintain | Overweight | 2026-01-08 |
| B. Riley Securities | Maintain | Buy | 2025-12-18 |
| Mizuho | Maintain | Neutral | 2025-12-17 |
| Wells Fargo | Maintain | Overweight | 2025-12-15 |
| Jefferies | Maintain | Buy | 2025-12-15 |
| Keybanc | Maintain | Overweight | 2025-12-02 |
| UBS | Upgrade | Buy | 2025-11-25 |
| B. Riley Securities | Maintain | Buy | 2025-11-14 |
Applied Materials, Inc. shows a generally favorable rating trend, with multiple upgrades and a mix of “Buy,” “Overweight,” and “Positive” ratings, complemented by some “Neutral” assessments.
Which company has the best grades?
Both companies hold a consensus “Buy” rating; however, Applied Materials, Inc. has a broader number of recent upgrades and slightly more diverse positive ratings. This may suggest stronger analyst conviction, which could affect investor sentiment and portfolio considerations.
Strengths and Weaknesses
Below is a comparison of key strengths and weaknesses of Taiwan Semiconductor Manufacturing Company Limited (TSM) and Applied Materials, Inc. (AMAT) based on the most recent data available in 2026.
| Criterion | Taiwan Semiconductor Manufacturing Company Limited (TSM) | Applied Materials, Inc. (AMAT) |
|---|---|---|
| Diversification | Focused primarily on wafer manufacturing with other products contributing less; moderate product diversification. | More diversified across Semiconductor Systems, Applied Global Services, and Display markets. |
| Profitability | High net margin (40.02%), solid ROE (27.29%), and ROIC (20.0%); slightly declining profitability trend. | Strong profitability with net margin at 24.67%, higher ROE (34.28%), and ROIC (21.96%); profitability also declining. |
| Innovation | Industry leader in advanced wafer tech, but facing challenges in maintaining ROIC growth. | Leading in semiconductor equipment innovation, especially in fixed asset turnover efficiency. |
| Global presence | World’s largest contract chipmaker, strong global footprint, especially in Asia. | Global presence in semiconductor equipment markets, with expanding service segments worldwide. |
| Market Share | Dominant position in wafer foundry market with large scale and capacity. | Significant market share in semiconductor equipment and related services, benefiting from diversified segments. |
Key takeaways: Both TSM and AMAT demonstrate strong profitability and favorable financial health, though both face declining ROIC trends, signaling caution. TSM excels in wafer manufacturing dominance, while AMAT’s diversified segments and innovation in equipment provide competitive advantages. Investors should weigh these factors alongside market conditions and risk tolerance.
Risk Analysis
Below is a comparative table highlighting key risks for Taiwan Semiconductor Manufacturing Company Limited (TSM) and Applied Materials, Inc. (AMAT) based on the most recent data from 2025-2026:
| Metric | Taiwan Semiconductor Manufacturing Company Limited (TSM) | Applied Materials, Inc. (AMAT) |
|---|---|---|
| Market Risk | Beta 1.274: Moderate sensitivity to market volatility | Beta 1.671: Higher market volatility risk |
| Debt level | Debt-to-Equity 0.25, Debt-to-Assets 15.65% (low risk) | Debt-to-Equity 0.35, Debt-to-Assets 19.42% (moderate risk) |
| Regulatory Risk | High: Exposure to Taiwan and China geopolitical tensions | Moderate: US-based, subject to trade policies |
| Operational Risk | High complexity in advanced semiconductor manufacturing | Medium: Diverse product lines, operational scale |
| Environmental Risk | Moderate: Semiconductor production has environmental impacts | Moderate: Equipment manufacturing involves resource usage |
| Geopolitical Risk | High: Taiwan-China tensions pose significant risk | Moderate: US-China trade relations affect business |
In synthesis, TSM faces the most impactful risks from geopolitical tensions and regulatory uncertainties, given its central role in Taiwan and global chip supply chains. AMAT’s higher market beta indicates greater price volatility, but its operational and geopolitical risks are comparatively moderate. Both companies maintain healthy debt levels, but investors should monitor geopolitical developments closely due to their potential to disrupt supply chains and market access.
Which Stock to Choose?
Taiwan Semiconductor Manufacturing Company Limited (TSM) shows a strong income evolution with a 33.9% revenue growth in 2024 and a 126.8% net income increase over 2020-2024. Its financial ratios are largely favorable, including a 27.3% ROE and a robust current ratio of 2.36. The company maintains low debt levels with a net debt to EBITDA of -0.54 and holds a very favorable overall rating of A-.
Applied Materials, Inc. (AMAT) reports moderate income growth, with a 4.4% revenue increase in 2025 and an 18.9% net income rise since 2021. Its financial ratios are favorable overall, highlighted by a 34.3% ROE and a current ratio of 2.61, though it carries a slightly higher debt level (net debt to EBITDA -0.02) and a very favorable rating of B+.
For investors prioritizing growth and profitability metrics, TSM’s superior income growth and strong margin profile might appear more attractive. Conversely, AMAT’s stable financial position and higher recent price acceleration could appeal to those with a preference for companies demonstrating strong operational efficiency and moderate growth. Both companies demonstrate a slightly favorable economic moat with value creation but declining ROIC trends.
Disclaimer: Investment carries a risk of loss of initial capital. The past performance is not a reliable indicator of future results. Be sure to understand risks before making an investment decision.
Go Further
I encourage you to read the complete analyses of Taiwan Semiconductor Manufacturing Company Limited and Applied Materials, Inc. to enhance your investment decisions: