Home > Comparison > Technology > AMAT vs STM
The competitive dynamic between Applied Materials, Inc. and STMicroelectronics N.V. shapes the semiconductor industry landscape. Applied Materials operates as a capital-heavy equipment supplier focused on fabrication technologies, while STMicroelectronics delivers diversified semiconductor products across automotive and industrial markets. This head-to-head contrasts equipment manufacturing with integrated semiconductor solutions, offering investors a choice between scale-driven capital investment and product-driven innovation. This analysis will clarify which model presents a superior risk-adjusted return for a diversified portfolio.
Table of contents
Companies Overview
Applied Materials and STMicroelectronics stand as pivotal players in the semiconductor industry, shaping global technology supply chains.
Applied Materials, Inc.: Semiconductor Equipment Powerhouse
Applied Materials dominates as a provider of manufacturing equipment, services, and software crucial for semiconductor fabrication. Its revenue stems from advanced tools like epitaxy and chemical vapor deposition, alongside integrated service solutions. In 2026, it focuses strategically on optimizing fab performance and expanding its footprint in display technologies.
STMicroelectronics N.V.: Diverse Semiconductor Innovator
STMicroelectronics operates as a multi-segment semiconductor manufacturer, generating revenue through automotive ICs, analog products, and microcontrollers. Its 2026 strategy emphasizes innovation in automotive and industrial applications, coupled with growth in MEMS sensors and wireless connectivity solutions across diverse markets.
Strategic Collision: Similarities & Divergences
Both companies invest heavily in semiconductor innovation but diverge sharply in business models: Applied Materials supplies fabrication equipment, while STMicroelectronics manufactures semiconductor components. Their primary battleground is in advancing chip technology to meet rising automotive and industrial demands. Their investment profiles contrast as a capital-intensive equipment provider versus a diversified chip maker with broad end-market exposure.
Income Statement Comparison
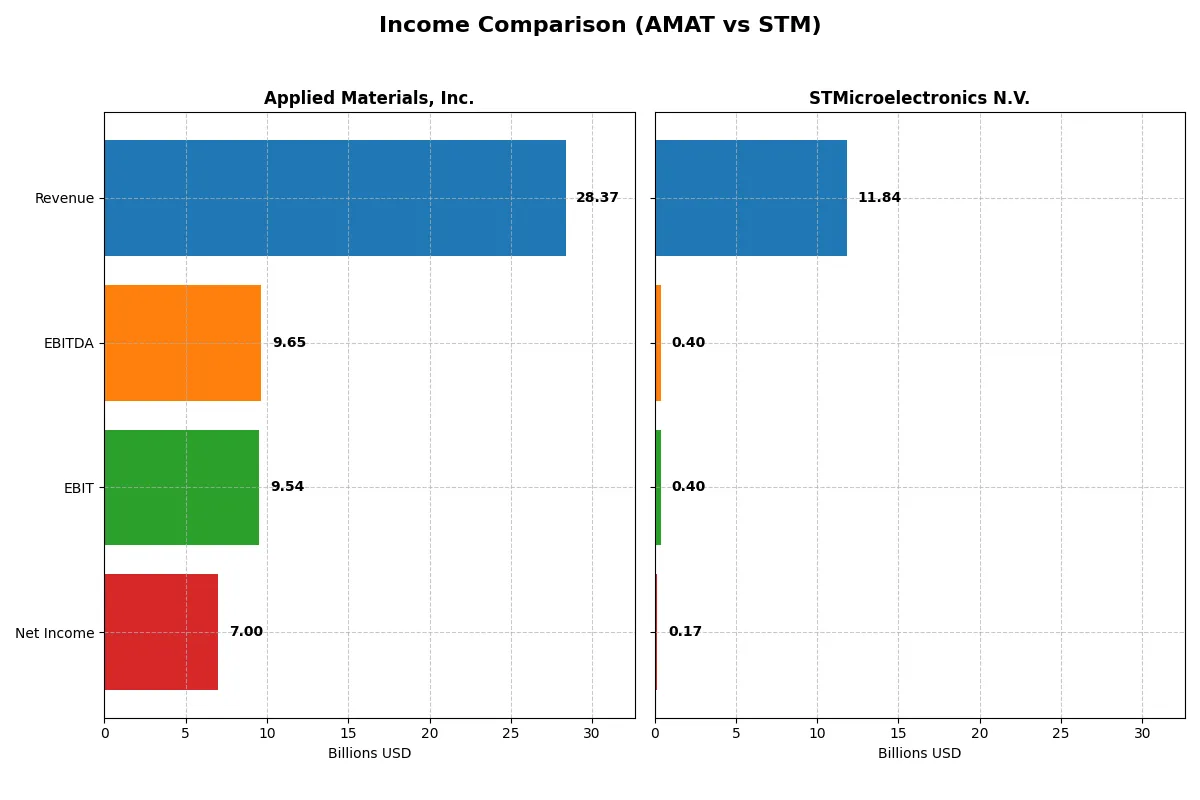
The following data dissects the core profitability and scalability of both corporate engines to reveal who dominates the bottom line:
| Metric | Applied Materials, Inc. (AMAT) | STMicroelectronics N.V. (STM) |
|---|---|---|
| Revenue | 28.4B | 11.8B |
| Cost of Revenue | 14.6B | 7.8B |
| Operating Expenses | 5.5B | 3.7B |
| Gross Profit | 13.8B | 4.0B |
| EBITDA | 9.7B | 0.4B |
| EBIT | 9.5B | 0.4B |
| Interest Expense | 269M | 0 |
| Net Income | 7.0B | 0 |
| EPS | 8.71 | 0.19 |
| Fiscal Year | 2025 | 2025 |
Income Statement Analysis: The Bottom-Line Duel
This income statement comparison exposes which company runs the more efficient and profitable corporate engine through their recent financial performance.
Applied Materials, Inc. Analysis
Applied Materials shows steady revenue growth from $23B in 2021 to $28.4B in 2025. Net income rises consistently, reaching $7B in 2025 despite a slight net margin dip to 24.7%. Gross and EBIT margins hold strong at 48.7% and 33.6%, reflecting solid operational efficiency and expanding profitability momentum.
STMicroelectronics N.V. Analysis
STMicroelectronics faces revenue decline from $12.8B in 2021 to $11.8B in 2025, with net income plummeting to near break-even at $167M. Gross margin holds at 33.9%, but EBIT margin collapses to 3.4%, signaling deteriorating cost control. The company struggles with sharply falling earnings and shrinking margins, indicating operational challenges.
Margin Strength vs. Earnings Resilience
Applied Materials outperforms STMicroelectronics with superior margin profiles and consistent net income growth over five years. STMicroelectronics’ declining revenues and slim net margin undermine its profitability. Investors seeking robust earnings backed by operational efficiency will find Applied Materials’ profile more compelling and reliable.
Financial Ratios Comparison
These vital ratios act as a diagnostic tool to expose the underlying fiscal health, valuation premiums, and capital efficiency of the companies compared below:
| Ratios | Applied Materials, Inc. (AMAT) | STMicroelectronics N.V. (STM) |
|---|---|---|
| ROE | 34.3% | 0.9% |
| ROIC | 21.9% | 0.7% |
| P/E | 26.6 | 0 |
| P/B | 9.11 | 0 |
| Current Ratio | 2.61 | 3.36 |
| Quick Ratio | 1.87 | 2.43 |
| D/E | 0.35 | 0.12 |
| Debt-to-Assets | 19.4% | 8.6% |
| Interest Coverage | 30.8 | 0 |
| Asset Turnover | 0.78 | 0.48 |
| Fixed Asset Turnover | 5.54 | 1.07 |
| Payout Ratio | 19.8% | 0% |
| Dividend Yield | 0.74% | 0% |
| Fiscal Year | 2025 | 2025 |
Efficiency & Valuation Duel: The Vital Signs
Financial ratios serve as a company’s DNA, exposing operational strengths and hidden financial risks with precision and clarity.
Applied Materials, Inc.
Applied Materials exhibits robust profitability with a 34.3% ROE and a solid 24.7% net margin. Its valuation appears stretched, trading at a P/E of 26.6 and a P/B of 9.1, above typical sector averages. The company delivers modest dividends at 0.74%, signaling shareholder returns alongside reinvestment in R&D for growth.
STMicroelectronics N.V.
STMicroelectronics struggles with profitability, posting a mere 0.9% ROE and a thin 1.4% net margin. Valuation metrics are favorable with P/E and P/B ratios effectively zero, yet operational efficiency lags with low asset turnover. The absence of dividends highlights a reinvestment focus into R&D, seeking to revive growth momentum.
Premium Valuation vs. Operational Safety
Applied Materials offers superior profitability and a clear growth strategy, albeit at a premium valuation. STMicroelectronics presents a riskier profile with weak returns but a neutral valuation. Investors prioritizing steady returns may lean toward Applied Materials; those seeking a turnaround play might consider STMicroelectronics.
Which one offers the Superior Shareholder Reward?
Applied Materials (AMAT) offers a more attractive shareholder reward than STMicroelectronics (STM) in 2026. AMAT yields ~0.77% dividends with a conservative 17% payout ratio, supported by strong free cash flow (~$7.1/share). Its robust buyback program amplifies returns, reflecting disciplined capital allocation. STM pays a higher 1.28% dividend but with questionable free cash flow sustainability (negative in 2024, marginal in 2025) and limited buyback activity. AMAT’s blend of consistent dividends, significant free cash flow, and buybacks underpins a sustainable, superior total return profile amid semiconductor cyclicality. I favor AMAT for long-term value creation and shareholder reward.
Comparative Score Analysis: The Strategic Profile
The radar chart reveals the fundamental DNA and trade-offs of Applied Materials, Inc. and STMicroelectronics N.V., highlighting their financial strengths and valuation nuances:
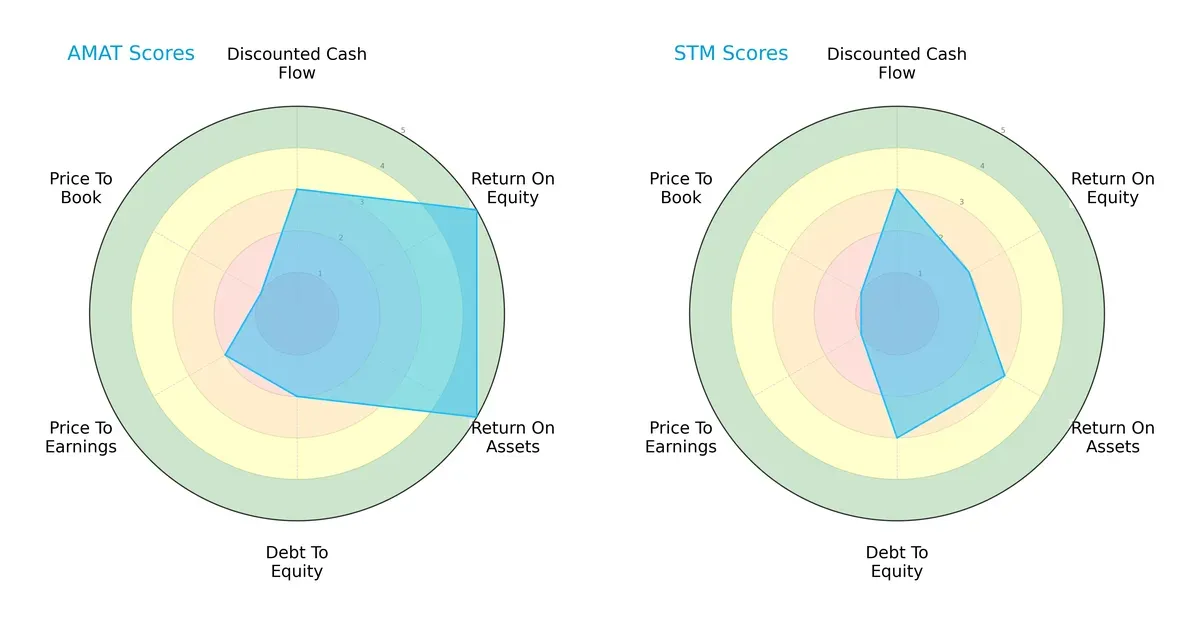
Applied Materials shows strength in profitability metrics with high ROE (5) and ROA (5) scores, outperforming STMicroelectronics’ moderate scores (ROE 2, ROA 3). However, AMAT carries higher financial leverage risk (Debt/Equity 2 vs. 3 for STM) and suffers from weak valuation metrics (PE 2, PB 1). STMicroelectronics presents a more balanced but overall moderate profile, relying less on profitability and more on moderate debt levels. AMAT’s profile depends on operational efficiency, while STM leans on cautious capital structure.
Bankruptcy Risk: Solvency Showdown
The Altman Z-Score gap underscores Applied Materials’ superior financial safety margin compared to STMicroelectronics in this cycle:
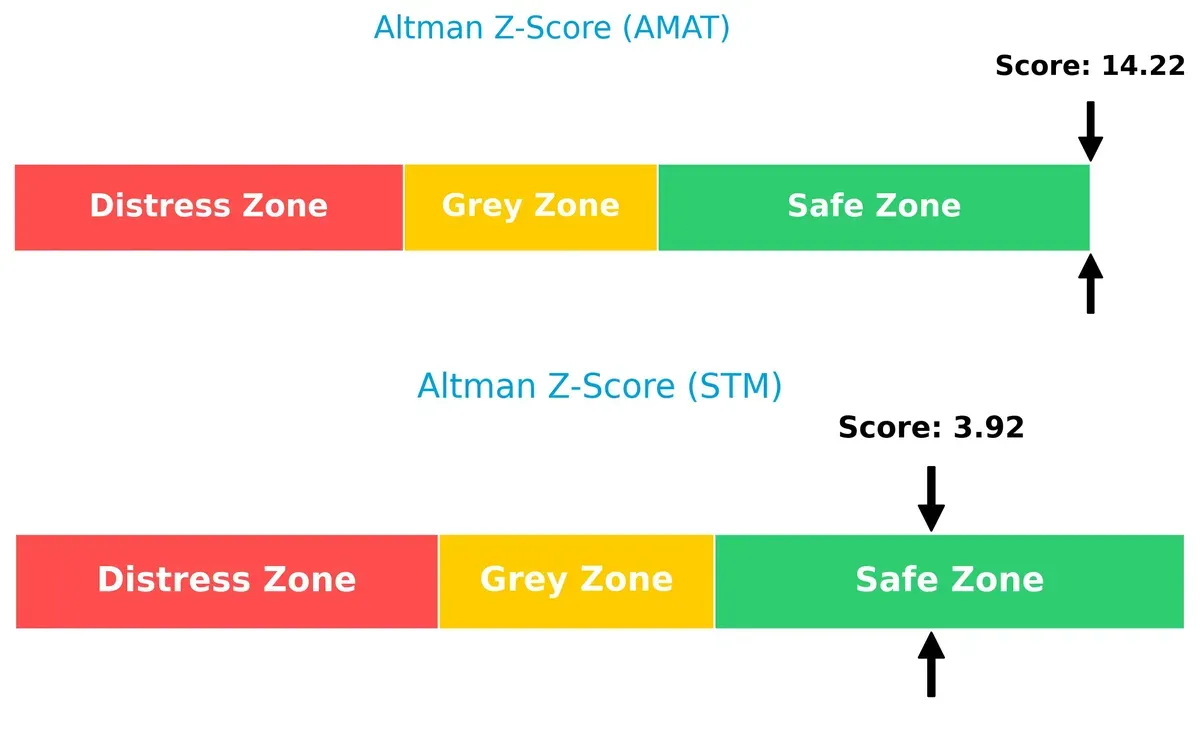
Applied Materials boasts a commanding Z-Score of 14.2, signaling an exceptionally safe zone against bankruptcy risk. STMicroelectronics also stays in the safe zone but at a much lower 3.9, indicating moderate resilience. This wide delta signals AMAT’s robust buffer to market downturns, while STM faces a tighter margin for error.
Financial Health: Quality of Operations
Piotroski F-Scores confirm STMicroelectronics edges ahead in operational quality compared to Applied Materials:
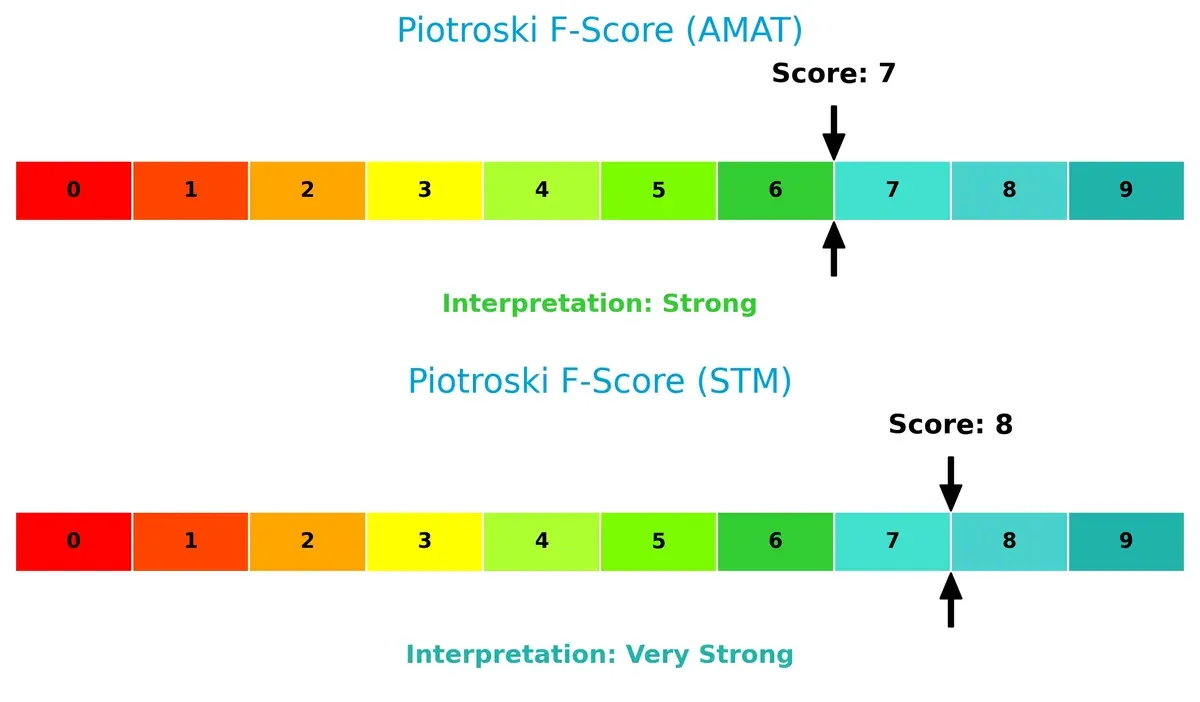
STMicroelectronics scores an 8, classified as very strong, reflecting superior internal financial metrics and operational health. Applied Materials, with a 7, is strong but slightly behind, suggesting minor red flags that investors should monitor. STM’s higher score indicates better recent profitability, liquidity, and efficiency improvements.
How are the two companies positioned?
This section dissects AMAT and STM’s operational DNA by comparing revenue distribution and internal strengths and weaknesses. The goal is to confront their economic moats to identify which model offers the most resilient, sustainable competitive advantage today.
Revenue Segmentation: The Strategic Mix
This comparison dissects how Applied Materials and STMicroelectronics diversify their income streams and reveals their primary sector bets:
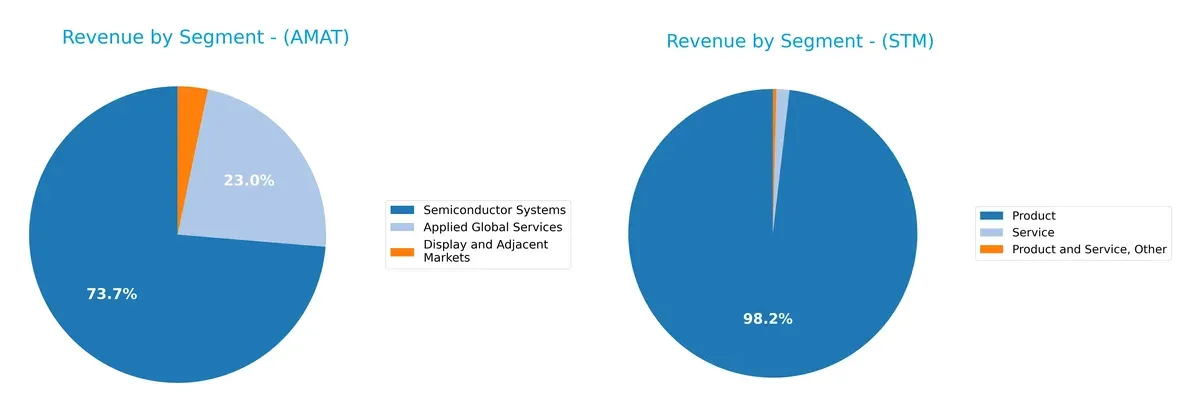
Applied Materials anchors revenue in Semiconductor Systems with $19.9B in 2024, dwarfing its other segments, while Services add $6.2B. In contrast, STMicroelectronics pivots almost entirely on Products at $13.2B, with minimal Services and Other revenue. AMAT’s diversified mix supports infrastructure dominance and ecosystem lock-in. STM’s reliance on product sales signals concentration risk but highlights focus on semiconductor components and microcontrollers.
Strengths and Weaknesses Comparison
This table compares the strengths and weaknesses of Applied Materials and STMicroelectronics:
Applied Materials Strengths
- High net margin (24.67%) and ROE (34.28%) indicate strong profitability
- Favorable current and quick ratios show solid liquidity
- Moderate debt-to-assets (19.42%) with high interest coverage (35.46)
- Diverse revenue streams across semiconductor systems and services
- Significant global presence in China, Korea, Taiwan, and the US
STMicroelectronics Strengths
- Favorable PE and PB ratios suggest attractive valuation metrics
- Low debt-to-assets (8.6%) and infinite interest coverage imply low financial risk
- Strong liquidity with quick ratio at 2.43
- Wide geographic reach including Singapore, Switzerland, and the US
- Product and service offerings diversified across automotive, analog, and digital segments
Applied Materials Weaknesses
- Elevated WACC (11.37%) and high PE (26.58) and PB (9.11) ratios may pressure valuation
- Dividend yield is low at 0.74%
- Asset turnover is only neutral at 0.78, limiting operational efficiency
- Revenue concentration in semiconductor systems segment
- Exposure to geopolitical risks in China and Taiwan markets
STMicroelectronics Weaknesses
- Very low profitability with net margin at 1.41% and ROE below 1%
- Unfavorable current ratio at 3.36 may indicate working capital inefficiency
- Asset turnover is weak at 0.48, reflecting low operating efficiency
- Dividend yield is zero, limiting income return
- Revenue heavily reliant on product sales with less service diversification
Overall, Applied Materials demonstrates robust profitability and liquidity but faces valuation and concentration risks. STMicroelectronics shows financial conservatism and valuation appeal but struggles with profitability and operational efficiency. These profiles suggest different strategic priorities in capital allocation and market focus.
The Moat Duel: Analyzing Competitive Defensibility
A structural moat is the only reliable barrier protecting long-term profits from relentless competition erosion. Let’s dissect the moats of two semiconductor giants:
Applied Materials, Inc. (AMAT): Technology-Driven Scale and Intangible Assets
AMAT’s moat stems from its advanced manufacturing equipment and proprietary technologies. Its high ROIC above WACC signals efficient capital use and value creation. In 2026, expanding services and new chip fabrication technologies could deepen this moat despite a slightly declining ROIC trend.
STMicroelectronics N.V. (STM): Diversified Product Portfolio Amid Profit Pressure
STM relies on a broad product mix across automotive and industrial semiconductors, contrasting AMAT’s focus on manufacturing tech. Yet, its negative ROIC versus WACC reveals value destruction and weak capital efficiency. Market disruptions in automotive chips may offer growth, but profitability remains under severe pressure.
Verdict: Advanced Manufacturing Excellence vs. Product Breadth Under Profit Stress
AMAT boasts the deeper moat with consistent value creation and technological leadership. STM’s broad portfolio lacks capital efficiency, reflected in steep profitability declines. AMAT is better positioned to defend and grow its market share in 2026.
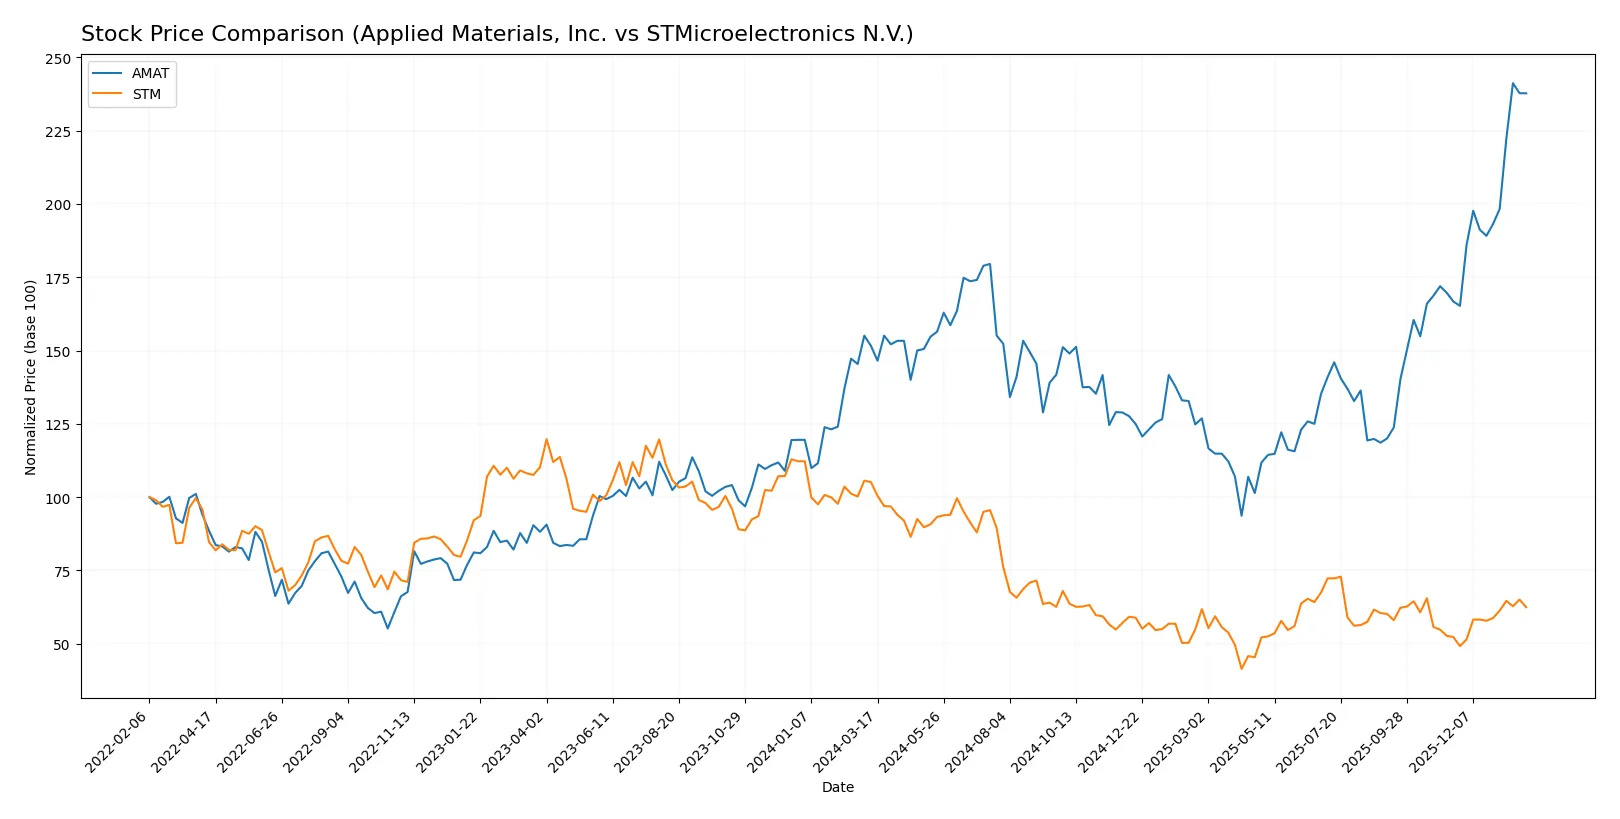
Which stock offers better returns?
Applied Materials, Inc. (AMAT) and STMicroelectronics N.V. (STM) show contrasting price movements over the past year, with AMAT accelerating upwards while STM trends downward despite recent recovery.
Trend Comparison
Applied Materials, Inc. (AMAT) demonstrates a strong bullish trend over the past 12 months, with a 56.8% price increase and accelerating momentum. It reached a high of 327.01 and a low of 126.95.
STMicroelectronics N.V. (STM) shows a bearish trend over the same period, falling by 40.6%, though with accelerating decline. Its price ranged between 18.49 and 46.95 despite recent positive gains.
AMAT outperformed STM significantly, delivering the highest market performance over the last year, driven by robust price appreciation and stronger upward momentum.
Target Prices
Analysts project a moderate upside for Applied Materials and STMicroelectronics based on current consensus targets.
| Company | Target Low | Target High | Consensus |
|---|---|---|---|
| Applied Materials, Inc. | 273 | 400 | 347.38 |
| STMicroelectronics N.V. | 28 | 45 | 37.67 |
Applied Materials’ consensus target of 347 sits about 8% above its current 322 price, suggesting limited but positive appreciation. STMicroelectronics’ target consensus at 37.67 implies a more significant upside of roughly 35% from the current price near 28.

Don’t Let Luck Decide Your Entry Point
Optimize your entry points with our advanced ProRealTime indicators. You’ll get efficient buy signals with precise price targets for maximum performance. Start outperforming now!
How do institutions grade them?
Applied Materials, Inc. Grades
Here are the recent grades assigned by reputable grading companies for Applied Materials, Inc.:
| Grading Company | Action | New Grade | Date |
|---|---|---|---|
| Mizuho | Upgrade | Outperform | 2026-01-28 |
| Deutsche Bank | Upgrade | Buy | 2026-01-23 |
| Needham | Maintain | Buy | 2026-01-20 |
| Keybanc | Maintain | Overweight | 2026-01-16 |
| Barclays | Upgrade | Overweight | 2026-01-15 |
| Wells Fargo | Maintain | Overweight | 2026-01-15 |
| Stifel | Maintain | Buy | 2026-01-14 |
| B of A Securities | Maintain | Buy | 2026-01-13 |
| Susquehanna | Upgrade | Positive | 2026-01-12 |
| Cantor Fitzgerald | Maintain | Overweight | 2026-01-08 |
STMicroelectronics N.V. Grades
Below are the latest grades from trusted grading firms for STMicroelectronics N.V.:
| Grading Company | Action | New Grade | Date |
|---|---|---|---|
| TD Cowen | Maintain | Buy | 2025-10-24 |
| Susquehanna | Maintain | Positive | 2025-10-22 |
| Susquehanna | Maintain | Positive | 2025-07-25 |
| Susquehanna | Maintain | Positive | 2025-07-22 |
| Baird | Upgrade | Outperform | 2025-07-22 |
| Jefferies | Upgrade | Buy | 2025-02-19 |
| Bernstein | Downgrade | Market Perform | 2025-02-05 |
| Susquehanna | Maintain | Positive | 2025-01-31 |
| Barclays | Downgrade | Underweight | 2025-01-22 |
| JP Morgan | Downgrade | Neutral | 2024-12-09 |
Which company has the best grades?
Applied Materials consistently receives higher and more recent upgrades, including multiple “Buy” and “Outperform” ratings. STMicroelectronics shows mixed trends with some downgrades and older ratings. Investors might view Applied Materials as more favorably positioned by institutions.
Risks specific to each company
The following categories identify the critical pressure points and systemic threats facing both firms in the 2026 market environment:
1. Market & Competition
Applied Materials, Inc.
- Dominates semiconductor equipment with broad tech portfolio but faces intense competition from integrated rivals.
STMicroelectronics N.V.
- Serves diverse semiconductor segments with regional strengths but competes in highly fragmented analog and automotive markets.
2. Capital Structure & Debt
Applied Materials, Inc.
- Maintains moderate leverage (D/E 0.35) with strong interest coverage (35.46x), supporting financial flexibility.
STMicroelectronics N.V.
- Exhibits low leverage (D/E 0.12) and infinite interest coverage, signaling conservative capital structure but potentially under-leveraged.
3. Stock Volatility
Applied Materials, Inc.
- Higher beta (1.67) indicates elevated sensitivity to market swings, increasing risk during downturns.
STMicroelectronics N.V.
- Lower beta (1.29) suggests comparatively less volatility, offering some defensive qualities amid sector cyclicality.
4. Regulatory & Legal
Applied Materials, Inc.
- U.S. base exposes it to stringent export controls and trade tensions with China.
STMicroelectronics N.V.
- European headquarters face complex EU regulations and geopolitical trade uncertainties, especially related to automotive standards.
5. Supply Chain & Operations
Applied Materials, Inc.
- Global manufacturing footprint offers resilience but is vulnerable to Asia-Pacific supply disruptions.
STMicroelectronics N.V.
- Diverse production sites mitigate risks but rely heavily on global supply chains sensitive to geopolitical shifts.
6. ESG & Climate Transition
Applied Materials, Inc.
- Increasingly integrates ESG into operations, yet faces pressure to reduce carbon footprint in energy-intensive fabs.
STMicroelectronics N.V.
- Strong focus on sustainable products and climate initiatives but must improve transparency and reporting standards.
7. Geopolitical Exposure
Applied Materials, Inc.
- Significant exposure to U.S.-China tech rivalry risks disrupting sales and supply chains.
STMicroelectronics N.V.
- Operating across Europe, Middle East, and Asia-Pacific, faces multifaceted geopolitical tensions impacting market access.
Which company shows a better risk-adjusted profile?
Applied Materials confronts its highest risk in geopolitical tensions affecting its supply chain and market access. STMicroelectronics’ greatest vulnerability lies in weak profitability metrics amid stiff competition. Despite AMAT’s higher stock volatility, its robust capital structure and superior profitability yield a stronger risk-adjusted profile. Notably, AMAT’s Altman Z-Score of 14.2 confirms excellent financial safety, while STM’s lower net margin (1.41%) signals persistent earnings challenges.
Final Verdict: Which stock to choose?
Applied Materials, Inc. (AMAT) excels as a cash-generating powerhouse with a durable competitive edge, driven by its ability to create value above capital costs. Its slight decline in profitability and premium valuation are points of vigilance. AMAT suits investors targeting aggressive growth with resilience in cyclical markets.
STMicroelectronics N.V. (STM) holds a strategic moat in diversified semiconductor markets, supported by a strong balance sheet and conservative leverage. However, it currently struggles with declining profitability and growth headwinds, reflecting a more cautious profile than AMAT. STM fits portfolios seeking growth at a reasonable price with better downside protection.
If you prioritize robust value creation and market leadership, AMAT outshines with strong returns and accelerating price momentum. However, if you seek stability and lower leverage in the semiconductor sector, STM offers better defensive characteristics despite weaker profitability. Both present distinct analytical scenarios tailored to different risk appetites.
Disclaimer: Investment carries a risk of loss of initial capital. The past performance is not a reliable indicator of future results. Be sure to understand risks before making an investment decision.
Go Further
I encourage you to read the complete analyses of Applied Materials, Inc. and STMicroelectronics N.V. to enhance your investment decisions: