Home > Comparison > Technology > AMAT vs SWKS
The strategic rivalry between Applied Materials, Inc. and Skyworks Solutions, Inc. shapes the semiconductor sector’s evolution. Applied Materials operates as a capital-intensive equipment and services provider, while Skyworks focuses on high-margin semiconductor components. This clash represents a contrast between manufacturing scale and specialized innovation. This analysis will determine which business model offers superior risk-adjusted returns for a diversified portfolio amid ongoing technological advancements.
Table of contents
Companies Overview
Applied Materials and Skyworks Solutions stand as pivotal semiconductor players shaping modern technology infrastructure.
Applied Materials, Inc.: Semiconductor Manufacturing Powerhouse
Applied Materials dominates semiconductor equipment manufacturing. It generates revenue by selling advanced fabrication tools and software crucial for chip production. In 2026, its strategic focus centers on expanding its Semiconductor Systems segment, integrating cutting-edge technologies like atomic layer deposition and metrology tools to enhance chip fabrication precision. Its industry leadership reflects deep expertise in manufacturing innovation.
Skyworks Solutions, Inc.: Semiconductor Components Specialist
Skyworks Solutions excels in designing and marketing proprietary semiconductor components, including amplifiers and front-end modules. Its revenue stream depends on diverse product sales across aerospace, automotive, and consumer electronics sectors. In 2026, the company emphasizes broadening its product applications in connected devices and wireless infrastructure. Skyworks’ core competitive edge lies in its extensive IP portfolio and diversified market reach.
Strategic Collision: Similarities & Divergences
Both companies operate within semiconductors but pursue distinct philosophies: Applied Materials offers a closed ecosystem of fabrication equipment, while Skyworks provides an open infrastructure of semiconductor components. Their primary battleground lies in advancing semiconductor technology adoption across consumer and industrial markets. Investors encounter contrasting profiles: Applied Materials embodies capital-intensive manufacturing scale, whereas Skyworks thrives on product innovation and market versatility.
Income Statement Comparison
This data dissects the core profitability and scalability of both corporate engines to reveal who dominates the bottom line:
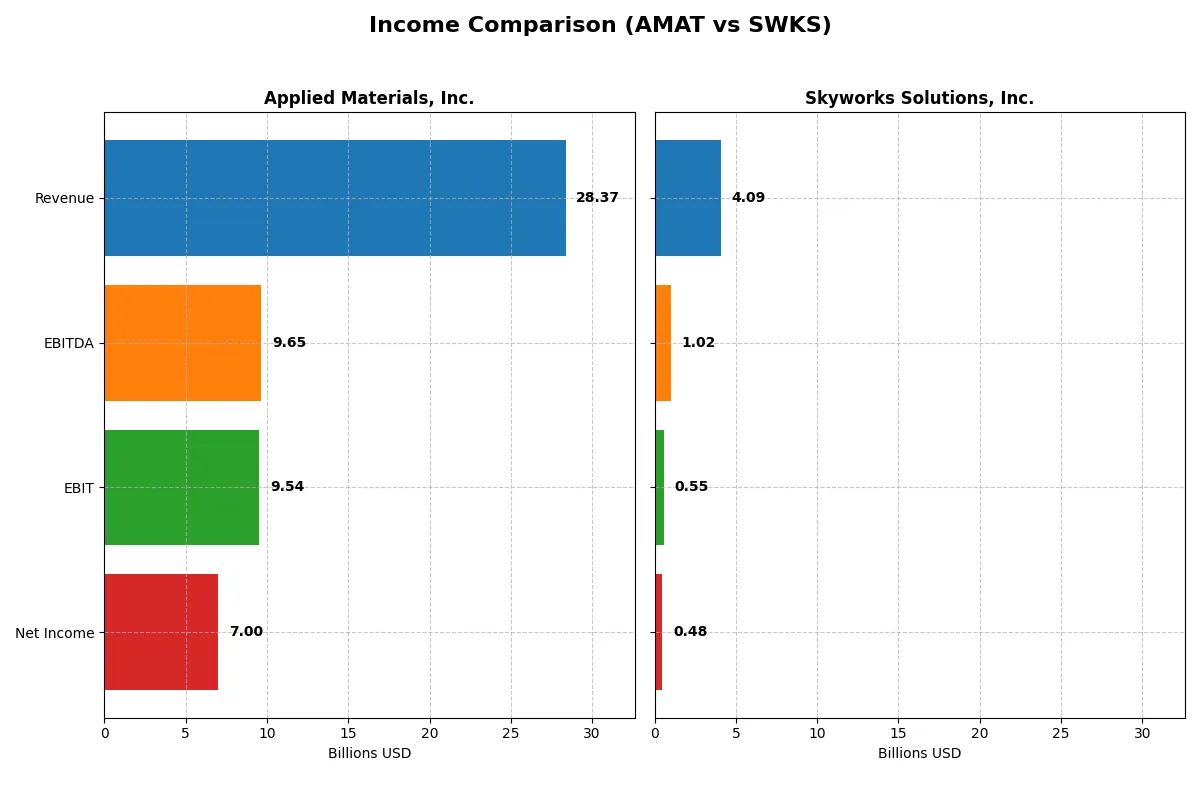
| Metric | Applied Materials, Inc. (AMAT) | Skyworks Solutions, Inc. (SWKS) |
|---|---|---|
| Revenue | 28.4B | 4.09B |
| Cost of Revenue | 14.6B | 2.40B |
| Operating Expenses | 5.52B | 1.18B |
| Gross Profit | 13.8B | 1.68B |
| EBITDA | 9.65B | 1.02B |
| EBIT | 9.54B | 554M |
| Interest Expense | 269M | 27.1M |
| Net Income | 7.00B | 477M |
| EPS | 8.71 | 3.09 |
| Fiscal Year | 2025 | 2025 |
Income Statement Analysis: The Bottom-Line Duel
This income statement comparison exposes the true efficiency and profitability dynamics of two leading semiconductor players.
Applied Materials, Inc. Analysis
Applied Materials steadily grows revenue from $23B in 2021 to $28.4B in 2025. Net income rises from $5.9B to $7B, sustaining a robust 24.7% net margin in 2025. Gross and EBIT margins exceed 48% and 33%, respectively, reflecting strong operational leverage. Despite slight net margin compression recently, the company maintains solid momentum and margin discipline.
Skyworks Solutions, Inc. Analysis
Skyworks’ revenue declines from $5.1B in 2021 to $4.1B in 2025, with net income sliding sharply from $1.5B to $477M. Its 2025 net margin of 11.7% and gross margin of 41.2% mark a weaker profitability profile. Recent margin contraction and negative growth trends highlight challenges in sustaining earnings and controlling costs amid a shrinking top line.
Margin Strength vs. Revenue Resilience
Applied Materials demonstrates superior margin health and revenue growth, outpacing Skyworks significantly in scale and profitability. AMAT’s ability to expand EBIT and maintain high gross margins signals operational efficiency. Conversely, Skyworks faces declining sales and shrinking earnings, warning of structural headwinds. For investors, AMAT’s profile offers a stronger combination of growth and margin stability.
Financial Ratios Comparison
These vital ratios act as a diagnostic tool to expose the underlying fiscal health, valuation premiums, and capital efficiency of the companies compared below:
| Ratios | Applied Materials, Inc. (AMAT) | Skyworks Solutions, Inc. (SWKS) |
|---|---|---|
| ROE | 34.3% | 8.3% |
| ROIC | 21.9% | 6.4% |
| P/E | 26.6 | 25.0 |
| P/B | 9.1 | 2.1 |
| Current Ratio | 2.61 | 2.33 |
| Quick Ratio | 1.87 | 1.76 |
| D/E | 0.35 | 0.21 |
| Debt-to-Assets | 19.4% | 15.2% |
| Interest Coverage | 30.8 | 18.5 |
| Asset Turnover | 0.78 | 0.52 |
| Fixed Asset Turnover | 5.54 | 2.95 |
| Payout Ratio | 19.8% | 90.7% |
| Dividend Yield | 0.74% | 3.63% |
| Fiscal Year | 2025 | 2025 |
Efficiency & Valuation Duel: The Vital Signs
Financial ratios serve as a company’s DNA, uncovering hidden risks and operational strengths that shape investment decisions.
Applied Materials, Inc.
Applied Materials demonstrates robust profitability with a 34.3% ROE and a strong 24.7% net margin, reflecting operational excellence. However, the stock appears expensive with a 26.6 P/E and a 9.11 P/B, signaling stretched valuation. Shareholders receive a modest 0.74% dividend yield, while substantial R&D investment drives long-term growth.
Skyworks Solutions, Inc.
Skyworks posts a moderate 11.7% net margin but a weak 8.3% ROE, indicating less efficient capital use. The valuation is more balanced with a 24.9 P/E and 2.07 P/B, neither cheap nor overpriced. The company rewards shareholders with a 3.63% dividend yield, highlighting a focus on income rather than aggressive reinvestment.
Premium Valuation vs. Income Focus
Applied Materials offers a superior profitability profile but at a premium price, while Skyworks balances valuation with higher dividends. Investors prioritizing growth and operational strength may prefer Applied Materials. Those seeking steady income with moderate risk might find Skyworks more fitting.
Which one offers the Superior Shareholder Reward?
I compare Applied Materials (AMAT) and Skyworks Solutions (SWKS) by their dividend yields, payout ratios, and share buybacks. AMAT pays a modest 0.77% yield with a low payout ratio near 17%, preserving ample FCF for growth and buybacks. SWKS offers a higher 3.63% dividend yield but carries a steep 90% payout ratio, risking cash flow flexibility. Both run solid buyback programs, but AMAT’s lower payout ratio and strong free cash flow coverage suggest more sustainable capital allocation. I conclude AMAT delivers a superior total return profile in 2026, balancing income and growth prudently.
Comparative Score Analysis: The Strategic Profile
The radar chart reveals the fundamental DNA and trade-offs of Applied Materials and Skyworks Solutions, highlighting their core strategic strengths and weaknesses:
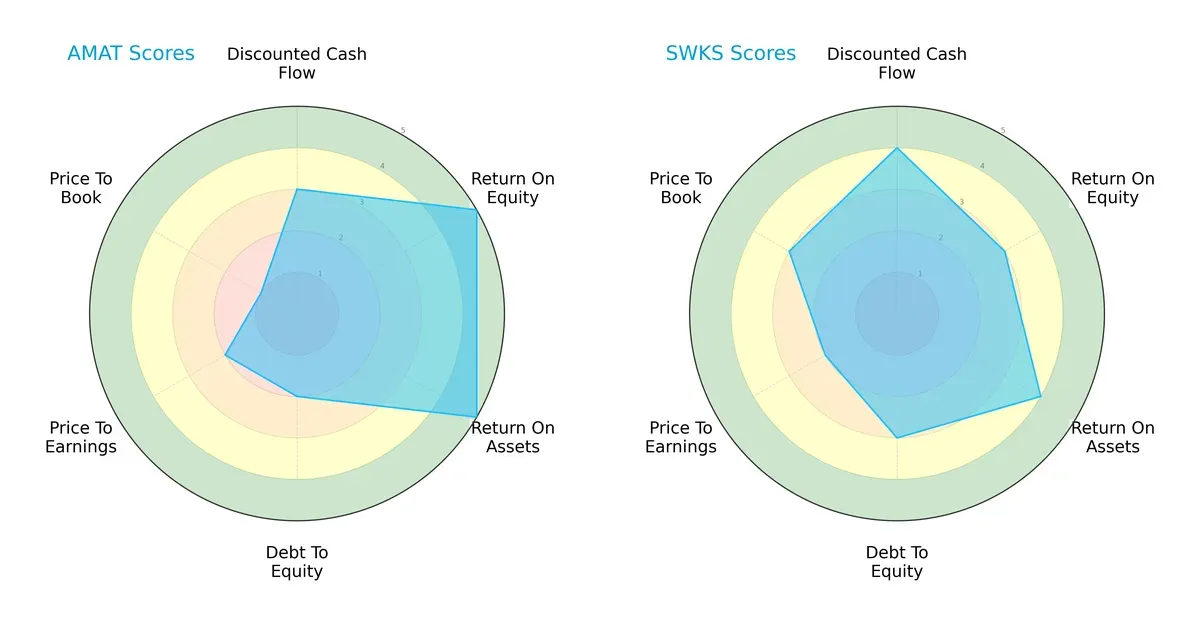
Applied Materials excels in profitability metrics with top ROE and ROA scores (5 each), signaling superior capital efficiency. In contrast, Skyworks leads in discounted cash flow (4 vs. 3) and maintains a healthier debt profile (debt-to-equity score 3 vs. 2). Valuation metrics favor Skyworks, especially in price-to-book (3 vs. 1), reflecting a less penalized market perception. Overall, Applied Materials presents a pronounced edge in operational returns but carries valuation and leverage risks, while Skyworks offers a more balanced profile across cash flow and financial stability.
Bankruptcy Risk: Solvency Showdown
The Altman Z-Score gap underscores strong solvency for both firms but with distinct margins:
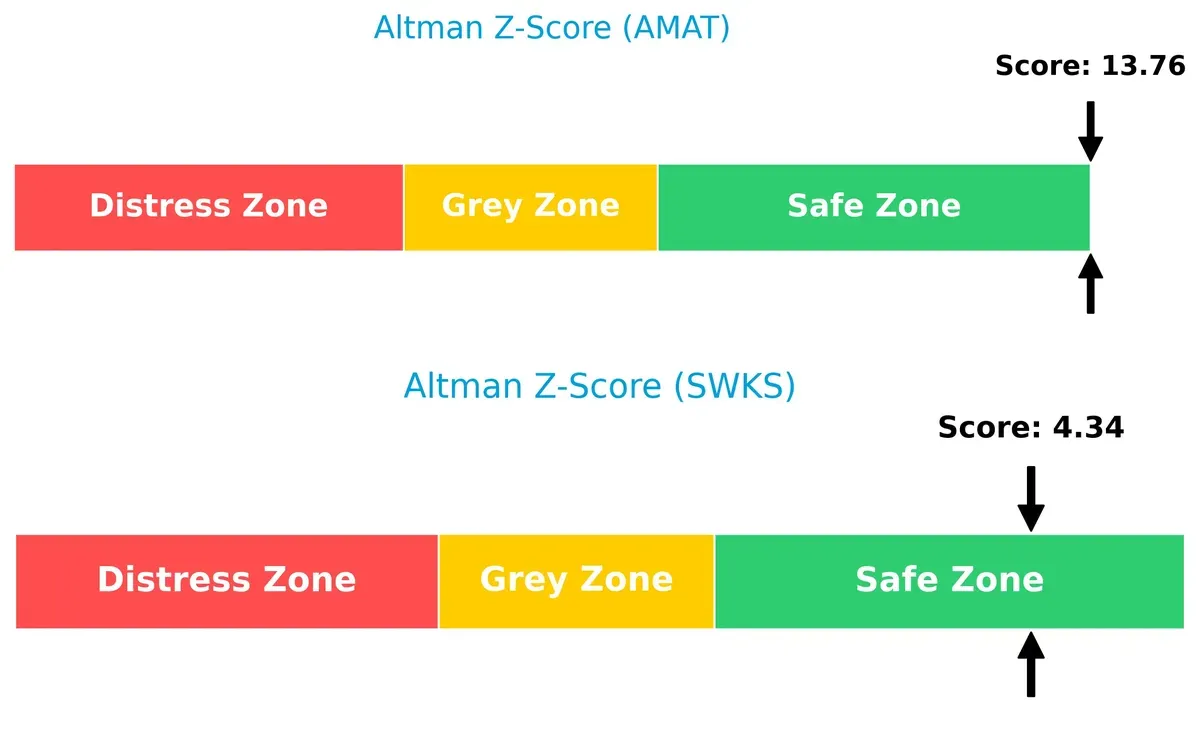
Applied Materials’ extremely high Z-Score (13.76) places it deep in the safe zone, indicating rock-solid financial resilience amid market volatility. Skyworks also stays safely above distress thresholds with a 4.34 score, but the margin is narrower. This suggests Applied Materials commands a more robust buffer against bankruptcy risk, an important consideration in cyclical downturns.
Financial Health: Quality of Operations
Both companies share strong internal financial health with identical Piotroski F-Scores of 7, indicating solid operational quality:
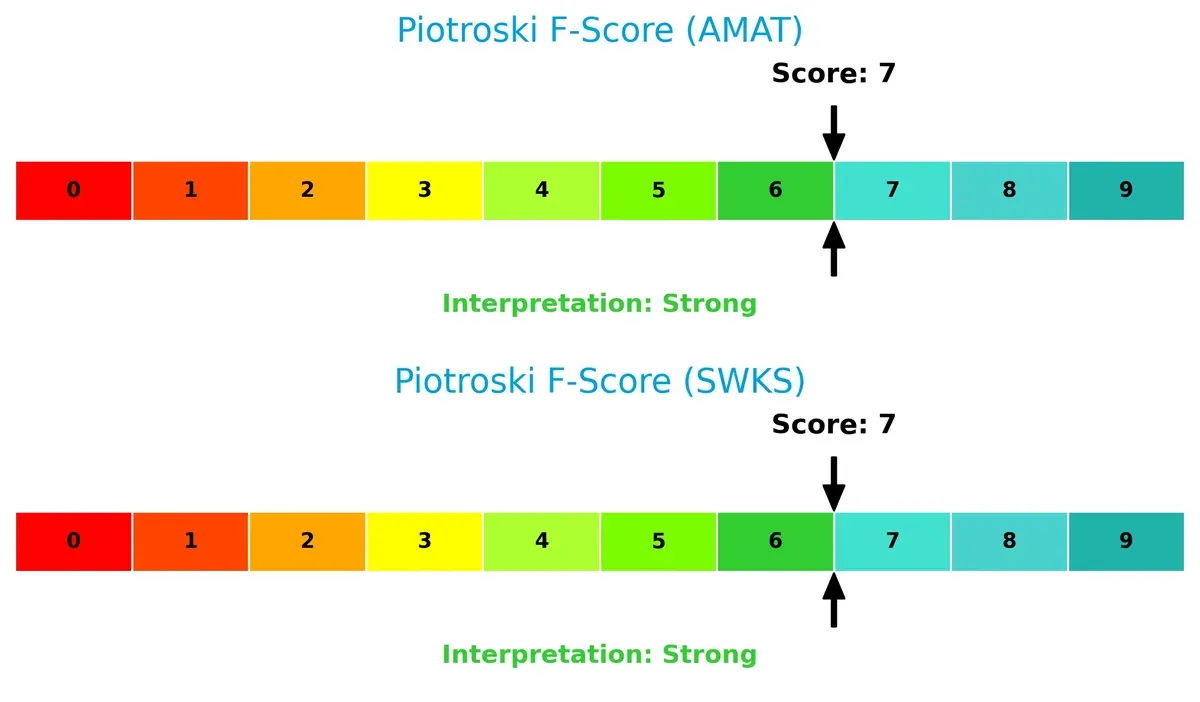
Scores near 7 reflect well-managed profitability, leverage, and liquidity. Neither shows immediate red flags internally, but the tie suggests investors must look beyond surface metrics to differentiate growth potential and risk exposure. I see both firms as fundamentally sound but with different strategic profiles to balance in portfolio construction.
How are the two companies positioned?
This section dissects the operational DNA of Applied Materials and Skyworks by comparing their revenue distribution and internal dynamics. The goal is to confront their economic moats to reveal which model offers the most resilient competitive advantage today.
Revenue Segmentation: The Strategic Mix
The following visual comparison dissects how Applied Materials, Inc. and Skyworks Solutions, Inc. diversify their income streams and where their primary sector bets lie:
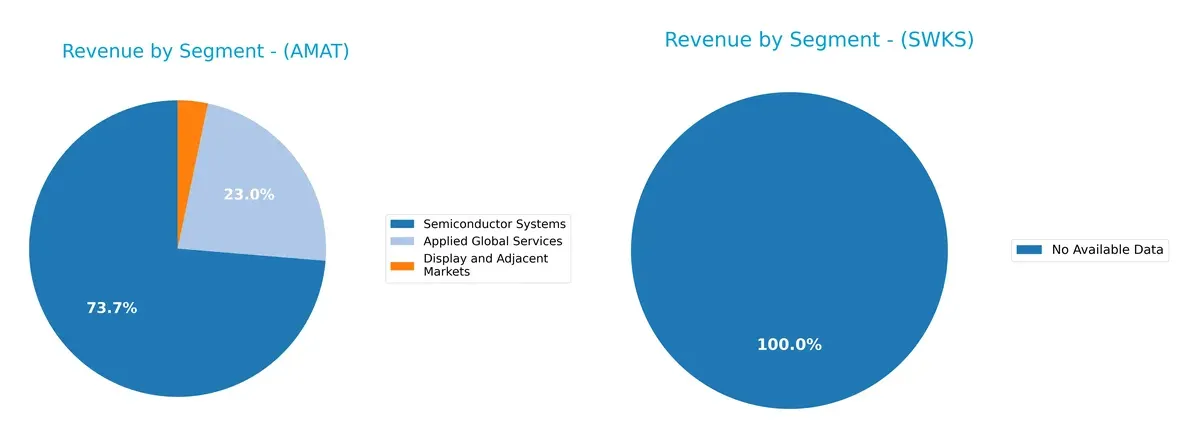
Applied Materials anchors its revenue with Semiconductor Systems at $19.9B in 2024, dwarfing other segments like Applied Global Services at $6.2B and Display and Adjacent Markets at $885M. This concentration highlights a strategic focus on semiconductor infrastructure dominance with moderate service diversification. Skyworks Solutions lacks reported data, preventing an apples-to-apples comparison and raising caution on understanding its sector bets.
Strengths and Weaknesses Comparison
This table compares the Strengths and Weaknesses of Applied Materials, Inc. (AMAT) and Skyworks Solutions, Inc. (SWKS):
AMAT Strengths
- High profitability with 24.67% net margin
- Strong ROE at 34.28% and ROIC at 21.96%
- Favorable liquidity ratios with current ratio 2.61 and quick ratio 1.87
- Low debt levels with debt-to-assets at 19.42%
- Broad global presence with significant revenue from China, Korea, and Taiwan
- Diversified revenue streams across semiconductor systems and global services
SWKS Strengths
- Solid net margin at 11.67%
- Favorable liquidity with current ratio 2.33 and quick ratio 1.76
- Low leverage with debt-to-assets at 15.2%
- Higher dividend yield at 3.63%
- Concentrated but stable U.S. revenue base over 3B USD
- Moderate valuation with PE and PB ratios near sector averages
AMAT Weaknesses
- Unfavorable valuation metrics: high PE at 26.58 and PB at 9.11
- Weighted average cost of capital (WACC) at 11.43% exceeds ROIC
- Dividend yield low at 0.74%
- Neutral asset turnover at 0.78 limits efficiency insight
- Heavy exposure to China market risks
- Lower growth visibility outside semiconductor systems segment
SWKS Weaknesses
- Low ROE at 8.29% and neutral ROIC at 6.35% suggest weaker capital returns
- Neutral PE at 24.95 and PB at 2.07 could limit upside
- Asset turnover and fixed asset turnover neutral at 0.52 and 2.95
- Revenue geographically concentrated mainly in the U.S.
- Smaller scale and less diversified product base compared to peers
Overall, AMAT demonstrates superior profitability and diversification with a strong global footprint, but faces valuation and capital efficiency challenges. SWKS offers stable liquidity and a higher dividend yield but struggles with lower returns on equity and geographic concentration. These factors shape each company’s strategic focus and risk profile.
The Moat Duel: Analyzing Competitive Defensibility
A structural moat is the only thing protecting long-term profits from the erosion of competition. Let’s examine how it applies to these two semiconductor players:
Applied Materials, Inc. (AMAT): Technological Scale and Service Integration Moat
AMAT’s primary moat stems from its advanced manufacturing equipment and integrated services. It sustains high ROIC above WACC by maintaining gross margins near 49% and EBIT margins above 33%. Despite a recent decline in ROIC, new product innovations and global service expansions in Asia could deepen its competitive edge in 2026.
Skyworks Solutions, Inc. (SWKS): Niche Product Specialization and IP Moat
SWKS relies on proprietary analog semiconductor products and intellectual property, a narrower moat compared to AMAT’s scale. However, it struggles with negative ROIC versus WACC and shrinking margins. The company faces headwinds but may find growth opportunities in emerging wireless and automotive markets if it reverses its declining profitability trend.
Verdict: Scale and Integration vs. Specialized IP Resilience
AMAT holds a wider, more durable moat with consistent value creation despite some profitability erosion. SWKS’s moat is narrower and currently under pressure, risking market share loss. AMAT is better equipped to defend its semiconductor market dominance through scale and service integration.
Which stock offers better returns?
Over the past year, Applied Materials surged with a 60.42% gain and accelerating momentum, while Skyworks Solutions declined 46.26% amid decelerating losses.
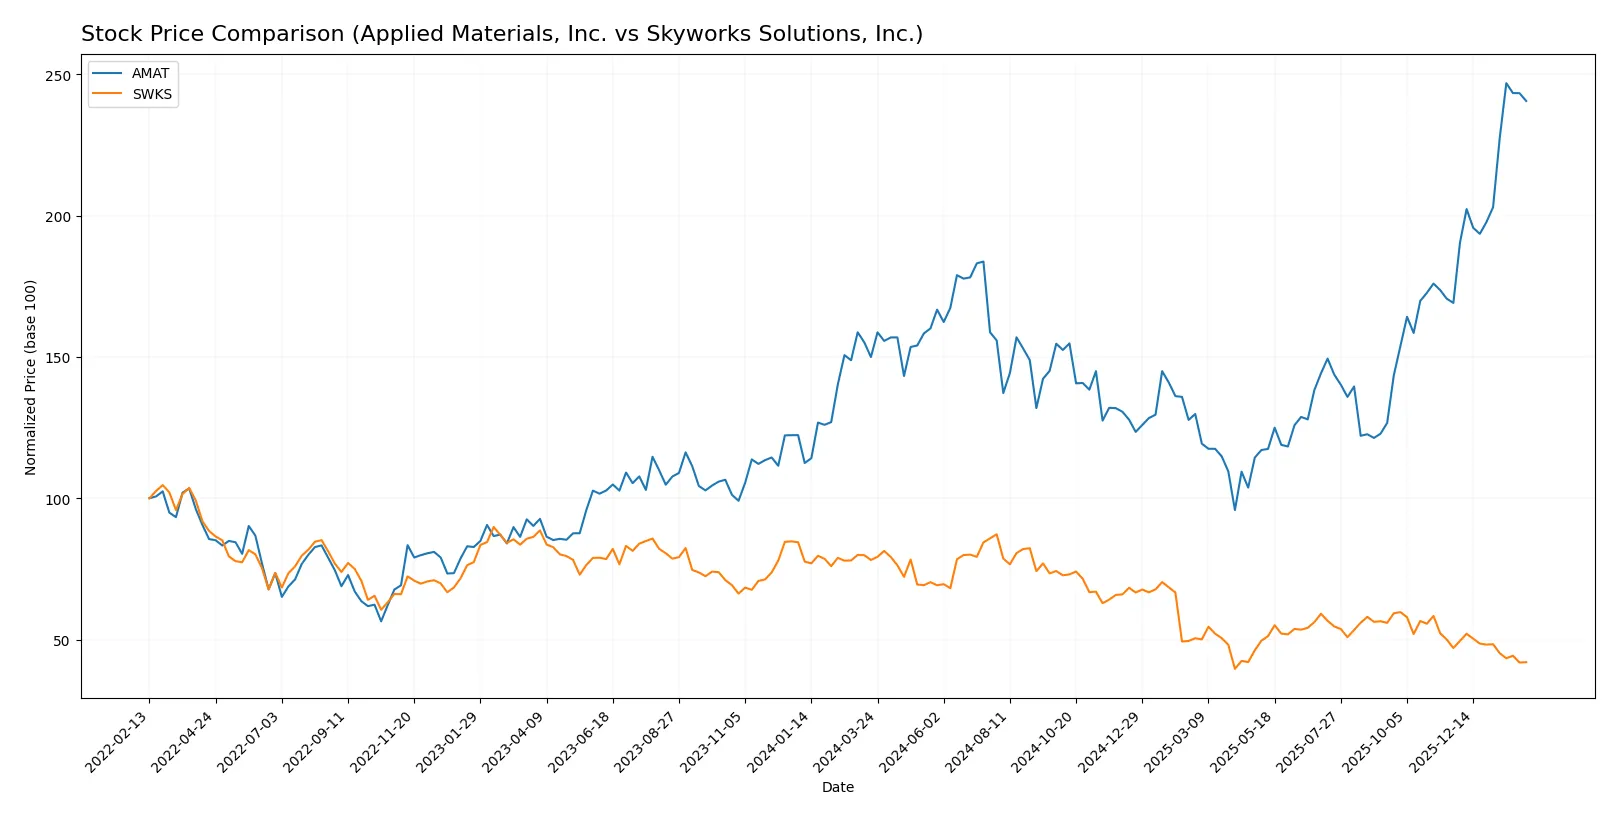
Trend Comparison
Applied Materials shows a strong bullish trend over 12 months, with a 60.42% price rise and accelerating gains. Volatility is high, reflected in a 40.75 standard deviation.
Skyworks Solutions exhibits a bearish trend, declining 46.26% over the same period with deceleration. Volatility is lower at 16.54, signaling less price fluctuation.
Applied Materials outperformed Skyworks Solutions significantly, delivering the highest market returns and stronger upward momentum in the last year.
Target Prices
Analysts present a mixed but cautiously optimistic target consensus for Applied Materials and Skyworks Solutions.
| Company | Target Low | Target High | Consensus |
|---|---|---|---|
| Applied Materials, Inc. | 290 | 405 | 360.56 |
| Skyworks Solutions, Inc. | 60 | 140 | 78.8 |
Applied Materials’ consensus target of 360.56 suggests upside from the current 318.67, reflecting confidence in its semiconductor equipment leadership. Skyworks’ target consensus of 78.8 is well above its 55.93 price, indicating expectations of recovery in its semiconductor components business.

Don’t Let Luck Decide Your Entry Point
Optimize your entry points with our advanced ProRealTime indicators. You’ll get efficient buy signals with precise price targets for maximum performance. Start outperforming now!
How do institutions grade them?
The following tables summarize recent institutional grades for Applied Materials, Inc. and Skyworks Solutions, Inc.:
Applied Materials, Inc. Grades
This table shows the latest grades and actions from key grading companies for Applied Materials.
| Grading Company | Action | New Grade | Date |
|---|---|---|---|
| Morgan Stanley | Maintain | Overweight | 2026-02-02 |
| Mizuho | Upgrade | Outperform | 2026-01-28 |
| Deutsche Bank | Upgrade | Buy | 2026-01-23 |
| Needham | Maintain | Buy | 2026-01-20 |
| Keybanc | Maintain | Overweight | 2026-01-16 |
| Barclays | Upgrade | Overweight | 2026-01-15 |
| Wells Fargo | Maintain | Overweight | 2026-01-15 |
| Stifel | Maintain | Buy | 2026-01-14 |
| B of A Securities | Maintain | Buy | 2026-01-13 |
| Susquehanna | Upgrade | Positive | 2026-01-12 |
Skyworks Solutions, Inc. Grades
This table presents recent institutional grades and actions for Skyworks Solutions.
| Grading Company | Action | New Grade | Date |
|---|---|---|---|
| Morgan Stanley | Maintain | Equal Weight | 2026-02-02 |
| Mizuho | Maintain | Neutral | 2026-01-26 |
| B. Riley Securities | Maintain | Neutral | 2026-01-26 |
| Susquehanna | Maintain | Neutral | 2026-01-22 |
| UBS | Maintain | Neutral | 2026-01-20 |
| Mizuho | Upgrade | Neutral | 2025-11-11 |
| UBS | Maintain | Neutral | 2025-11-05 |
| JP Morgan | Maintain | Neutral | 2025-11-05 |
| Citigroup | Upgrade | Neutral | 2025-10-29 |
| UBS | Maintain | Neutral | 2025-10-29 |
Which company has the best grades?
Applied Materials consistently earns upgrades and overweight/buy ratings, indicating strong institutional confidence. Skyworks holds steady at neutral or equal weight, reflecting a more cautious outlook. Investors may view Applied Materials as favored by analysts relative to Skyworks.
Risks specific to each company
The following categories identify the critical pressure points and systemic threats facing both firms in the 2026 market environment:
1. Market & Competition
Applied Materials, Inc. (AMAT)
- Dominates semiconductor manufacturing equipment with strong market share and technological edge.
Skyworks Solutions, Inc. (SWKS)
- Faces intense competition in analog and mixed-signal semiconductors, with pressure from diversified chipmakers.
2. Capital Structure & Debt
Applied Materials, Inc. (AMAT)
- Maintains a conservative debt-to-equity ratio of 0.35 with strong interest coverage at 35.46x.
Skyworks Solutions, Inc. (SWKS)
- Shows lower leverage at 0.21 debt-to-equity and adequate interest coverage of 20.44x, reflecting solid balance sheet.
3. Stock Volatility
Applied Materials, Inc. (AMAT)
- Exhibits higher beta (1.677), indicating greater sensitivity to market swings and cyclical semiconductor demand.
Skyworks Solutions, Inc. (SWKS)
- Lower beta (1.317) suggests relatively less volatility but still exposed to tech sector fluctuations.
4. Regulatory & Legal
Applied Materials, Inc. (AMAT)
- Exposure to export control regulations in China and global trade tensions impacting supply chain.
Skyworks Solutions, Inc. (SWKS)
- Faces similar geopolitical regulatory risks, especially U.S.-China tensions affecting semiconductor sales.
5. Supply Chain & Operations
Applied Materials, Inc. (AMAT)
- Complex global supply chain with exposure to component shortages and fab equipment lead times.
Skyworks Solutions, Inc. (SWKS)
- Relies on contract manufacturers and global suppliers, vulnerable to disruptions and component scarcity.
6. ESG & Climate Transition
Applied Materials, Inc. (AMAT)
- Invests in energy-efficient manufacturing technologies but faces rising pressure on emissions and waste management.
Skyworks Solutions, Inc. (SWKS)
- Progressing on sustainability goals but must enhance transparency and climate-related risk disclosures.
7. Geopolitical Exposure
Applied Materials, Inc. (AMAT)
- Significant revenue exposure in Asia, notably China, heightening geopolitical and trade war risks.
Skyworks Solutions, Inc. (SWKS)
- Also dependent on Asian markets, with potential supply disruptions and export restrictions as key risks.
Which company shows a better risk-adjusted profile?
Applied Materials faces its largest risk in market volatility amplified by high beta and global trade uncertainties. Skyworks contends primarily with competitive pressures in a fragmented semiconductor segment. AMAT’s robust financial health, strong interest coverage, and safer Z-score position it better for risk absorption. Recent data show AMAT’s superior Altman Z-score (13.76 vs. 4.34) and higher ROE, signaling stronger resilience. Therefore, Applied Materials offers a better risk-adjusted profile despite higher market sensitivity.
Final Verdict: Which stock to choose?
Applied Materials (AMAT) stands out as a powerhouse of operational efficiency and value creation. Its ability to generate returns well above its cost of capital signals a durable competitive advantage. However, investors should watch its declining ROIC trend as a potential red flag. AMAT suits aggressive growth portfolios seeking long-term capital appreciation.
Skyworks Solutions (SWKS) leverages a strategic moat rooted in niche semiconductor markets and steady recurring revenues. Its financial profile offers more balance and a stronger dividend yield, presenting less volatility than AMAT. SWKS fits well within GARP portfolios that value stability combined with measured growth potential.
If you prioritize aggressive capital growth through robust profitability and operational leverage, AMAT outshines with superior value creation despite some margin erosion. However, if you seek better stability and dividend income with a defensible niche, SWKS offers a safer analytical scenario despite its current profitability challenges.
Disclaimer: Investment carries a risk of loss of initial capital. The past performance is not a reliable indicator of future results. Be sure to understand risks before making an investment decision.
Go Further
I encourage you to read the complete analyses of Applied Materials, Inc. and Skyworks Solutions, Inc. to enhance your investment decisions: