Home > Comparison > Technology > AMAT vs SLAB
The strategic rivalry between Applied Materials, Inc. and Silicon Laboratories Inc. shapes the semiconductor sector’s evolution. Applied Materials operates as a capital-intensive equipment manufacturer with a global footprint. Silicon Laboratories focuses on fabless design, delivering high-margin mixed-signal solutions for IoT applications. This analysis pits industrial scale against innovation agility to determine which model offers superior risk-adjusted returns for a diversified portfolio in today’s dynamic technology landscape.
Table of contents
Companies Overview
Applied Materials and Silicon Laboratories play pivotal roles in the semiconductor industry, shaping technology’s future.
Applied Materials, Inc.: Semiconductor Manufacturing Powerhouse
Applied Materials dominates semiconductor equipment manufacturing with a broad portfolio. It generates revenue by selling advanced fabrication tools and software. In 2026, it focuses on enhancing fab efficiency and expanding its global footprint, leveraging its diverse technology stack across semiconductor systems and display markets.
Silicon Laboratories Inc.: Mixed-Signal Innovator for IoT
Silicon Laboratories leads in analog-intensive mixed-signal solutions for IoT applications. Its core revenue stems from wireless microcontrollers and sensors. The company prioritizes expanding its connected device ecosystem in smart homes and industrial automation, capitalizing on rising IoT adoption worldwide.
Strategic Collision: Similarities & Divergences
Both firms target semiconductor innovation but differ fundamentally. Applied Materials emphasizes a hardware-centric, broad-market approach with heavy manufacturing equipment, while Silicon Labs follows a fabless model focused on software-driven mixed-signal innovation. They compete mainly in semiconductor technology but serve distinct niches. Their investment profiles contrast sharply: one is a global fabrication enabler, the other a specialized IoT component provider.
Income Statement Comparison
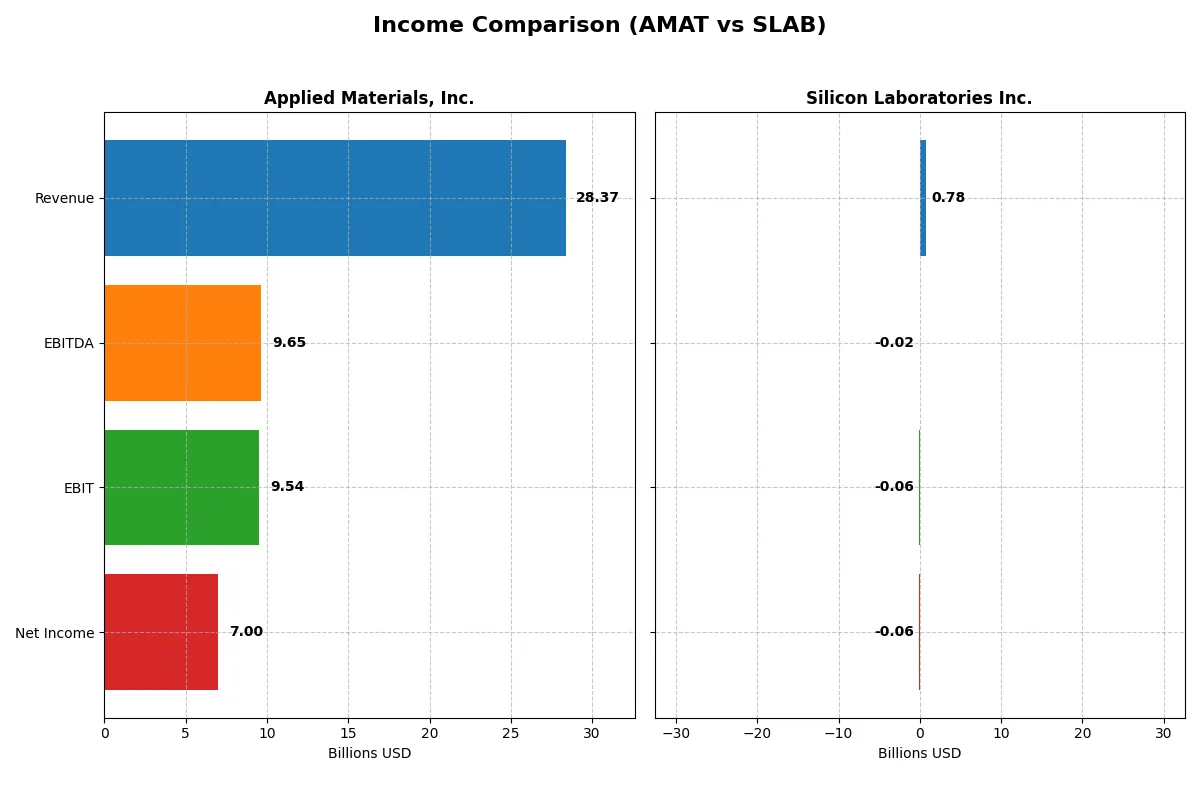
The following data dissects the core profitability and scalability of both corporate engines to reveal who dominates the bottom line:
| Metric | Applied Materials, Inc. (AMAT) | Silicon Laboratories Inc. (SLAB) |
|---|---|---|
| Revenue | 28.4B | 785M |
| Cost of Revenue | 14.6B | 328M |
| Operating Expenses | 5.52B | 528M |
| Gross Profit | 13.8B | 457M |
| EBITDA | 9.65B | -19M |
| EBIT | 9.54B | -57M |
| Interest Expense | 269M | 975K |
| Net Income | 7.00B | -65M |
| EPS | 8.71 | -1.98 |
| Fiscal Year | 2025 | 2025 |
Income Statement Analysis: The Bottom-Line Duel
This income statement comparison reveals which company operates with superior efficiency and profitability under current market conditions.
Applied Materials, Inc. Analysis
Applied Materials shows steady revenue growth, reaching $28.4B in 2025 with net income at $7B. Its gross margin remains robust near 49%, reflecting strong cost control despite rising expenses. The net margin at 24.7% signals solid profitability. In 2025, EBIT surged 13.6%, demonstrating operational momentum, although net margin slightly declined, indicating margin pressure.
Silicon Laboratories Inc. Analysis
Silicon Laboratories expanded revenue sharply by 34% to $785M in 2025, with gross margin improving to 58.2%. However, it posted a net loss of $65M, reflecting continued unprofitability and a negative net margin of -8.3%. Despite a 63% EBIT growth and improving EPS, the company struggles to convert top-line gains into profits, showing operational challenges at scale.
Margin Strength vs. Growth Trajectory
Applied Materials clearly outperforms with consistent profitability and high margins, delivering dependable earnings growth. Silicon Laboratories impresses with rapid revenue and gross profit gains but remains fundamentally loss-making. Investors seeking stability will favor Applied Materials’ mature, margin-focused profile, while Silicon Laboratories suits those prioritizing accelerated top-line expansion despite ongoing losses.
Financial Ratios Comparison
These vital ratios act as a diagnostic tool to expose the underlying fiscal health, valuation premiums, and capital efficiency of the companies compared:
| Ratios | Applied Materials, Inc. (AMAT) | Silicon Laboratories Inc. (SLAB) |
|---|---|---|
| ROE | 34.3% | -5.9% |
| ROIC | 21.9% | -6.3% |
| P/E | 26.6 | -65.9 |
| P/B | 9.11 | 3.91 |
| Current Ratio | 2.61 | 4.69 |
| Quick Ratio | 1.87 | 4.02 |
| D/E (Debt-to-Equity) | 0.35 | 0 |
| Debt-to-Assets | 19.4% | 0% |
| Interest Coverage | 30.8 | -72.3 |
| Asset Turnover | 0.78 | 0.62 |
| Fixed Asset Turnover | 5.54 | 6.10 |
| Payout Ratio | 19.8% | 0% |
| Dividend Yield | 0.74% | 0% |
| Fiscal Year | 2025 | 2025 |
Efficiency & Valuation Duel: The Vital Signs
Ratios act as a company’s DNA, revealing hidden risks and operational excellence beyond surface-level metrics.
Applied Materials, Inc.
Applied Materials delivers robust profitability with a 34.3% ROE and a strong 24.7% net margin, signaling operational efficiency. Yet, its valuation appears stretched, with a 26.6 P/E and a high 9.11 P/B ratio. Shareholders receive a modest 0.74% dividend yield, reflecting a balanced approach between returns and reinvestment in R&D, which accounts for 12.6% of revenue.
Silicon Laboratories Inc.
Silicon Labs struggles with negative profitability metrics: a -5.9% ROE and an -8.3% net margin, indicating ongoing operational challenges. Despite a negative P/E, its P/B ratio of 3.91 suggests moderate valuation pressure. The company pays no dividends, heavily investing in R&D at 45% of revenue, emphasizing growth over current shareholder returns amid financial headwinds.
Premium Valuation vs. Operational Safety
Applied Materials offers a favorable ratio profile with strong returns but trades at a premium, while Silicon Labs shows significant risks and losses despite aggressive R&D spending. Investors prioritizing stability and proven profitability might prefer Applied Materials, whereas those targeting growth potential amid uncertainty may consider Silicon Labs’ profile.
Which one offers the Superior Shareholder Reward?
Applied Materials, Inc. (AMAT) pays a consistent dividend with a 0.78% yield and a sustainable 17% payout ratio backed by strong free cash flow of 9B. Its buyback program is robust, complementing returns. Silicon Laboratories Inc. (SLAB) offers no dividends, reinvesting heavily in growth amid losses. Its buybacks are negligible. I find AMAT’s balanced pay-out and buyback strategy delivers superior total shareholder returns in 2026. SLAB’s reinvestment strategy is risky given negative margins and volatile cash flows. AMAT’s model better aligns with long-term value and income stability.
Comparative Score Analysis: The Strategic Profile
The radar chart reveals the fundamental DNA and trade-offs of Applied Materials, Inc. and Silicon Laboratories Inc., highlighting their contrasting financial strengths and weaknesses:
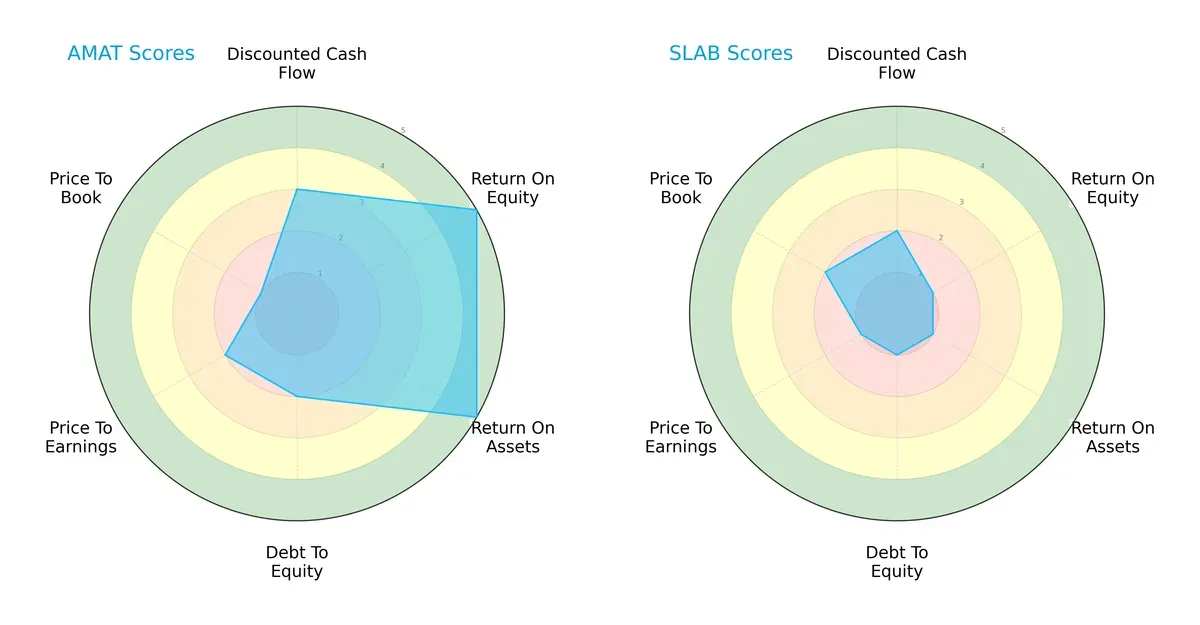
Applied Materials dominates in profitability with strong ROE and ROA scores (5 each), indicating efficient asset and equity utilization. Silicon Laboratories lags with very unfavorable scores in these categories (1 each). AMAT shows moderate financial risk with a debt-to-equity score of 2, while SLAB scores a worrying 1, signaling higher leverage risk. Valuation metrics paint a mixed picture: AMAT’s low P/E and very unfavorable P/B scores suggest potential undervaluation but caution on book value, whereas SLAB has moderate P/B but very unfavorable P/E. Overall, AMAT presents a more balanced and robust profile, relying on operational efficiency, while SLAB depends heavily on valuation factors despite weaker fundamentals.
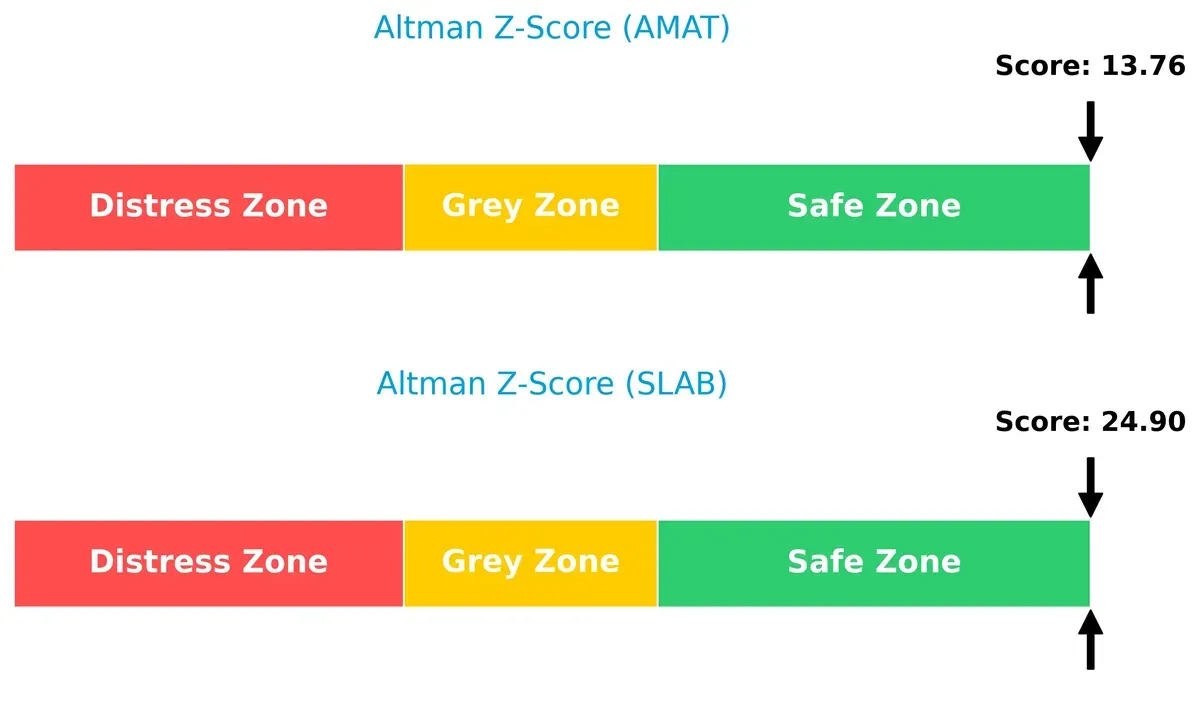
Bankruptcy Risk: Solvency Showdown
Applied Materials and Silicon Laboratories both sit comfortably in the safe zone by Altman Z-Score standards. However, SLAB’s score of 24.9 far exceeds AMAT’s 13.8, implying even stronger financial stability and lower bankruptcy risk in this cycle:
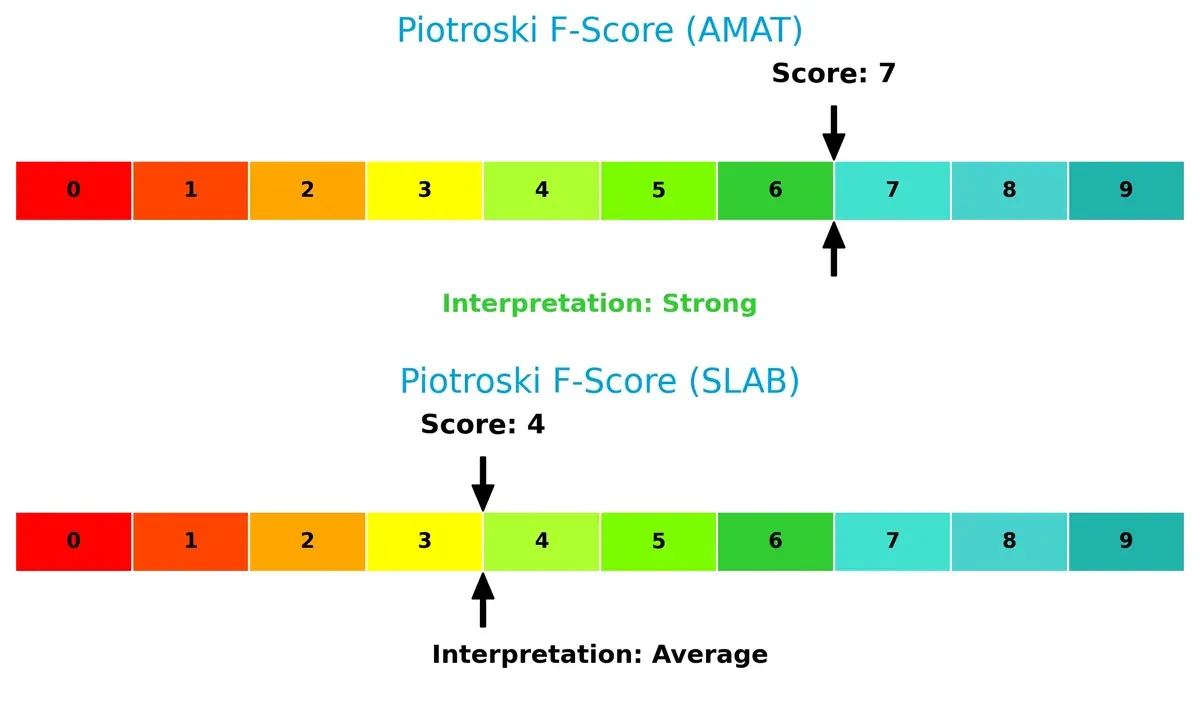
Financial Health: Quality of Operations
Applied Materials outperforms Silicon Laboratories with a Piotroski F-Score of 7 versus 4, signaling stronger internal financial health and fewer red flags. SLAB’s average score suggests caution on profitability and operational efficiency:
How are the two companies positioned?
This section dissects AMAT and SLAB’s operational DNA by comparing their revenue distribution and internal dynamics—strengths and weaknesses. The goal is to confront their economic moats and reveal which model offers the most resilient, sustainable competitive advantage today.
Revenue Segmentation: The Strategic Mix
This visual comparison dissects how Applied Materials, Inc. and Silicon Laboratories Inc. diversify their income streams and where their primary sector bets lie:
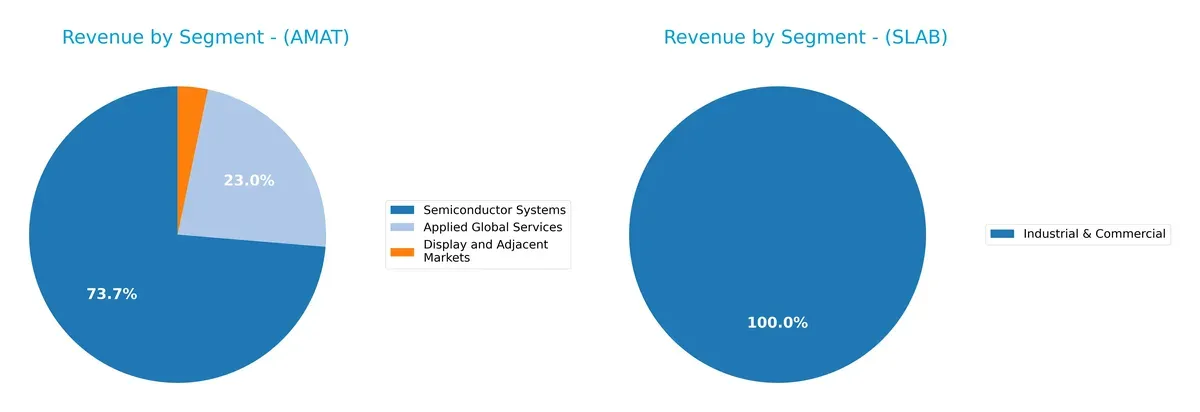
Applied Materials anchors revenue heavily in Semiconductor Systems at $19.9B, with Services contributing $6.2B and Display markets $885M. Silicon Laboratories relies almost entirely on its Industrial & Commercial segment at $339M, showing limited diversification. AMAT’s broad semiconductor ecosystem creates a moat and infrastructure dominance, while SLAB’s narrow focus heightens concentration risk but may allow specialized market agility. This contrast defines their strategic risk profiles.
Strengths and Weaknesses Comparison
This table compares the strengths and weaknesses of Applied Materials, Inc. (AMAT) and Silicon Laboratories Inc. (SLAB):
AMAT Strengths
- Diverse revenue streams across semiconductor systems, global services, and display markets
- Strong profitability with 24.67% net margin and 34.28% ROE
- Solid liquidity with current ratio 2.61 and low debt-to-assets 19.42%
- High fixed asset turnover of 5.54 indicating efficient asset use
- Significant global presence with large revenue in China, Korea, Taiwan, and US
SLAB Strengths
- Favorable price-to-earnings metric reflecting market valuation
- Zero debt supporting a conservative capital structure
- Strong quick ratio 4.02 indicating good short-term liquidity
- High fixed asset turnover of 6.1 showing operational efficiency
- Steady revenue from industrial and commercial segments
AMAT Weaknesses
- Elevated WACC at 11.41% reduces return spread
- High price-to-book ratio of 9.11 may signal overvaluation
- Dividend yield low at 0.74%, less attractive for income investors
- Asset turnover moderate at 0.78, showing room for improvement
SLAB Weaknesses
- Negative profitability with net margin -8.27% and ROE -5.93%
- Unfavorable interest coverage at -58.4 indicating financial stress
- Current ratio unusually high at 4.69, possibly inefficient asset use
- Price-to-book ratio 3.91 considered high relative to weak earnings
- No dividend yield, limiting income appeal
Overall, AMAT demonstrates robust profitability and diversified global operations but faces valuation and cost-of-capital challenges. SLAB’s strengths lie in liquidity and asset efficiency, yet profitability and financial risk remain significant concerns. These factors will influence each company’s strategic focus on growth and capital allocation.
The Moat Duel: Analyzing Competitive Defensibility
A structural moat is the only true shield protecting long-term profits from relentless competition erosion:
Applied Materials, Inc. (AMAT): Capital-Intensive Innovation Moat
AMAT’s competitive edge stems from its cost advantage and intangible assets in semiconductor manufacturing tech. Its high ROIC (10.5% above WACC) and stable margins confirm this moat. However, a declining ROIC trend signals emerging pressures in 2026.
Silicon Laboratories Inc. (SLAB): Niche IoT Specialization Moat
SLAB relies on product differentiation in analog-intensive mixed-signal solutions, differing from AMAT’s scale. Yet, negative ROIC versus WACC (-17.4%) and shrinking profitability challenge its moat’s depth. Growth in IoT markets offers expansion but profit sustainability is uncertain.
Capital Efficiency vs. Niche Innovation: Who Holds the Moat Stronger?
AMAT exhibits a wider and deeper moat with positive value creation despite recent margin pressure. SLAB’s moat is narrower, hindered by value destruction and weak capital returns. AMAT is better positioned to defend and grow its market share in 2026.
Which stock offers better returns?
The past year saw strong upward momentum for both stocks, with notable acceleration in price gains. Trading volume trends reveal shifting buyer-seller dynamics impacting recent price action.
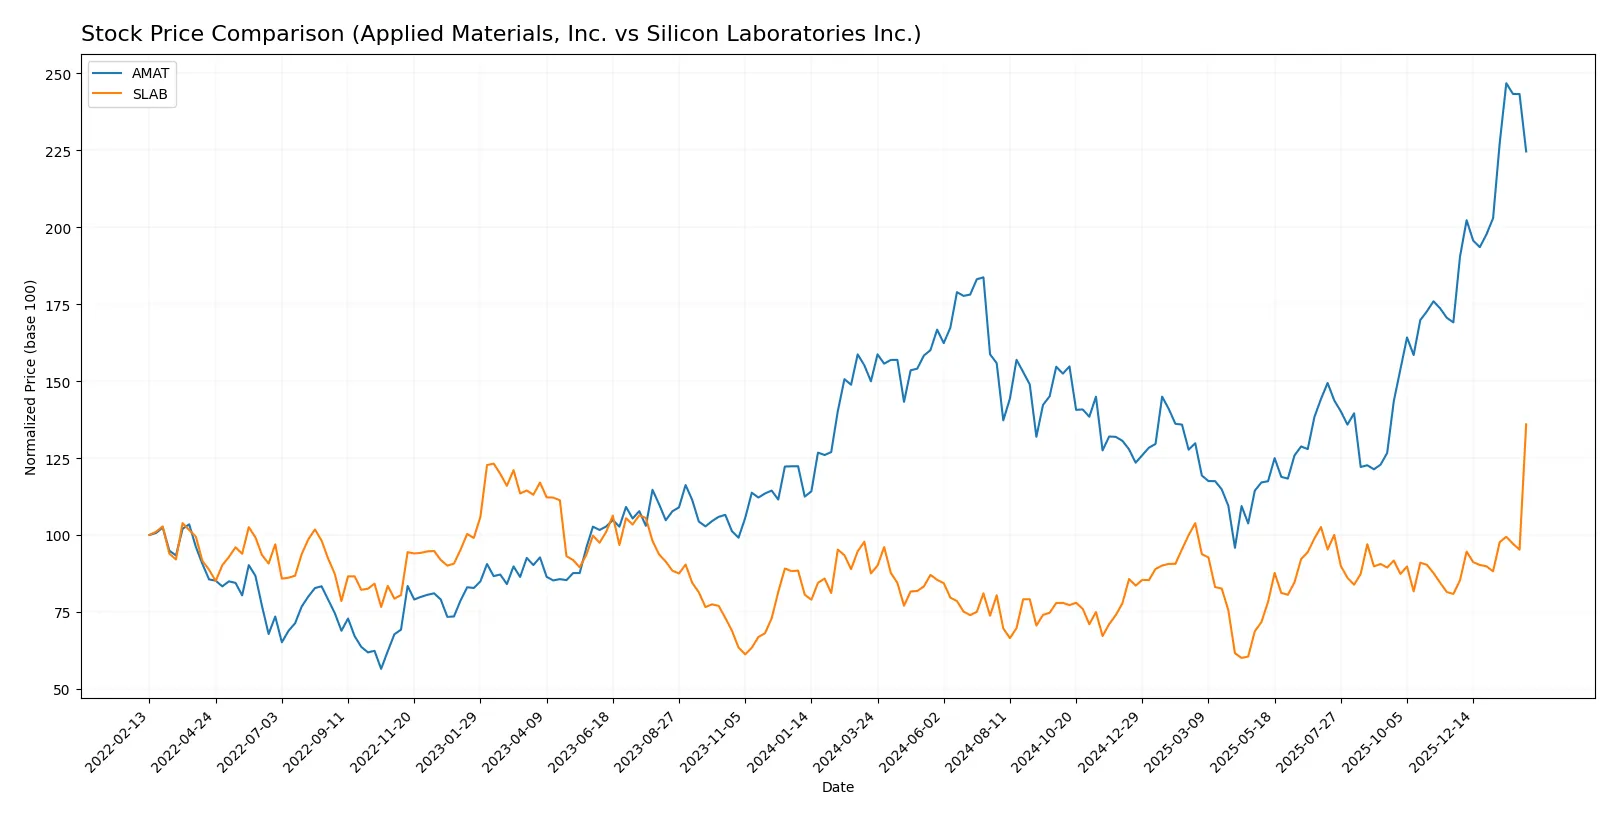
Trend Comparison
Applied Materials, Inc. (AMAT) shows a 49.81% price increase over the past 12 months, indicating a bullish trend with accelerating gains. Price volatility is high, ranging from 127 to 327.
Silicon Laboratories Inc. (SLAB) recorded a 55.39% price rise over the same period, also bullish with acceleration. Volatility is moderate, with prices between 90 and 203, and a strong recent upswing.
SLAB outperformed AMAT by 5.58% over 12 months, delivering the highest market return with less volatility and stronger recent buyer dominance.
Target Prices
Analysts present a bullish consensus for Applied Materials and Silicon Laboratories, reflecting strong sector fundamentals.
| Company | Target Low | Target High | Consensus |
|---|---|---|---|
| Applied Materials, Inc. | 290 | 405 | 360.56 |
| Silicon Laboratories Inc. | 160 | 231 | 207.33 |
The consensus target for AMAT sits about 21% above its current price of 298, signaling upside potential. SLAB’s target consensus is near its current price of 203, suggesting limited near-term valuation expansion.

Don’t Let Luck Decide Your Entry Point
Optimize your entry points with our advanced ProRealTime indicators. You’ll get efficient buy signals with precise price targets for maximum performance. Start outperforming now!
How do institutions grade them?
Applied Materials, Inc. Grades
The following table summarizes recent institutional grades for Applied Materials, Inc.:
| Grading Company | Action | New Grade | Date |
|---|---|---|---|
| Citigroup | Maintain | Buy | 2026-02-04 |
| Morgan Stanley | Maintain | Overweight | 2026-02-02 |
| Mizuho | Upgrade | Outperform | 2026-01-28 |
| Deutsche Bank | Upgrade | Buy | 2026-01-23 |
| Needham | Maintain | Buy | 2026-01-20 |
| Keybanc | Maintain | Overweight | 2026-01-16 |
| Wells Fargo | Maintain | Overweight | 2026-01-15 |
| Barclays | Upgrade | Overweight | 2026-01-15 |
| Stifel | Maintain | Buy | 2026-01-14 |
| B of A Securities | Maintain | Buy | 2026-01-13 |
Silicon Laboratories Inc. Grades
The following table summarizes recent institutional grades for Silicon Laboratories Inc.:
| Grading Company | Action | New Grade | Date |
|---|---|---|---|
| Benchmark | Downgrade | Hold | 2026-02-04 |
| Keybanc | Downgrade | Sector Weight | 2026-02-04 |
| Needham | Downgrade | Hold | 2026-02-04 |
| Susquehanna | Maintain | Neutral | 2025-08-06 |
| Morgan Stanley | Maintain | Equal Weight | 2025-08-06 |
| Barclays | Maintain | Equal Weight | 2025-08-05 |
| Susquehanna | Maintain | Neutral | 2025-07-22 |
| Stifel | Maintain | Buy | 2025-07-18 |
| Keybanc | Maintain | Overweight | 2025-07-08 |
| Benchmark | Maintain | Buy | 2025-05-27 |
Which company has the best grades?
Applied Materials, Inc. holds consistently stronger grades with multiple upgrades to Buy and Outperform. Silicon Laboratories Inc. faces recent downgrades to Hold and Sector Weight. These trends could influence investor sentiment and risk appetite.
Risks specific to each company
The following categories identify the critical pressure points and systemic threats facing both firms in the 2026 market environment:
1. Market & Competition
Applied Materials, Inc.
- Faces intense competition in semiconductor manufacturing equipment from large incumbents; market cyclicality affects demand.
Silicon Laboratories Inc.
- Competes in niche analog and mixed-signal IoT markets; smaller scale limits pricing power and exposure to rapid technology shifts.
2. Capital Structure & Debt
Applied Materials, Inc.
- Maintains moderate leverage (D/E 0.35) with strong interest coverage (35.46x), signaling financial stability.
Silicon Laboratories Inc.
- No debt on the books, but negative interest coverage indicates operational losses and weak earnings.
3. Stock Volatility
Applied Materials, Inc.
- Beta of 1.68 implies higher volatility than the market; recent 6.6% price drop signals sensitivity to semiconductor cycles.
Silicon Laboratories Inc.
- Beta of 1.56 suggests high volatility; recent 48.9% price surge adds speculative risk.
4. Regulatory & Legal
Applied Materials, Inc.
- Operates globally with exposure to export controls and environmental regulations; complex compliance risks.
Silicon Laboratories Inc.
- Faces regulatory risks in IoT and wireless sectors; smaller scale may limit legal resources.
5. Supply Chain & Operations
Applied Materials, Inc.
- Global operations expose it to supply chain disruptions, especially in Asia-Pacific semiconductor hubs.
Silicon Laboratories Inc.
- Fabless model reduces capital intensity but increases dependence on third-party foundries and suppliers.
6. ESG & Climate Transition
Applied Materials, Inc.
- Under pressure to reduce carbon footprint and resource use in manufacturing equipment; ESG compliance critical.
Silicon Laboratories Inc.
- Faces increasing demands for sustainable IoT products but limited scale to invest aggressively in climate initiatives.
7. Geopolitical Exposure
Applied Materials, Inc.
- Significant Asia exposure risks from US-China tensions impacting supply chains and market access.
Silicon Laboratories Inc.
- Also exposed to geopolitical risks in China and global IoT markets but less diversified geographically.
Which company shows a better risk-adjusted profile?
Applied Materials bears cyclical market risks but benefits from solid capital structure and profitability. Silicon Laboratories suffers from operational losses, elevated volatility, and weaker financial ratios, despite zero debt. Applied Materials’ robust Altman Z-Score (13.76) and Piotroski Score (7) confirm financial strength; Silicon Labs’ average Piotroski (4) and concerning interest coverage flag caution. The decisive risk is AMAT’s market cyclicality versus SLAB’s profitability shortfall. Overall, Applied Materials presents a superior risk-adjusted profile grounded in proven financial resilience, while Silicon Laboratories remains a higher-risk speculative play.
Final Verdict: Which stock to choose?
Applied Materials (AMAT) shines as a cash-generating titan with a proven ability to create shareholder value through efficient capital allocation. Its slight margin compression is a point of vigilance, signaling the need for close monitoring. AMAT suits portfolios aiming for steady, long-term growth anchored in industry leadership.
Silicon Laboratories (SLAB) offers a strategic moat in its specialized semiconductor niche, supported by robust R&D investment and accelerating revenue growth. However, its current value destruction and volatile profitability position it as a higher-risk play. SLAB fits investors seeking disruptive potential within a GARP (Growth at a Reasonable Price) framework.
If you prioritize resilient value creation and operational efficiency, AMAT is the compelling choice due to its strong economic moat and stable cash flows. However, if you seek aggressive growth fueled by innovation despite near-term profitability challenges, SLAB offers superior upside potential. Both demand careful risk assessment aligned with your investment horizon.
Disclaimer: Investment carries a risk of loss of initial capital. The past performance is not a reliable indicator of future results. Be sure to understand risks before making an investment decision.
Go Further
I encourage you to read the complete analyses of Applied Materials, Inc. and Silicon Laboratories Inc. to enhance your investment decisions: